ConvLSTMs for vertical ocean velocity prediction in the North Atlantic
←
→
Page content transcription
If your browser does not render page correctly, please read the page content below
ConvLSTMs for vertical ocean velocity prediction in
               the North Atlantic

                Meera A. Desai                                  David Lindo-Atichati
    Department of Earth and Planetary Sciences         Department of Earth and Planetary Sciences
      American Museum of Natural History                 American Museum of Natural History
             New York, NY 10027                                 New York, NY 10027
               mdesai@amnh.org
                                                         Applied Ocean Physics and Engineering
                                                         Woods Hole Oceanographic Institution
                                                                Woods Hole, MA 02543
                                                                  dlindo@amnh.org

                                              Abstract
         Up and downwelling events in the ocean play a critical role in the vertical mix-
         ing of ocean waters. This mixing is of utmost importance in the distribution of
         biological productivity in the ocean and potentially influences ocean uptake of
         atmospheric carbon dioxide. Prediction of up and downwelling events has been
         limited to predicting vertical velocities using ocean models, which provide the
         basis for general inferences about up and downwelling events but, with the excep-
         tion of sporadic data assimilation schemes that adjust model predictions, are not
         exclusively based on data. Therefore, ocean models cannot predict these vertical
         mixing events specifically and realistically. To address this glaring lack of a data
         driven approach to predicting vertical mixing processes in the ocean, which has
         immense implications for the study of eddies in the field and beyond, we create
         a dataset of vertical ageostrophic velocities by post processing satellite altimetry
         data. We train a Convolutional Long Short Term Memory (ConvLSTM) machine
         learning network on this data to predict future vertical velocities, and evaluate our
         model’s performance. We are able to achieve 4.77 x 10³ % less mean square error
         loss compared to a naive baseline method after training on 1088 groups of training
         data. This work lays foundations for the incorporation of deep learning techniques
         in oceanography at large.

1    Introduction
Vertical mixing events are characterized by localized high magnitude vertical velocities that persist
over time. Vertical mixing events in the ocean are usually driven by Ekman transport near the
coast and by mesoscale eddies, ocean eddies with characteristic radius scales on the order of 100
km [McGillicuddy Jr [2016]]. Our study focuses on the waters of the north Atlantic ocean off the
continental shelves, where vertical mixing events are caused by eddies.
The availability and quality of satellite altimetry data indicates that mesoscale eddies are ubiquitous in
the global ocean [Chelton et al. [2011]]. Upwelling associated with eddy driven high vertical velocities
generates visible signals in sea surface temperature, sea surface height and ocean biogeochemistry
fields [McGillicuddy Jr [2016]]. Through eddy pumping, cyclonic (anticyclonic) eddies can shift
isopycnals upward (downward), unstratify (stratify) the water column, and shoal (deepen) the mixed
layer [McGillicuddy Jr [2016]]. The upward eddy pumping brings nutrients closer to the euphotic
zone, where they are accessible by phytoplankton and organisms higher up in the food chain (e.g.,
sharks) [Gaube et al. [2019]].

Third Workshop on Machine Learning and the Physical Sciences (NeurIPS 2020), Vancouver, Canada.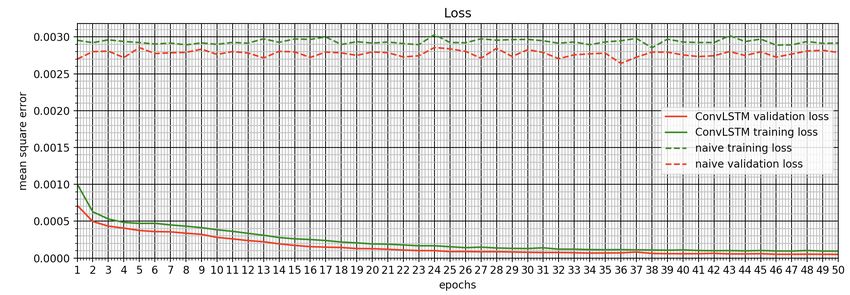
Figure 1: Vertical velocity field in the North Atlantic Ocean on 20 January 1993. Thin dashed purple
lines divide subregions 1, 2, and 3.

Deep learning has been used in oceanography as a tool for improving ocean model resolution [Bolton
and Zanna [2019]] and estimating ocean-wave conditions [James et al. [2018]], demonstrating that
deep learning can be leveraged to make predictions which respect physical principles in oceanography.
Our work leverages the work of [Xingjian et al. [2015]] introducing the ConvLSTM. The ConvLSTM
uses the basic structure of an LSTM but computes a convolution in place of a dot product, making the
network suitable for time series of images. ConvLSTMs have been applied with success in several
domains from vehicle traffic prediction [Yuan et al. [2018]] to temperature prediction [Lin et al.
[2019]]. Recently, ConvLSTMs have been applied in oceanography for volumetric ocean velocity
forecasting [Huang et al. [2020]]. Our work is distinct from [Huang et al. [2020]] in that we focus on
vertical ocean velocities as a proxy of vertical mixing events.

2     Data

2.1   Data

Our data comes from Marine Copernicus, the European Program for the establishment of a European
capacity for Earth Observation and Monitoring. From Marine Copernicus, we use the Global
ARMOR3D L4 Reprocessed dataset (GAL4R), which is a combination of satellite altimetry and
in-situ data with 0.25 degree resolution and weekly temporal resolution [Mulet et al. [2012]]. From
GAL4R, we use salinity, temperature, and depth, taking depth as an estimation of pressure [Thomson
and Emery [2014]]. We study the north Atlantic, using a spatial domain divided into three different
regions (Figure 1) to avoid the continental shelf where the satellite altimetry data is less accurate.
Satellite altimetry has proven to be a useful tool to study oceanic processes in the deep ocean. Over
continental shelves, however, the aliasing of unresolved high-frequency signals of tidal and wind-
induced forcing is the source of long-wavelength errors that contaminate altimetry measurements and
limit their use in shallow waters [Schlax and Chelton [1994]] [Ray [1998]].

2.2   Post processing

Vertical ocean velocities needed to study up and down welling events cannot be measured and indirect
methods are needed to estimate them. We use salinity, temperature, and depth to calculate seawater
density. We use this density data as input for the program developed by [Vélez-Belchí and Tintoré
[2001]]. This program computes the vertical velocity field via the quasi-geostrophic omega equation
from ocean density data to create a weekly dataset of vertical velocities in the north Atlantic Ocean.

                                                  2
Figure 2: Sample input data (weeks 1-5), label (week 6 - ground truth), and prediction (week 6 -
prediction) after 50 epochs of training. This data comes from the test dataset from subregion 1.
3 Methods
For this study we focus on the vertical velocities on the surface of the ocean; thus our data has a
matrix depth of 1. The data is divided in the same three regions (Figure 1) in order to keep the training
process computationally reasonable, with overlapping regions of size 10 pixels (2.5 degrees) added
for reconstruction. This results in subregion 1 spanning 47.625◦ W to 18.375◦ W and -31.125◦ N to
51.625◦ N, subregion 2 spanning 47.625◦ W to 18.375◦ W and 13.125◦ N to 33.625◦ N, and subregion
3 spanning 72.125◦ W to 45.125◦ W and 21.125◦ N to 39.875◦ N with sizes 117 x 82, 117 x 82, and
108 x 77 respectively. The data is organized into groups of 6 consecutive weeks with the first 5 weeks
as the input data and the sixth week as the label (Figure 2). For all three regions the data from January
1993 to December 2013 is used as training data and the data from January 2014 to June 2016 is used
as validation data during training, and the data from June 2016 to December 2018 is reserved for
testing the model after training, creating a 81.1% training, 9.6% validation, 9.5% testing split. Given
this split, we are left with 1088 groups of 6 weeks as training samples and 254 groups of 6 as testing
samples.
Given our five consecutive 2-D inputs mapping to a single 2-D output, we use a many-to-one style
ConvLSTM with 6 filters, each sized 6x6, followed by a single convolutional layer with 1 filter sized
3x3. At each step, we use padding to keep the height and width of our data uniform. We use a mean
square error (MSE) loss and the Adam optimizer with learning rate 0.001. We trained our ConvLSTM
for 50 epochs and test the model on the reserved testing data after training.
To benchmark our model’s performance we use a naive method taking the vertical velocities in the
fifth week as a prediction of the vertical velocities in the sixth week. The naive method is run on the
same training, validation, for 50 epochs and evaluated on the same testing data reserved for evaluating
the ConvLSTM method.
4 Results and future work
4.1 Results
We achieve a final model with an average MSE loss of 6.36 x 10⁻² across the three regions, compared
to an average MSE loss of 2.49 x 10⁻¹ with our naive method, a 4.77 x 10³ % improvement [Table 1].
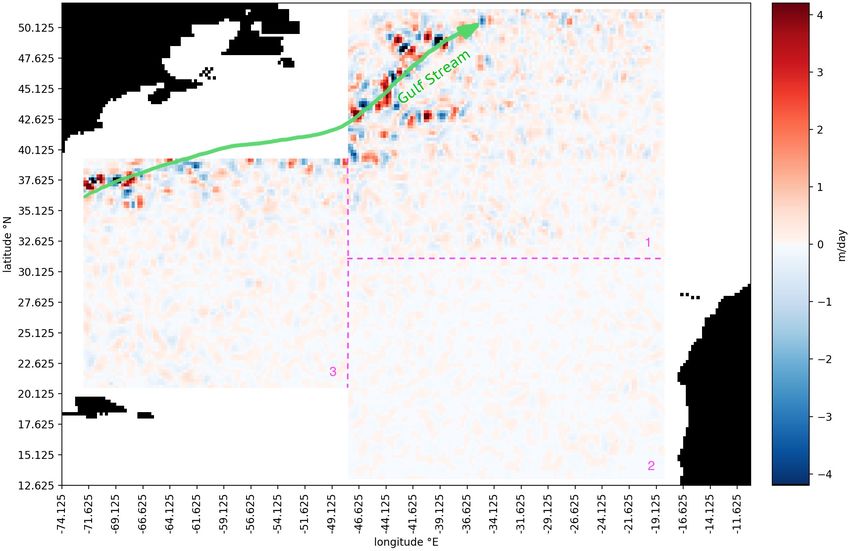
We observe little overfitting and model performance continues to make improvements through the
end of training, leveling out significantly around epoch 10 (Figure 3). Noteworthy, MSE in region 2
is three orders of magnitude less than MSE in regions 1 and 3. That finding is in agreement with the
significant differences in the Eddy Kinetic Energy that is found in eastern boundary currents such as
the Canary Islands southward flow in region 2, less than 100 cm2 s-2 [Zhou et al. [2000]], and western
boundary currents such as the Gulf Stream that flows along the northwestern areas of regions 1 and
3, more than 3000 cm2 s-2 [Richardson [1983]]. Also, this finding give us a frame of reference to
better understand the scales of the errors we can expect when applying ConvLSTM to very different
oceanic flows we observe in the Atlantic Ocean.
We study the spatial variability of the model’s performance by examining snapshots (ground truth),
predictions of the snapshots (predictions), and anomalies (predictions minus ground truth) of vertical
3Figure 3: Loss plot for subregion 2 showing training over 50 epochs for both naive and ConvLSTM
method. The ConvLSTM immediate outperforms the naive method, and continues to improve over
training time.
Region ConvLSTM MSE (test data) Naive MSE (test data) Percent difference
-2 -1
1 1.76 x 10 6.79 x 10 3.76 x 10³
-5 3
2 3.59 x 10 2.2 x 10 6.03 x 10³
-3 -2
3 1.44 x 10 6.65 x 10 4.52 x 10³
Average (3 regions) 6.36 x-10-3 2.49 x 10⁻¹ 4.77 x 10³
Table 1: Summary of performance on testing data for the ConvLSTM model and the naive baseline
method. In each region, the ConvLSTM model outperforms the naive baseline method by over
1000%. This result indicates that the ConvLSTM model is learning more than just the structure of the
vertical velocity data and making predictions.
ocean velocities for test data in subregion 1 (Figure 4). Overall, we observe that the ConvLSTM ap-
proach to vertical velocity prediction in the most energetic subregion of the North Atlantic reproduces
the spatial variability successfully. The maximum anomalies represent ∼1/4 of the maximum vertical
velocities in the southwestern boundary of the Gulf Stream. Nevertheless, these anomalies rapidly
decrease to ∼1/8 of the maximum vertical velocities as the Gulf Stream meanders to the mid-Atlantic.
Away from the turbulent region of the Gulf Stream , anomalies of vertical velocities are negligible,
although the small scale of these scales merits a closer examination that is out of the scope of this
exploratory work.
4.2 Future Work
Future work on this study includes doing a hyper parameter search for best network architecture.
This work lays solid foundations to extend the scope of our predictions beyond one week in the
future. Specifically, this work sets the stage for extending predictions to time scales of two weeks,
which will be of paramount importance to predict the short term effect of tropical depressions and
hurricanes Xingjian et al. [2015] on the vertical mixing of the water column. As we predict further
into the future, from weekly to monthly and from monthly to seasonal time scales, we will analyze
the drop-off of our model’s performance.
In terms of the spatial domain of out data, we plan to extend our study beyond the surface North
Atlantic to include the southern Atlantic and additionally deeper layers of the ocean. Finally, we plan
to use clustering algorithms to identify vertical mixing events, localized high velocities that persist
over time, in our data.
4Figure 4: Left: More detailed look at ground truth versus prediction as shown in (Figure 2). Right:
At every grid point ground truth is subtracted from the prediction, producing anomalies. Highest
anomalies correspond to most extreme vertical velocities.
Broader Impact
Our work aims to contribute to the oceanographic community by creating a dataset of vertical ocean
velocity that covers the North Atlantic region at large and contributing to better understand vertical
mixing events. By validating the application of deep learning to observational ocean data inference,
this study offers a new scientific paradigm in oceanography and a set of tools for the observational
oceanographic community. That is, this work is a proof of concept on how to merge data-driven
methods that use observational oceanographic data with physical knowledge of the physics of the
ocean. Many of the broader impact questions are not particularly applicable to our work, since our
work does not rely on human-related data nor does its application have direct human consequence.
Acknowledgments and Disclosure of Funding
This work is supported by the Helen Gurley Brown foundation. Special thanks to Dr. Pedro Velez
Belchi and Dr. Arthur Guillaumin for their help.
References
T. Bolton and L. Zanna. Applications of deep learning ot coean data inference and subgrid paramatrization.
Journal of Advances in Modeling Earth Systems, 11(1):376–399, 2019.
Dudley B Chelton, Michael G Schlax, and Roger M Samelson. Global observations of nonlinear mesoscale
eddies. Progress in oceanography, 91(2):167–216, 2011.
Peter Gaube, Dennis J. McGillicuddy Jr, and Aurélie J Moulin. Mesoscale eddies modulate mixed layer depth
globally. Geophysical Research Letters, 46(3):1505–1512, 2019.
Yu Huang, Yufei Tang, Hanqi Zhuang, James VanZwieten, and Laurent Cherubin. Physics-informed tensor-train
convlstm for volumetric velocity forecasting. arXiv preprint arXiv:2008.01798, 2020.
Scott C James, Yushan Zhang, and Fearghal O’Donncha. A machine learning framework to forecast wave
conditions. Coastal Engineering, 137:1–10, 2018.
Hong Lin, Yunzi Hua, Leiming Ma, and Lei Chen. Application of convlstm network in numerical temperature
prediction interpretation. In Proceedings of the 2019 11th International Conference on Machine Learning
and Computing, pages 109–113, 2019.
Dennis J McGillicuddy Jr. Mechanisms of physical-biological-biogeochemical interaction at the oceanic
mesoscale. 2016.
5S Mulet, M-H Rio, A Mignot, Stephanie Guinehut, and Rosemary Morrow. A new estimate of the global 3d
geostrophic ocean circulation based on satellite data and in-situ measurements. Deep Sea Research Part II:
Topical Studies in Oceanography, 77:70–81, 2012.
Richard D Ray. Spectral analysis of highly aliased sea-level signals. Journal of Geophysical Research: Oceans,
103(C11):24991–25003, 1998.
Philip L Richardson. Eddy kinetic energy in the north atlantic from surface drifters. Journal of Geophysical
Research: Oceans, 88(C7):4355–4367, 1983.
Michael G Schlax and Dudley B Chelton. Aliased tidal errors in topex/poseidon sea surface height data. Journal
of Geophysical Research: Oceans, 99(C12):24761–24775, 1994.
Richard E Thomson and William J Emery. Data analysis methods in physical oceanography. Newnes, 2014.
Pedro Vélez-Belchí and Joaquín Tintoré. Vertical velocities at an ocean front. Scientia Marina, 65(S1):291–300,
2001.
SHI Xingjian, Zhourong Chen, Hao Wang, Dit-Yan Yeung, Wai-Kin Wong, and Wang-chun Woo. Convolutional
lstm network: A machine learning approach for precipitation nowcasting. In Advances in neural information
processing systems, pages 802–810, 2015.
Zhuoning Yuan, Xun Zhou, and Tianbao Yang. Hetero-convlstm: A deep learning approach to traffic accident
prediction on heterogeneous spatio-temporal data. In Proceedings of the 24th ACM SIGKDD International
Conference on Knowledge Discovery & Data Mining, pages 984–992, 2018.
Meng Zhou, Jeffrey D Paduan, and Pearn P Niiler. Surface currents in the canary basin from drifter observations.
Journal of Geophysical Research: Oceans, 105(C9):21893–21911, 2000.
6You can also read