Comparing customer service: mobile, home broadband and landline - Published 7 May 2021
←
→
Page content transcription
If your browser does not render page correctly, please read the page content below

Comparing customer service:
         mobile, home broadband
                    and landline

                                                                         Published 7 May 2021
Welsh version available: Cymharu gwasanaeth i gwsmeriaid: symudol, band eang a llinell dir cartref
Overview

This is Ofcom’s fifth annual report on how service levels compare across the telecoms industry. We
publish it to help people make informed decisions about which provider is best for them, as part of
our work to ensure fairness for customers.

By shining a light on the performance of the UK’s main mobile, broadband and home phone
providers, this report allows people to look beyond the price and see what level of service they can
expect from different providers. It also acts as an incentive for providers to improve their customer
service.

This report covers customers’ experiences in 2020 and therefore includes the period covered by the
coronavirus (Covid-19) pandemic. It has been a challenging year, and some customers experienced
lower levels of service quality at times. This can be explained by the unique situation, but in cases
where service levels worsened, we expect them to return to at least 2019 levels, or better, now that
processes are established for operating in the pandemic, and as restrictions ease.

What we have found
The Covid-19 pandemic has made telecoms services more important than ever to many people.
Broadband and mobile were considered to be the most important communications services, and
about half of broadband customers and four in ten mobile customers said these services had
become more important to their household because of the pandemic.

Mobile customers were the most likely to be satisfied with the service from their provider, with
nine in ten saying they were satisfied (90%). Eighty per cent of broadband customers and 77% of
landline customers said they were satisfied with their service. Three’s customers had lower than
average satisfaction for mobile, and Virgin Media customers had lower than average satisfaction for
landline.

Seventeen per cent of broadband and 12% of mobile customers said they were more willing to
complain about their service because of the pandemic, while 6% of customers in each market said
they were less willing to complain. Customer satisfaction with complaint handling has remained just
above 50%, leaving room for improvement from providers.

The pandemic significantly reduced many providers’ call centre capacity, and customers had to
wait longer on average to speak to an advisor than they did in 2019. Mobile customers who called
their provider about their service spent 2 minutes 7 seconds on average in a queue (up by 49
seconds), while broadband and landline customers spent 4 minutes 9 seconds on average in a queue
(up by 1 minute 59 seconds).

                                                      2
Faults resulting in total loss of service were resolved within two days on average in 2020, with nine
in ten (89%) total loss of service faults solved within a week. Eighty-five per cent of landline and
broadband orders were delivered by the agreed date, although there were notable variations
between providers; BT completed the lowest percentage of orders on the date agreed (75%). Among
the providers included in both this year’s and last year’s report, the number of orders completed
was 12% lower in 2020 than in 2019.

Automatic compensation payments were temporarily halted due to the pandemic. In March 2020,
Ofcom explained its view that, given the restrictions on travel and access to properties, it would
temporarily be legitimate for providers not to pay automatic compensation. By July 2020, all
providers signed up to the scheme had restarted paying automatic compensation for some service
issues, although there are still circumstances in which it remains legitimate for providers not to pay
automatic compensation because of Covid-19, for example if an engineer cannot visit a customer’s
home because the customer is self-isolating. Providers paid over £27.5m in automatic compensation
in 2020.

The information in this report has been collected through our own research, directly from the larger
telecoms providers, and from third parties. The high-level findings in this report are supported by an
interactive data tool, which provides detailed information on how providers compare across all the
datasets we have collected.

                                                  3
Contents

Overview ............................................................................................................. 2
Impact of Covid-19 on customer service ............................................................ 5
Mobile customer service..................................................................................... 7
  Customer satisfaction ......................................................................................................................... 8
  Complaints and complaints handling .................................................................................................. 9
  Customer contacts ............................................................................................................................ 11
  Call waiting time and abandonment rate ......................................................................................... 11

Broadband customer service ............................................................................ 13
  Customer satisfaction ....................................................................................................................... 14
  Complaints and complaints handling ................................................................................................ 14
  Customer contacts ............................................................................................................................ 16
  Call waiting time and abandonment rate ......................................................................................... 16

Landline customer service ................................................................................ 18
  Customer satisfaction ....................................................................................................................... 19
  Complaints and complaints handling ................................................................................................ 19

Broadband and landline: provisioning and repair ............................................. 21
  Summary of provisioning and fault repair ........................................................................................ 21
  Getting a new service........................................................................................................................ 22
  Fault repair ........................................................................................................................................ 22
  Missed appointments ....................................................................................................................... 25
  Automatic compensation scheme .................................................................................................... 25

Comparison with other sectors ......................................................................... 27
Annex 1: Consumer research source details ..................................................... 28

                                                                                4
Impact of Covid-19
                                   on customer service

The Covid-19 pandemic and lockdown measures presented challenges for telecoms providers, while
also making telecoms services more important than ever for some customers. The data included in
this report on repair and provision times, missed appointments, call waiting times, and
compensation spans the whole of 2020, while our market research was conducted in November and
December 2020. 1 Our data and research relate to residential customers only, and do not include
businesses.

Our findings show that the Covid-19 pandemic had a particularly significant impact on providers’ call
centres and call waiting times. The pandemic and associated restrictions meant that providers faced
reduced call centre capacity, particularly in the early months of the pandemic, and this resulted in
higher call waiting times for many customers. Many providers had to make system changes or send
equipment to staff to allow them to work remotely, while providers with offshore call centres faced
added logistical challenges due to the diverse nature of local restrictions in other countries. Some
providers encouraged customers to use alternative contact channels, such as webchat, in order to
try to reduce call volumes. While we recognise this has been a challenging year for providers, the
industry has now had a significant amount of time to put in place adequate measures to mitigate
many of the issues they have faced since the pandemic began. We therefore expect performance to
return to 2019 levels, or better, as UK-wide restrictions continue to ease during 2021.

For our market research findings, we are unable to make year-on-year comparisons using our
Customer Satisfaction and Reasons to Complain market research trackers, as our research
methodology changed: these surveys were undertaken online in 2020 due to Covid-19 lockdown
measures (instead of face to face, as previously). The online methodology of the Complaints
Handling tracker was unchanged and therefore we can make year-on-year comparisons based on
data drawn from this research. However, the results in 2020 may still have been affected by
respondents’ changing attitudes towards, expectations of, and propensities to complain about
telecoms services, due to their increased reliance on them during the pandemic.

1
  Our Complaint Handling tracker asked customers about their experience over the past six months; the
Reasons to Complain tracker asked about experience over the past 12 months; the Customer Satisfaction
tracker focuses on customers’ current satisfaction with their provider.

                                                        5
To help us understand whether there have been any direct effects of the pandemic on customers'
responses in the research, we asked respondents three additional questions:

       1) how important each communications service was to them at that point in time;
       2) if a service was more or less important to them because of the pandemic; and
       3) whether they were more or less willing to make a complaint because of the pandemic.
Our research shows that broadband and mobile were considered the most important
communication services to people, compared to landline. 2 We also found that about half of
broadband customers and four in ten mobile customers said these services were more important to
their household because of the pandemic.

Responses were mixed in terms of customers’ willingness to complain during the pandemic.
Seventeen per cent of broadband customers and 12% of mobile customers said they were more
willing to make a complaint as a result of the pandemic, perhaps as a result of the increased
importance of these services. However, a minority (6%) of these customers said they were less
willing to make a complaint as a result of the pandemic.

2
    See also Affordability of communications services initial findings.

                                                           6
Mobile
                                                                  customer service
                          Average
                          mobile              BT       EE
                                                                Gaff
                                                                       Giff
                                                                               Mobile
                                                                                        ID
                                                                                                                Sky    Tesco Mobile
                                                                                                                                        Three    Virgin Mobile    Vodafone

                                                                                             O2

Satisfaction with
                            90%         N/A        92%        93%             N/A                 91%     N/A         91%             86%       88%              90%
service overall

Satisfaction with value
                            83%         N/A        80%        95%             N/A                 79%     N/A         90%             88%       84%*             77%
for money

Customers with
                            10%          7%         9%        5%               5%                  7%      5%          7%             13%       13%              16%
a reason to complain

Overall satisfaction
with complaint              57%         N/A        56%        57%             N/A                 62%     N/A         55%             56%       56%              55%
handling

Complaints to Ofcom
per 100,000                 13↓         16↓         6↓        N/A             15↑                  8↓      6↓             3           23↑       25↓              20↓
subscribers

Average call waiting
                           2:07↑       0:46↑       2:09↑      N/A             0:56↓               2:17↑   2:33↑       3:39↑           1:03↓     6:44↑            1:56↑
times (mm:ss)

               XX Statistically significantly better than the sector average at the 95% confidence level for market research
             results / top performer for other data.
               XX Statistically significantly worse than the sector average at the 95% confidence level for market research
             results / bottom performers for other data.
             ↑ indicates where a provider’s score has increased since 2019.
             ↓ indicates where a provider’s score has decreased since 2019.
             * Satisfaction with value for money: Virgin Mobile had a low base size (85) and associated wide margin of
             error, so results should be treated as indicative only.

             Note: Where a provider has a lower base size (noting that a provider’s base size reflects its share of the
             relevant market), it is possible that despite a result the same as, or close to, that of the sector average and/or
             other providers, it is not statistically the same. This is due to a wider margin of error. For example, this applies
             to BT and iD Mobile’s reason to complain scores. These providers’ scores have a wider margin of error when
             compared to O2, Tesco Mobile and Sky. Hence the results for BT and iD Mobile, while the same as those
             reported by these other providers, are not marked as significantly different to the average.
             Results are marked ‘N/A’ where market share is below 4%, or where the sample size is too low for a finding to
             be included i.e. less than 50. See Annex 1 and 2 for further details on provider base sizes and significance
             testing. See Annex 3 for complaints to Ofcom and average call waiting times methodologies.

                                                                                 7
Customer satisfaction
      •   Nine in ten mobile customers were satisfied with their service overall. Satisfaction was
          lower among Three’s customers compared to the market average (86% vs. 90%), while
          satisfaction levels were in line with the average for all other providers.
      •   Three per cent of mobile customers said that they were dissatisfied with their service
          overall. As in previous years, poor reception or coverage was a key driver of dissatisfaction.
          Just over half of dissatisfied mobile customers (51%) said that the main reason for their
          dissatisfaction was poor reception or coverage in an unspecified location, while three-
          quarters cited poor reception in any location (unspecified, at home, or ‘in my area’) as a
          reason for their dissatisfaction.
      •   Giffgaff customers were more likely than average to be satisfied with their mobile
          reception or signal strength, compared to the average (90% vs. 82%), 3 while Three’s
          customers were less likely to be satisfied (69% vs. 82%).
      •   Views on value for money among mobile customers were mixed: giffgaff, Tesco Mobile and
          Three customers were more likely than average to be satisfied with value for money, and O2
          and Vodafone customers were less likely to be so.
      •   Giffgaff and Tesco Mobile customers were more likely than average to recommend their
          provider to a friend, while Three and Virgin Mobile customers were less likely than average
          to do so. The scores of all the other providers were in line with the sector average. 4

Figure 1: Recommend to a friend: mobile providers

                               2021

     More likely to
      recommend                  , Tesco Mobile

    Mobile average

                                EE, O2, Vodafone

      Less likely to
       recommend
                               Three, Virgin Mobile

Source: Ofcom Customer Satisfaction Tracker, November / December 2020.

3
 Giffgaff does not have its own network infrastructure and uses O2’s network.
4The average ‘recommend to a friend’ score in the mobile market was 21. EE (17), giffgaff (50), O2 (23), Tesco
Mobile (42), Three (6), Virgin Mobile (6) and Vodafone (16) all have scores that are between 0 and 50 and
therefore considered ‘good’ based on global NPSTM standards. See interactive report for further details.

                                                      8
Complaints and complaints handling
        •   One in ten mobile customers said they had reason to complain about their mobile service
            or supplier in 2020. Giffgaff, O2, Tesco Mobile and Sky customers were significantly less
            likely than the market average to have reason to complain. Vodafone, Three and Virgin
            Mobile customers were significantly more likely to have a reason to complain, compared to
            the market average. 5
        •   Where mobile customers had reason to complain, the most common reason was that their
            service was not performing as it should (50%); for example, because of poor connection
            quality or loss of service. This was followed by a billing, pricing or payment issue (39%), then
            dissatisfaction with customer service (21%). These were the same reasons as in 2019.
        •   Nearly six in ten (57%) mobile customers who made a complaint to their provider in 2020
            were satisfied with the way their complaint was handled. This is in line with the 2019
            findings.
        •   O2 customers were more likely than the market average to be satisfied with the way in
            which their complaint was handled. Satisfaction levels were in line with the average for all
            other providers.
        •   As in 2019, nearly half of mobile complaints were completely resolved on first contact. EE
            was more likely than the mobile average to have resolved a complaint completely on first
            contact, while Virgin Media was less likely than the market average to have done so.

  Figure 2: Handling of mobile complaints

                         Average
                         mobile
                                                          Giff
                                                   Gaff                                                                Virgin
                                                                                Tesco Mobile
                                          EE                                                   Three Mobile    Media            Vodafone
                                                                           O2

Overall satisfaction
with complaints
                          57%         56%        57%                 62%                 55%   56%            56%               55%
handling

Complaints
completely
                          46%         50%        46%                 47%                 42%   42%            36%               44%
resolved on first
contact

    XX Statistically significantly better than the sector average at the 95% confidence level for market research
  results / top performer for other data.
    XX Statistically significantly worse than the sector average at the 95% confidence level for market research
  results / bottom performers for other data.
  Source: Ofcom Complaints Handling Tracker 2020 (see Note F in Annex 1 for more information).

  5
      Ofcom Reason to Complain Tracker 2020.

                                                                 9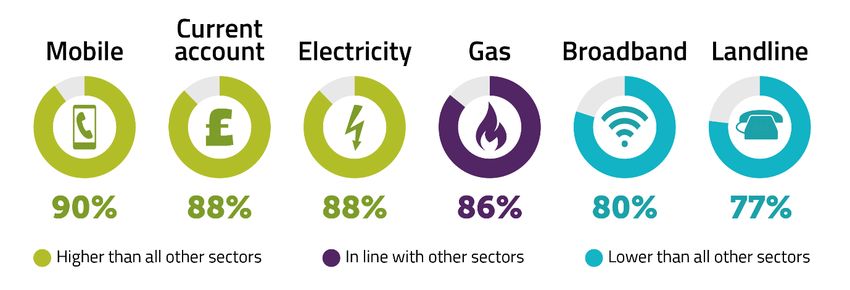
Complaints to Ofcom
For the fourth consecutive year, Tesco Mobile generated the fewest complaints to Ofcom per
100,000 subscribers during 2020. Virgin Mobile generated the most complaints per 100,000
subscribers. The average number of complaints received a year per 100,000 subscribers fell slightly,
from 14 in 2019 to 13.

Figure 3: Pay-monthly mobile complaints per 100,000 subscribers: 2020

Source: Ofcom, 2020. All figures are rounded to the nearest whole number; the industry average relates only to
the providers included in the analysis. The actual measurable difference between EE and Sky Mobile’s pay-
monthly complaints per 100,000 subscribers is less than one, so their results should be considered comparable.

                                                      10
Customer contacts
As in 2019, telephone remained the most popular way for mobile customers to contact their
provider, accounting for 73% of contacts during the year. This is down since 2019, when 82% of
contacts were via phone calls. Webchat was the next most popular at 22%, up from 15% in 2019. As
explained above, the pandemic significantly affected many providers’ call centre capacity. Some
providers reallocated staff and encouraged customers to use alternative contact channels, such as
webchat, to try to reduce call volumes and manage call centre capacity.
Figure 4: Customer contacts with mobile providers, by channel
Source: Ofcom / provider data, 2020.
Call waiting time and abandonment rate
• The average call waiting time for mobile customers increased significantly, from 1 minute
18 seconds in 2019 to 2 minutes 7 seconds in 2020. Providers responded in different ways to
the impact of the pandemic on their call centre capacity. As mentioned above, some
promoted the use of other methods of contact, such as webchat, while others advised
customers against contacting them via phone. As such, comparisons between average call
waiting times should be treated with caution, as they only reflect the experience of
customers who were able to contact their provider by phone.
• Most mobile providers’ average call waiting times increased in 2020. Three and iD Mobile
were the only mobile providers to reduce their average call waiting time. However, these
providers also took steps to encourage customers to use other methods of contact, and they
reported the largest reduction in the volume of customer contacts by phone during the early
months of the pandemic. 6
• BT Mobile remained the provider with the shortest average call waiting time, at 46
seconds. This was 12 seconds longer than its average call waiting time in 2019.
• Virgin Mobile was the mobile provider with the longest average call waiting time. Virgin
Mobile’s average call waiting time increased from 4 minutes 43 seconds in 2019 to 6
minutes 44 seconds in 2020.
6
Three and iD Mobile told us that the pandemic and lockdown restrictions impacted their call centre capacity.
In response, both these providers told us that they increased their webchat capacity.
11• In 2020, 7.6% of calls were abandoned before the customer spoke to a customer service
agent. 7 Of the providers which submitted comparable data, BT had the lowest abandonment
rate for the second year in a row. Among those whose data were not comparable, O2, Tesco
Mobile, and Virgin Mobile’s abandonment rate had worsened since the previous year. 8
Figure 5: Average call waiting times, by provider: 2020
Source: Ofcom / provider data, 2020. 9
7
The industry average call abandonment rate for 2020 is not directly comparable to 2019 as it does not
include data for Three.
8
Information about Three’s performance compared to the previous year has not been included, as Three was
unable to provide data to compare to its 2019 performance.
9
O2, Tesco Mobile, and Virgin Mobile were unable to provide comparable data about the percentage of calls
ended, so only information about their performance compared to the previous year has been included.
Information about Three’s performance compared to the previous year has not been included, as Three was
unable to provide data to compare to its 2019 performance. Giffgaff does not have a call centre and therefore
is not included. Lycamobile was excluded as it was unable to provide comparable data on either metric. See
Annex 3 for methodology.
12Broadband
customer service
Average
broadband 10
Satisfaction with
80% 80% 82% N/A 81% N/A 80% 77% 80% N/A
service overall
Satisfaction with speed of
79% 80% 78% N/A 75% N/A 80% 71% 82% N/A
service
Customers with
26% 23% 30% N/A 24% N/A 24% 24% 29% 32%
a reason to complain
Overall satisfaction with
52% 55% 47% N/A 47% N/A 59% 47% 48% N/A
complaint handling
Ofcom complaints per
50↓ 50↓ 20↓ N/A 69↓ 61↑ 23↑ 81↓ 69↑ 103↓
100,000 subscribers
Average call
4:09↑ 3:28↑ 1:15↑ 3:19↑ 4:52↑ 1:59↑ 3:21↑ 1:46↑ 7:40↑ 3:25↑
waiting time (mm:ss)
XX Statistically significantly better than the sector average at the 95% confidence level for market research
results / top performers for other data.
XX Statistically significantly worse than the sector average at the 95% confidence level for market research
results / bottom performer for other data.
↑ indicates where a provider’s score has increased since 2019.
↓ indicates where a provider’s score has decreased since 2019.
Note: Where a provider has a lower base size (noting that a provider’s base size reflects its share of the
relevant market), it is possible that despite a result the same as, or close to that of the sector average and/or
other providers, it is not statistically the same. This is due to a wider margin of error. For example, in the
broadband sector this applies to EE and Plusnet’s satisfaction with complaint handling. These providers’ scores
have a wider margin of error when compared to TalkTalk. Hence the results for EE and Plusnet, while the same
as TalkTalk, are not marked as significantly different to the average. Results are marked ‘N/A’ where market
share is below 4%, or where the sample size is too low for a finding to be included i.e. less than 50. See Annex 1
and 2 for further details on provider base sizes and significance testing. Call waiting times are calculated for
landline and broadband service together. See Annex 3 for complaints to Ofcom and average call waiting times
methodologies.
10
In March 2021 Post Office completed the sale of its broadband and landline services to Shell Energy and
exited the telecoms market.
13Customer satisfaction
• Eight in ten broadband customers reported that they were satisfied with their service
overall. Overall satisfaction levels were broadly similar across all providers.
• TalkTalk customers were less satisfied with the speed of their service compared to the
market average. Satisfaction with speed of broadband service was in line with the average
across all other providers.
• Nearly four in five broadband customers were satisfied with the reliability of their service
and there were no differences by provider on this measure.
• EE customers were more likely than average to recommend their broadband provider to a
friend, while the scores of all the other broadband providers were in line with the sector
average. 11
Figure 6: Recommend to a friend: broadband providers
2021
More likely to
recommend EE
Broadband average
BT, Plusnet, Sky, TalkTalk, Virgin Media
Less likely to
recommend N/A
Source: Ofcom Customer Satisfaction Tracker November / December 2020.
Complaints and complaints handling
• A quarter (26%) of broadband customers had a reason to complain about their service in
2020. BT broadband customers were significantly less likely than the market average to have
a reason to complain, while Virgin Media and Vodafone customers where significantly more
likely than average to have a reason to complain. 12
• As in 2019, the most common reason for customers to complain about their fixed
broadband was a service issue (76%), such as slow broadband speeds or an intermittent or
total loss of service. This was followed by a billing, pricing or payment issue (18%) and
dissatisfaction with customer service (12%).
• About half (52%) of broadband customers who made a complaint to their provider in 2020
were satisfied with the way their complaint was handled. This is in line with our 2019
findings. Sky performed better than the sector average, while TalkTalk and Virgin Media
were below the average. EE had a significant decline in satisfaction compared to 2019 (47%
vs. 66%).
11
The average ‘recommend to a friend’ score in the broadband market was 3. BT (4), EE (11) Plusnet (1), Sky
(5), TalkTalk (1) and Virgin Media (1) have ‘recommend to a friend’ scores that are between 0 and 50 and
therefore considered ‘good’ based on global NPS standards.
12
Ofcom Reason to Complain Tracker, 2020.
14• Nearly two in five (37%) broadband complaints were completely resolved on first contact,
unchanged since 2019. Sky was more likely than the broadband sector average to have
resolved a complaint completely on first contact, while Plusnet and TalkTalk were less likely
than the market average to have done so.
Figure 7: Handling of broadband complaints
Average
broadband
Overall satisfaction with
52% 55% 47% 47% 59% 47% 48%
complaints handling
Complaints completely
resolved on first contact 37% 40% 34% 30% 42% 31% 34%
XX Statistically significantly better than the sector average at the 95% confidence level for market research
results / top performer for other data.
XX Statistically significantly worse than the sector average at the 95% confidence level for market research
results / bottom performers for other data.
Source: Ofcom Complaints Handling Tracker 2020 (see Note F in Annex 1 for more information).
Complaints to Ofcom
EE generated the fewest broadband complaints to Ofcom per 100,000 subscribers, while Vodafone
generated the most for the second year in a row. Among the major broadband providers, the
average number of broadband complaints per 100,000 subscribers fell from 52 in 2019 to 50 in 2020.
Figure 8: Broadband complaints per 100,000 subscribers: 2020
Source: Ofcom, 2020. All figures are rounded to the nearest whole number; the industry average relates only to
the providers included in the analysis. The actual measurable difference between Plusnet and Virgin Media, and
the industry average and BT broadband complaints per 100,000 subscribers is less than one, so their results
should be considered comparable.
15Customer contacts
As with mobile customers, telephone was again the most popular method of contact for landline
and broadband customers in 2020, accounting for an average of 83% of customer contacts,
compared to 87% in 2019. This was followed by webchat at 11% (up from 8% in 2019). As explained
above, the pandemic significantly reduced many providers’ call centre capacity, and some providers
took steps to encourage customers to use alternative contact channels, such as webchat, in order to
try and reduce call volumes.
Figure 9: Customer contact with broadband and landline providers, by channel
Source: Ofcom / provider data, 2020.
Call waiting time and abandonment rate
• All broadband and landline providers’ average call waiting times increased in 2020. The
industry average call waiting time increased from 2 minutes 10 seconds in 2019 to 4 minutes
9 seconds. As with mobile, broadband and landline providers responded in different ways to
the impact of the pandemic on their call centre capacity, and some providers discouraged
customers from contacting them by phone. 13 As such, comparisons between average call
waiting times should be treated with caution, as they only reflect the experience of
customers who were able to contact their provider by phone.
• Virgin Media customers endured the longest call waiting times. Virgin Media’s average call
waiting times increased from 1 minute 35 seconds in 2019 to 7 minutes 40 seconds in 2020.
EE had the shortest average call waiting time (1 minute 15 seconds).
• Almost double the proportion of calls to landline and broadband providers were ended
while the customer was waiting in a queue. In 2020 10.7% of calls were abandoned before
the customer spoke to a customer service agent, up from 5.4% in 2019. Of the providers
which submitted comparable data, EE had the lowest rate of call abandonment for the
second year in a row. Of those which did not submit comparable data, TalkTalk and Virgin
Media’s abandonment rate had worsened since the previous year.
13
TalkTalk reported a significant fall in its volume of customer contacts by telephone as it had to temporarily
reduce capacity in its overseas call centres in April/May 2020 while improving customer access to webchat and
other online self-service tools. Although TalkTalk sought to restore call centre capacity, it restricted calls to the
call centres, other than for vulnerable customers, throughout 2020.
16Figure 10: Average call waiting times, by broadband and landline provider
Source: Ofcom / provider data, 2020. Some providers were not able to provide comparable data. 14
14
TalkTalk and Virgin Media were unable to provide comparable data about the percentage of calls that
ended, so only information about their performance compared to the previous year has been included. See
Annex 3 for methodology.
17Landline
customer service
Average
landline B E
Satisfaction with
77% 78% 81% N/A 78% N/A 79% 82% 69% N/A
service overall
Customers with
7% 9% 8% N/A 5% N/A 6% 7% 7% 9%
a reason to complain
Overall satisfaction with
53% 56% 48% N/A 48%* N/A 54% 50% 50% N/A
complaint handling
Ofcom complaints per
35↓ 29↓ 12↓ N/A 48↓ 41↑ 16↓ 59↓ 45↓ 55↓
100,000 subscribers
Average call
4:09↑ 3:28↑ 1:15↑ 3:19↑ 4:52↑ 1:59↑ 3:21↑ 1:46↑ 7:40↑ 3:25↑
waiting time (mm:ss) 15
XX Statistically significantly better than the sector average at the 95% confidence level for market research
results / top performers for other data.
XX Statistically significantly worse than the sector average at the 95% confidence level for market research
results / bottom performers for other data.
↑ indicates where a provider’s score has increased since 2019.
↓ indicates where a provider’s score has decreased since 2019.
*Satisfaction with complaints handling: Plusnet had a low base size (89).
Note: Where a provider has a lower base size (noting that a provider’s base size reflects its share of the
relevant market), it is possible that despite a result the same as, or close to, that of the sector average and/or
other providers, it is not statistically the same. This is due to a wider margin of error. For example, in the
landline sector this applies to Vodafone’s reason to complain score, as this provider has a wider margin of error
when compared to BT. Hence the results for Vodafone, while the same as BT, are not marked as significantly
different to the average. Results are marked “N/A” where market share is below 4%, or where the sample size
is too low for a finding to be included i.e. less than 50. See Annex 1 and 2 for further details on provider base
sizes and significance testing. See Annex 3 for complaints to Ofcom and average call waiting times
methodologies.
15
Call waiting times are calculated for landline and broadband service together. Please see previous section for
further details on landline providers’ average call waiting time and call abandonment rates.
18Customer satisfaction
• Overall satisfaction with landline was lower among Virgin Media’s customers, compared to
the average (69% vs. 77%).
• Four in five landline customers (82%) were satisfied with the reliability of their service, and
levels of satisfaction were in line with this across all providers in this sector.
• EE and Sky customers were more likely than average to recommend their landline provider
to a friend, while Virgin Media’s customers were less likely than average to do so. 16
Figure 11: Recommend to a friend: landline providers
2021
More likely to
recommend
Landline average
Less likely to
recommend
Source: Ofcom Customer Satisfaction Tracker November / December 2020.
Complaints and complaints handling
Figure 12: Handling of landline complaints
Average
TalkTalk
Virgin Media
Landline BT EE Plusnet
Sky
Overall satisfaction with
complaints handling 53% 56% 48% 48%* 54% 50% 50%
Complaints completely
resolved on first contact 43% 46% 40% 39%* 46% 36% 38%
XX Statistically significantly better than the sector average at the 95% confidence level for market research
results / top performer for other data.
XX Statistically significantly worse than the sector average at the 95% confidence level for market research
results / bottom performers for other data.
Source: Ofcom Complaints Handling Tracker 2020 (see Note F in Annex 1 for more information).
* low base size (89) treat as indicative only.
16
The average ‘recommend to a friend’ score in the landline market was 3. BT (0), EE (11) Plusnet (6), Sky (10)
and TalkTalk (8) have ‘recommend to a friend’ scores that are between 0 and 50 and therefore considered
‘good’ based on global NPS standards, while Virgin Media’s ‘recommend to a friend’ score is below 0 (-11).
19• Seven per cent of landline customers had a reason to complain in 2020. BT customers were
significantly more likely than the market average to have a reason to complain about their
service or provider (9%). 17
• The most common reason for landline customers to complain about their service or
provider related to a service issue (51%), such as poor call line quality or loss of service. This
was followed by a billing, pricing or payment issue (36%), then dissatisfaction with customer
service (20%).
• There was no change since 2019 in overall satisfaction with landline complaint handling, or
the percentage of complaints resolved on first contact. There were, however, declines in
satisfaction with complaints handling for EE (48% vs. 59%) and Sky (54% vs. 60%) compared
to 2019.
• TalkTalk and Virgin Media were less likely than average to have resolved a complaint on
first contact (36% and 38% respectively, compared to the landline average of 43%).
Complaints to Ofcom
As with broadband, EE generated the fewest landline complaints to Ofcom per 100,000
subscribers. TalkTalk generated the highest volume of complaints per 100,000 subscribers, while the
average number of landline complaints per year per 100,000 subscribers fell from 38 in 2019 to 35 in
2020.
Source: Ofcom, 2020. All figures are rounded to the nearest whole number; the industry average relates only to
the providers included in the analysis.
17
Ofcom Reason to Complain Tracker 2020.
20Broadband and landline:
provisioning and repair
Summary of provisioning and fault repair
Average
Average days to
deliver (all 13 13 14 9 14 16 14 14 4 15
provisions)
Average days to
switch to a new 14 14 15 15 15 16 14 15 10 15
provider
Average days to
deliver a change
7 10 7 8 9 16 10 13 0 N/A
of service (same
provider)
Average days to
deliver a home
14 13 14 11 16 17 N/A 14 10 16
move (same
provider)
Proportion of
orders delivered 85% 75% 94% 100% 77% 96% 95% 91% 86% 83%
by date agreed
Faults per 1000
customers per 46 54 63 31 12 23 39 54 40 73
month
Average time to
repair a total loss 2 3 3 0 3 3 2 2 1 3
of service (days)
Proportion of re-
15% 29% 17% 12% 17% 11% 6% 6% 3% 7%
contacts
Proportion of
appointments 2.7% N/A 2.2% 0.9% 5.5% 5.5% 2.8% 2.2% 3.0% N/A
missed
Source: Ofcom / provider data, 2020. See Annex 3 for methodology. Results are ‘N/A’ where providers were
unable to provide comparable data.
21Getting a new service
• Across all provision types, landline and broadband orders took 13 days on average to
complete. As in 2019, orders for a change of service from an existing supplier (such as an
upgrade to a higher-speed service) were completed more quickly, on average, than home
moves or a change of service to a new provider. Changing service from the same provider
took seven days, while home moves and switching to a new provider both took an average
of 14 days. 18
• Virgin Media was the quickest across all three provision types, and on average managed to
provide a change of service on the same day as the order. 19
• Eighty-five per cent of landline and broadband orders were delivered by the agreed date,
compared to 87% in 2019. This was lower in rural areas, where 78% of all landline and
broadband orders were delivered by the date agreed. BT completed the smallest proportion
of orders on the date agreed (75%), while KCOM was able to complete 100% of orders on
the date agreed.
• Among the providers included in this year’s and last year’s report, 12% fewer provisioning
orders were completed in 2020 than in 2019. 20
Fault repair
Number of faults
• Across major providers there were 46 faults a month, of any kind, per 1000 customers.
This includes any landline or broadband fault that took place in 2020, as opposed to only
those that resulted in a total loss of service.
• Vodafone had the highest number of faults per 1000 customers, at 73 faults per month,
while Plusnet had the lowest, with 12 faults per month.
• Not all faults are the result of a failure of the service or network provider. Sometimes the
cause of the fault is in the customer’s own property, such as problems with in-home wiring
or misconnections between devices. In 2020, 56% of faults resulting in total loss of service
were within the customers domain, same as in 2019.
18
2020 is the first year in which Ofcom has received a full year of data from all providers. Although the
methodology is consistent and allows year-on-year comparisons to be made, these should be treated with
caution, given the exceptional circumstances of the Covid-19 pandemic.
19
Switches between providers using the Openreach or KCOM copper networks (including fibre to the cabinet)
take at least ten working days. This gives time for customers to ‘stop the switch’ if they have not agreed to it or
have changed their mind (e.g. if they are told they need to pay an early termination charge). Ofcom is currently
consulting on proposals to introduce a new switching process for landline and broadband services, regardless
of provider or the technology or network used. This could potentially reduce switching times to one working
day from December 2022. See Quick, easy and reliable switching for more information.
20
Ofcom analysis of 2019 and 2020 provisioning data from BT, EE, KCOM, Plusnet, Post Office, Sky, TalkTalk,
and Virgin Media.
22Figure 13: Faults per 1000 customers per month
Faults per 1000
customers per 45 63 34 N/A 23 48 47 49 N/A
month - 2019
Faults per 1000
customers per 54 63 31 12 23 39 54 40 73
month - 2020
Source: Ofcom / provider data, 2019/2020. Results marked N/A where figures were not included in 2019. See
Annex 3 for methodology.
Fault repair times
• Faults resulting in total loss of service were resolved on average within two days (as in
2019), with nine in ten (89%) total loss of service faults solved within a week.
• When an engineer was required to fix a fault, it typically took two days longer to have the
fault resolved than if an engineer was not required (four days when an engineer was
required, compared to two without an engineer). This was also the case in 2019.
Figure 14: Distribution of repair times with / without an engineer visit
Source: Ofcom / provider data, 2020. See Annex 3 for methodology.
• Virgin Media and KCOM were able to resolve a fault faster, on average, than other
providers. KCOM was the quickest, on average, to restore a customer’s service and was able
to resolve most total loss of service faults on the same day, while Virgin Media had the
highest proportion of total loss of service faults solved within a week, at 98%. 21
21
BT, EE, Plusnet, Post Office, Sky, TalkTalk and Vodafone all provide a service using the Openreach network.
For customers of these providers, how quickly a network fault is fixed depends in part on when the issue is
referred to Openreach and the level of service the provider has paid for from Openreach.
23• Vodafone had the lowest proportion of total loss of service faults solved within a week, at
78%, as well as the highest proportion of faults that took longer than 28 days to resolve
(6%).
Figure 15: Distribution of repair times, by provider
Same day 1 day 2-7 days 8-14 days 15-21 days More than 21 days
1% 1% 0%
1% 2% 2% 2% 2% 0% 1%
5% 2% 2% 2% 2% 2% 2% 8%
3% 8% 8% 8% 7%
9% 4%
10% 20%
32% 10%
7%
43%
53% 56% 54%
47% 39%
19%
71%
69% 21%
16%
12%
13%
18% 24% 47%
23% 25% 23%
13% 21%
15%
10%
4%
Source: Ofcom / provider data, 2020. See Annex 3 for methodology.
• The majority of the faults resulting in a total loss of service were fixed at the first attempt,
although there were notable variations between providers. On average, 15% of customers
had to re-contact their provider within 48 hours regarding their faults.
• BT had the highest proportion of re-contacts, with more than one in four (29%) customers
having to re-contact BT about their fault (up from 18% in 2019). Virgin Media had the lowest
proportion of re-contacts, at only 3% of customers.
24Missed appointments
Overall, 2.7% of repair and provision appointments were missed in 2020. 22 Plusnet and Post Office
had the highest proportion of appointments missed, at 5.5%, while KCOM had the lowest proportion
of appointments missed, at under 1%.
Figure 16: Proportion of appointments missed, by provider: 2020
Average
Proportion of
appointments 1.9% 2.2% 0.9% 5.5% 5.5% 2.8% 2.2% 3.0%
missed
Source: Ofcom analysis of provider data, 2020. See Annex 3 for methodology.
Automatic compensation scheme
The automatic compensation scheme requires that signatories pay compensation to landline and
broadband customers for delayed repairs following a total loss of service, missed repair or provision
appointments, and delays to the start of a new service, without the customer having to ask for it.
Last year we reported how the scheme had generated more compensation for customers who had
experienced problems with their service, and that between July to December 2019, more than
£20.7m was paid in automatic compensation, with almost 600,000 payments made. Since then we
have seen more providers join the scheme: 89% of broadband and 85% of landline customers are
now covered by it. 23
In March 2020, given the challenging circumstances presented by the Covid-19 pandemic, we
published an update on our website to explain our view: that it would be legitimate for providers to
temporarily not pay automatic compensation, as if the civil emergencies exception in the scheme
applied. This resulted in fewer automatic compensation payments being made than in 2019.
Changes at the network level, and in engineer availability, meant that by July all signatories were
able to restart paying automatic compensation for at least some service issues. However, there
continue to be circumstances in which it remains legitimate for providers not to pay automatic
compensation because of Covid-19. For example, problems might require an engineer’s visit to a
customer’s home, which might not be possible if the customer is self-isolating.
Figure 17 shows that over £27.5 million was paid in automatic compensation in 2020. These figures
do not include any compensation that was paid outside the scheme.
22
This includes appointments missed by providers’ own engineers, Openreach engineers, and other third-party
engineers. This figure does not include Vodafone appointments – Vodafone was unable to provide comparable
data on this metric.
23
BT, Sky, TalkTalk, Virgin Media and Zen Internet were signatories to the scheme when it launched in April
2019. Hyperoptic joined the scheme in October 2019, Utility Warehouse joined in February 2020, and EE
joined the scheme in May 2021.
25Figure 17: Amount of automatic compensation paid
Amount of automatic
Service issue
compensation paid 2020
Delayed repair following loss of service £11.0m
Missed appointments £2.8m
Delayed provision of a new service £13.7m
Source: Ofcom analysis of provider data, 2020. See Annex 3 for methodology.
Figure 18 shows that in 2020 there were around 726,000 incidents of either loss of service, delayed
provision or missed appointments for which a customer received automatic compensation.
Figure 18: Number of automatic compensation payments made
Volume of automatic
Service issue
compensation payments 2020
Delayed repair following loss of service 333,000
Missed appointments 113,000
Delayed provision of a new service 280,000
Source: Ofcom analysis of provider data, 2020. All figures are rounded to the nearest 1,000. See Annex 3 for
methodology.
Ofcom’s analysis of the data provided found that the amount of compensation that signatories paid
in these instances is in line with the amounts that signatories are required to pay out under the
scheme. Barring any improvement in service quality, we expect the amount of automatic
compensation paid to return to closer to 2019 levels, now that processes for operating during the
pandemic are established, and as restrictions ease.
26Comparison with other
sectors
Mobile customers’ satisfaction with their overall service was higher than for gas, broadband and
landline providers, and in line with satisfaction with bank current accounts and electricity providers.
Broadband and landline customers’ satisfaction were in line with each other, but lower than all
other sectors.
Figure 3: Overall satisfaction with services from communications providers, compared to current
account and energy providers
Source: Ofcom Customer Satisfaction Tracker November / December 2020 (see Note A in Annex 1 for more
details).
27Annex 1: Consumer research
source details
Note A M3: And how satisfied are you with the
overall value for money of your service from
L1/M2/IN2/PT1/B1/BM3/BM8/BM10: In (MOBILE PHONE SERVICE PROVIDER)? Would
terms of your (SERVICE) how satisfied are you you say you are…
with the overall service provided by
(PROVIDER)? Would you say you are…? Base: All adults aged 16+ who are the decision
maker who express an opinion on their mobile
Base: All adults aged 16+ who are the decision phone service where it is held as a standalone
maker and express an opinion on their service/ not taken with another service from
landline service (1997), their mobile phone the same provider (2134), receiving their
service (2556), their fixed broadband service service from EE (394), giffgaff (174),
(2274), their pay TV service (1300), their O2 (428), Tesco Mobile (231), Three (271),
services taken with the same supplier (2004), Vodafone (322).
their main current account provider (2476),
their gas only provider (197), their electricity NB. Base size for Virgin Mobile for question
only provider (493). ‘Don’t know’ responses M3 (85) is too low to report on.
have been excluded from the base.
M4: And how satisfied are you overall with
Note B the reception or signal strength that you get
on your mobile phone service from (MOBILE
M2: In terms of your mobile phone service, PHONE SERVICE PROVIDER)? Would you say
how satisfied are you with the overall service you are…
provided by (MOBILE PHONE SERVICE
PROVIDER)? Would you say you are… Base: All adults aged 16+ who are the decision
Base: All adults aged 16+ who are the decision maker and express an opinion on their mobile
maker and express an opinion on their mobile phone service (2556), receiving their service
phone service (2556), receiving their service from EE (487), giffgaff (174), O2 (428), Tesco
from EE (487), giffgaff (174), O2 (428), Tesco Mobile (233), Three (272), Virgin Mobile
Mobile (233), Three (272), Virgin Mobile (237), Vodafone (336), on a contract (1982),
(237), Vodafone (336), on a contract (1982), on prepay (555). Providers used by fewer than
on prepay (555). Providers used by fewer than 100 respondents are not shown individually
100 respondents are not shown individually but are included in the total. ‘Don’t
but are included in the total. ‘Don’t know’ responses have been excluded from
know’ responses have been excluded from the base.
the base.
28Note C (207), O2 (604), Tesco Mobile (304), Three
(454), Virgin Mobile (200), Vodafone (535).
QN2: Based on your overall experience of
(MOBILE PHONE SERVICE PROVIDER) as your Note F
mobile phone service provider, how likely
would you be to recommend them to a friend Q12: You said that your complaint was
or family member as a mobile phone service completely resolved, was it completely
provider? Please give a rating on a scale of 0 resolved on your first contact with
to 10, where 0 is 'Extremely unlikely' and 10 is [Provider]?
'Extremely likely'?
Base for 2020: All who complained about the
Base: All adults aged 16+ who are the decision mobile service in past six months (3386), EE
maker and express an opinion on their mobile (753), giffgaff (248), O2 (681), Tesco Mobile
phone service (2556), receiving their service (348), Three (533), Virgin Mobile (255),
from EE (487), giffgaff (174), O2 (428), Tesco Vodafone (568).
Mobile (233), Three (272), Virgin Mobile
(237), Vodafone (336), on a contract (1982), Base: for 2019: All who complained about
on prepay (555). Providers used by fewer than mobile service in past six months (2951), EE
100 respondents are not shown individually (647), giffgaff (207), O2 (604), Tesco Mobile
but are included in the total. (304), Three (454), Virgin Media (200),
Vodafone (535).
Note D
Note G
Q.5 Have you personally had a reason to
complain about any of these services or IN2/IN4/IN5: In terms of your fixed
suppliers in the last 12 months, whether or broadband service, how satisfied are you with
not you went on to make a complaint? the overall service/ reliability of your fixed
broadband service / speed of service while
Base: All UK households 16+ with mobile: online from (FIXED BROADBAND INTERNET
average mobile (6246), BT (221), EE (1188), PROVIDER)? Would you say you are…
giffgaff (402), O2 (1121), Tesco Mobile (572),
Three (687), Virgin Mobile (470) and Base for each of IN2, IN4 and IN5: All adults
Vodafone (874). aged 16+ who are the decision maker and
express an opinion on their fixed broadband
Note E internet service (2274), receiving their service
from BT (438), EE (141), Plusnet (155), Sky
Q9. Overall, how satisfied are you with the
(438), TalkTalk (298),Virgin Media (536).
service you received from [Provider] customer
Providers used by fewer than 100
services with regard to the complaint that you
respondents are not shown individually but
had?
are included in the total.
Base for 2020: All who complained about the ‘Don’t know’ responses have been excluded
mobile service in past six months (3386), EE from the base.
(753), giffgaff (248), O2 (681), Tesco Mobile
(348), Three (533), Virgin Mobile (255),
Vodafone (568). Base for 2019: All who
complained about the mobile service in
past six months (2951), EE (647), giffgaff
29Note H Note J
QN3: Based on your overall experience of QN1 Based on your overall experience of
(FIXED BROADBAND PROVIDER) as your fixed using (LANDLINE PROVIDER) for your landline
broadband provider, how likely would you be service, how likely would you be to
to recommend them to a friend or family recommend them to a friend or family
member as a fixed broadband provider? member as a landline provider? Please give a
Please give a rating on a scale of 0 to 10, rating on a scale of 0 to 10, where 0 is
where 0 is 'Extremely unlikely' and 10 is 'Extremely unlikely' and 10 is
'Extremely likely'? 'Extremely likely'?
Base: All adults aged 16+ who are the decision Base: All adults aged 16+ who are the
maker and express an opinion on their fixed decision maker and express an opinion on
broadband internet service (2274), receiving their landline service (1997), receiving their
their service from BT (438), EE (141), Plusnet service from BT (465), EE (119), Plusnet (125),
(155), Sky (438), TalkTalk (298),Virgin Media Sky (384), TalkTalk (276), Virgin Media (411).
(536). Providers used by fewer than 100 Providers used by fewer than 100
respondents are not shown individually but respondents are not shown individually but
are included in the total. are included in the total.
Note I Note K
L1/L3 – L1: I'd like to ask you some questions Q.5 Have you personally had a reason to
about your home landline service from complain about any of these services or
(LANDLINE PROVIDER). In terms of your suppliers in the last 12 months, whether or
landline service, how satisfied are you with not you went on to make a complaint?
the overall service provided by (LANDLINE
PROVIDER)? Would you say you are…L3: And Base: All UK households with fixed broadband
how satisfied are you with the reliability 16+: average broadband (6153), BT (1278), EE
of your landline service from (LANDLINE (295), Plusnet (419),, Sky (1245), TalkTalk
PROVIDER)? IF NECESSARY: By reliability, I (734), Virgin Media (1439) and Vodafone
mean being able to make a call when you (268).
need to, so getting a dialling tone? Would you
say you are…
Note L
Q.5 Have you personally had a reason to
Base for each of L1 and L3: All adults aged complain about any of these services or
16+ who are the decision maker and express suppliers in the last 12 months, whether or
an opinion on their landline service (1997), not you went on to make a complaint?
receiving their service from BT (465), EE (119),
Plusnet (125), Sky (384), TalkTalk (276), Virgin Base: All UK households 16+ with a landline:
Media (411). Providers used by fewer than average landline (5685), BT (1382), EE (264),
100 respondents are not shown individually Plusnet (368),, Sky (1142), TalkTalk (689),
but are included in the total. ‘Don’t know’ Virgin Media (1204) and Vodafone (258).
responses have been excluded from the
base.
30Note M Note N
Q9/Q12 – Q9: Overall, how satisfied are you Q9/Q12 – Q9: Overall, how satisfied are you
with the service you received from [Provider] with the service you received from [Provider]
customer services with regard to the customer services with regard to the
complaint that you had? …Q12: You said that complaint that you had? …Q12: You said that
your complaint was completely resolved, was your complaint was completely resolved, was
it completely resolved on your first contact it completely resolved on your first contact
with [Provider]? Base for each of Q9 and Q12 with [Provider]?
2020: All who have complained about
Broadband service in the last six months Base for each of Q9 and Q12 2020: All who
(3202), BT (642), EE (293), Plusnet (241), Sky have complained about Landline service in the
(707), TalkTalk (567), Virgin Media (752). last six months (2411), BT (599), EE (238),
Plusnet (89), Sky (629), TalkTalk (373), Virgin
Base for each of Q9 and Q12 2019: All who Media (483).
have complained about Broadband service in
the last six months (2897), BT (632), EE (204), Base for each of Q9 and Q12 2019: All who
Plusnet (214), Sky (611), TalkTalk (539), Virgin have complained about Landline service in the
Media (697).. last six months (2039), BT (543), EE (157),
Plusnet (89), Sky (493), TalkTalk (326), Virgin
Media (431).
31You can also read