ThomsonONE.com Investment Banking - User's Guide
←
→
Page content transcription
If your browser does not render page correctly, please read the page content below
ThomsonONE.com Investment Banking
                                   User’s Guide
Welcome to ThomsonONE.com Investment Banking. This user guide will show you everything
you need to know to access and utilize the wealth of information available from
ThomsonONE.com Investment Banking.
This program is an Internet-based database that may be accessed by using one of the network
computers in the McLeod Business Library in Alan B. Miller Hall.
Mason School of Business graduate students, undergraduate students with a business major,
faculty and staff may also access this program through the Mason School of Business network.

                                    Introduction
ThomsonONE.com Investment Banking provides market news, quotes, and reference data to
monitor changing market conditions and to gain important insight into a company, industry or
event. Company overviews provide financial data on more than 55,000 active public companies
globally. There is also data on more than one million private companies world wide.
The database also provides streaming Reuters news and quotes. The news includes market
stories and comprehensive analysis on companies, industries, market trends and more.
                                                      ThomsonONE.com Investment Banking User’s Guide
June 2013                                             McLeod Business Library, Mason School of Business
                                                                                                Page 1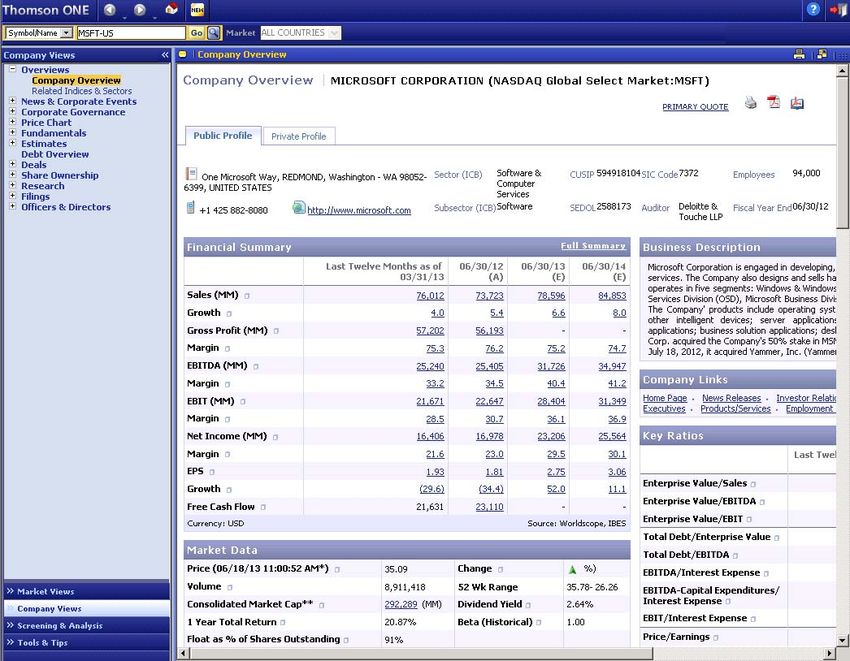
Table of Contents
Introduction ............................................................................................................................... 1
Table of Contents ...................................................................................................................... 2
Opening Screen ......................................................................................................................... 3
    Header ................................................................................................................................. 3
    Search Function .................................................................................................................. 4
       Performing a Search ...................................................................................................... 4
ThomsonONE.com Investment Banking Modes ...................................................................... 6
    Company Views Mode ....................................................................................................... 6
       Company Views Selections .......................................................................................... 7
           Overviews ............................................................................................................... 7
           News & Corporate Events ...................................................................................... 8
           Corporate Governance ............................................................................................ 9
           Price Chart .............................................................................................................. 9
           Fundamentals .......................................................................................................... 9
           Estimates ............................................................................................................... 11
           Debt Overview ...................................................................................................... 12
           Deals ..................................................................................................................... 12
           Share Ownership ................................................................................................... 13
           Research ................................................................................................................ 13
           Filings ................................................................................................................... 14
           Officers & Directors ............................................................................................. 14
    Market Views Mode ......................................................................................................... 15
           News ..................................................................................................................... 15
           Deal Activity ......................................................................................................... 17
           Corporate Events ................................................................................................... 18
           Corporate Governance .......................................................................................... 19
           Economics ............................................................................................................. 19
           Benchmark Bonds ................................................................................................. 21
    Screening & Analysis Mode ............................................................................................. 22
           Companies............................................................................................................. 22
           Deals & League Tables ......................................................................................... 27
           Share Ownership ................................................................................................... 30
           Institutional Investors............................................................................................ 31
           Filings ................................................................................................................... 33
           Individuals............................................................................................................. 33
    Tools & Tips Mode ........................................................................................................... 36

                                                                                    ThomsonONE.com Investment Banking User’s Guide
June 2013                                                                           McLeod Business Library, Mason School of Business
                                                                                                                              Page 2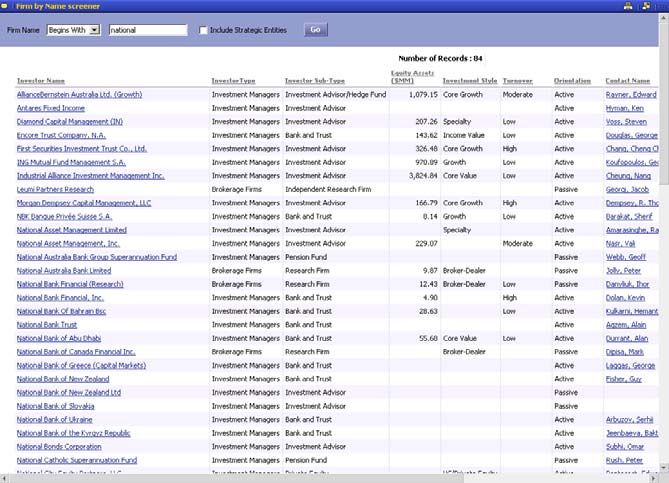
Opening Screen
The ThomsonONE.com Investment Banking opening screen is divided into three areas. The
first is the Header with a search function.

The second area is the Mode column, which is on the left side of the screen. This column
indicates the mode in which the database is operating. The modes are Market Views (see page
15), Company Views (which is the opening display) (see page 7), Screening & Analysis (see
page 22), and Tools & Tips (see page 36).
The third area is the display area, which changes according to the mode in which the database is
operating.

Header

In the first line of the Header, there are buttons for navigating the program (Forward and Back
buttons and a Home button). These buttons allow you to page forward and
back between the pages you have opened during your current session. The
Home button will return you to the initial opening screen.
There is also a What’s New button, which will open the What’s New page in the Tools &
Tips mode. See page 36 for information about the What’s New page.
                                                        ThomsonONE.com Investment Banking User’s Guide
June 2013                                               McLeod Business Library, Mason School of Business
                                                                                                  Page 3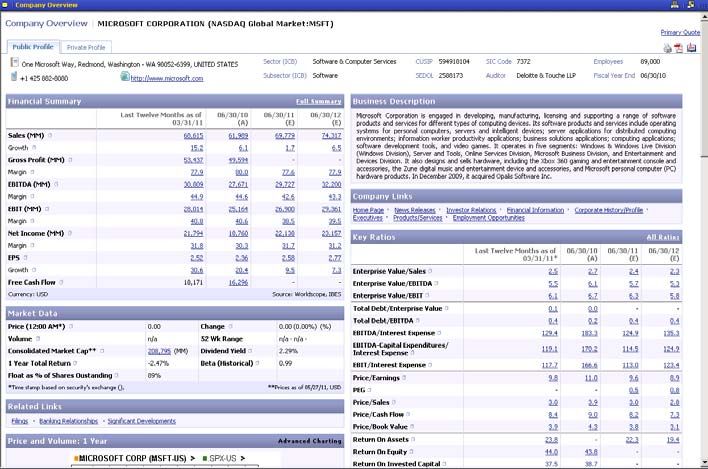
On the right side of the header there is a Help button, which has a menu
with three selections: Help Contents, User Info and Customer Support.
The Help Contents selection will open
a help screen in a new window. You
may use this window to browse or
search for help information on the use
of the database.
The User Info selection will open a
window with technical information
about the database connection.
The Customer Support selection will
open a window with contact
information for Thomson.
The Log Out button will log you out of the program without first asking if that is what
you really want to do.
Search Function
The second line of the Header has a search function and some other buttons. The Market box is
grayed out and
the All Countries
selection cannot be changed.
Performing a Search
The search function consists of two boxes and a Lookup Symbol button. The
first box has a drop-down menu with selections that allow you to choose a search
mode. The selections are: Symbol Name, All Companies, Company Tree,
CUSIP, SEDOL, ISIN, and PERMID. The Symbol Name selection is the default selection
when the program first opens. These selections are used to determine how the database searches
for a company.
The second box is used to enter your search term.
For example, for Symbol Name you would enter a ticker symbol into the second box.
For All Companies and Company Tree you would enter the name of a company.
For CUSIP, SEDOL, ISIN and PERMID you would enter the appropriate number or code into
the second box.
After entering a term click on the Go button to begin the search. The results will be opened in
the Company Overview page of the Company Views mode. See page 7 for information about
the Company Overview page.

                                                        ThomsonONE.com Investment Banking User’s Guide
June 2013                                               McLeod Business Library, Mason School of Business
                                                                                                  Page 4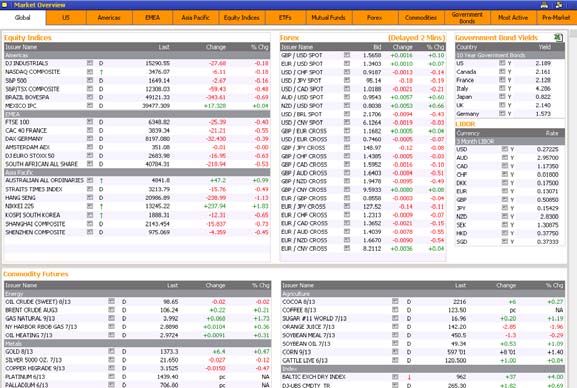
If you do not know the ticker symbol of the entity you are looking for click on the Lookup
Symbol button. This will
open a search function in
a new window. This
window has three tabs:
Advanced Search,
Recently Used and
Popular Symbols.
The Popular Symbols
tab displays a list of
symbols that have been
used repeatedly over
time. Clicking on an item
will have the information
for the entity
automatically entered into
the main search box and a
search initiated. The results of that search will be displayed in the Company Overview page of
the Company Views mode.
The Recently Used tab will display a list of symbols that have been used recently. Clicking on
an item will have the information for the entity automatically entered into the main search box
and a search initiated. The results of that search will be displayed in the Company Overview
page of the Company Views mode.
The Advanced Search tab is used to find a symbol for the entity you are researching. To make
a search select the universe to use and any qualifiers you may want in the first two lines.
Next, select the mode from the drop-down menu and enter your search term into
the second box. Click on the Search button to begin the search.
The results are displayed in the lower part of the window. Click on the item you
want and the information for the entity is automatically entered into the main
search box and a search initiated. The results of that search will be displayed in the Company
Overview page of the Company Views mode.

                                                        ThomsonONE.com Investment Banking User’s Guide
June 2013                                               McLeod Business Library, Mason School of Business
                                                                                                  Page 5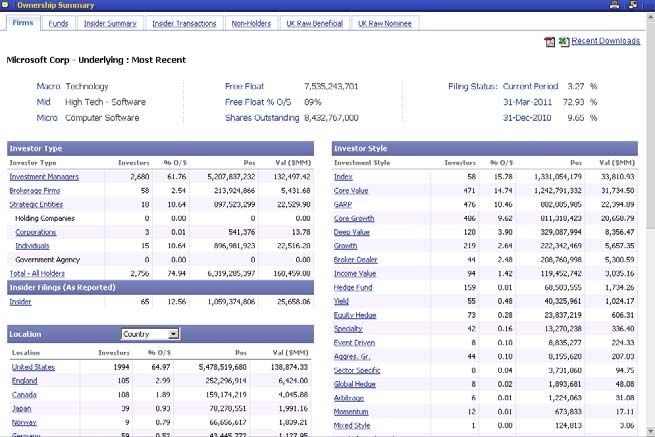
ThomsonONE.com Investment Banking Modes
To access the information in the ThomsonONE.com Investment Banking database use the
following modes: Company Views (below), Market Views (page 15), Screening & Analysis
(page 22), and Tools & Tips (page 36).

                           Company Views Mode
The Company Views mode is the default mode that is displayed when the program first opens.
The mode column, on the left side of the screen, displays the selections available in the
Company Views mode.

When the Company Views mode opens a company’s data is usually displayed. To change the
company to one you are researching perform a search using the search function in the program
header. See page 4 for information on performing a search.

                                                      ThomsonONE.com Investment Banking User’s Guide
June 2013                                             McLeod Business Library, Mason School of Business
                                                                                                Page 6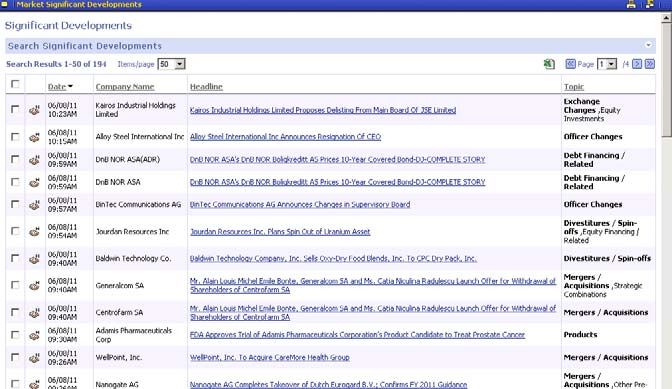
Company Views Selections
The selections associated with the Company Views mode are:
Overviews, News & Corporate Events, Corporate
Governance, Price Chart, Fundamentals, Estimates, Debt
Overview, Deals, Share Ownership, Research, Filings and
Officers & Directors.
Overviews
The Company Overview selection under Overviews is the
default display when the mode opens. There are two selections
under Overviews: Company Overview and Related Indices
& Sectors.
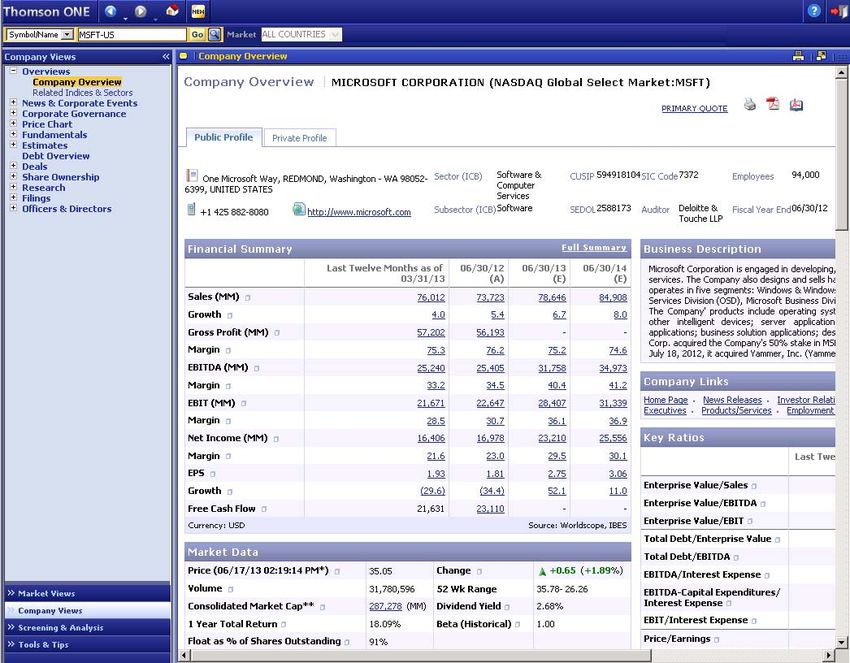
Company Overview
The Company Overview
page contains a great deal
of information in one long
scrolling page.
Some companies with a
private aspect will have two
tabs near the top of the
page: Public Profile and
Private Profile. The Public
Profile tab is open when
the page is first displayed.
The information on the
Company Overview page is
divided about 20 topics,
including:
Financial Summary, Market Data, Related Links, Price & Volume: 1 Year, Capital Structure,
Officers & Directors, Segments, Key Competitors, and more.
Those companies with a private aspect will have the
same categories in the Public Profile tab. The
Private Profile will have limited information,
usually four categories: Business Description, Key
Facts, Investment Rounds, and Historical Private
Equity Investors. This can vary depending on the
company being researched.
The Company Overview page has four icons near
the top of the page: Print, Export to PDF, Export to Full Company Report
PDF and Customize the Layout. The Print icon will print the current page.
The Export to PDF icon will open a PDF with the same information that is on the Company
Overview page.
ThomsonONE.com Investment Banking User’s Guide
June 2013 McLeod Business Library, Mason School of Business
Page 7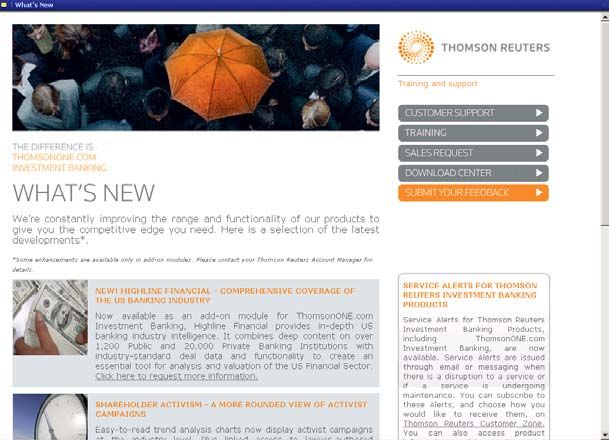
The Export to Full Company Report PDF icon will open a PDF report of more than 15 pages.
This report will have detailed information about the company.
The Customize the Layout icon is not operational at the time of this writing.
Related Indices & Sectors
The Related Indices & Sectors selection will open the Industry Groups and Sectors page. This
page has five tabs across the top: S&P GICS (Global Industry Classification Standard), DJ/DJ
Stoxx, FTSE International, ICB (Industry Classification Benchmark), and Indices. Each of
these tabs will display information pertinent to the tab topic.
The S&P GICS tab is
pictured at right.
Depending on the
company being
researched, not all tabs will have data to display.
You may change the company whose information is being displayed by typing a new ticker into
the Symbol box and clicking on the Go button. Also, the display may be modified by selecting
other options from the drop-down menus of the Layout and Sort By boxes.
News & Corporate Events
The News & Corporate Events selection in the Company Views
mode has five selections under it: News (the default display when
News & Corporate Events is opened),
Significant Developments, Corporate
Events, Event Briefs, and Event
Transcripts.
The News page has two tabs: Real Time
News and Top News. The Real Time News
tab displays recent articles, divided
according to the date. Clicking on a title will
open the article in the lower part of the page.
The Top News tab displays articles from a variety of sources. This is the same page that is
opened in the Top News selection in the Market Views mode.
On the Significant Developments page
you may display other articles by clicking
on the arrow icon on the right side of
the header. This will expand the
search controls for this page. Make
selections from the data field drop-down
menus and click on the Search button.
This will change the display of articles to
those that meet your new criteria.
Clicking on an article’s name will display it in the same box.
The other selections under Corporate Events will open other pages with information. The
current subscription does not include briefs and transcripts.
                                                         ThomsonONE.com Investment Banking User’s Guide
June 2013                                                McLeod Business Library, Mason School of Business
                                                                                                   Page 8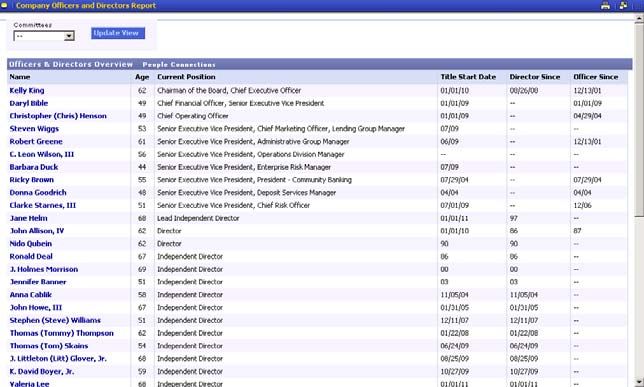
Corporate Governance
The Corporate Governance selection has two items under it:
Takeover Defense and Shareholder Activism.
The Takeover Defense page is
displayed when this selection
is first opened. The page has
four tabs: Current Takeover
Defense Profile, Historical
Takeover Defense Profile,
Comparable Analysis and
Poison Pills. Each of these
tabs will display information
concerning the policies the
company has implemented to
prevent a hostile takeover.
The Shareholder Activism
page will display any recent
campaigns against the company.
Price Chart
The Price Chart selection
under the Company Views
mode has one item under it:
Price Chart.
This selection opens the
Thomson Charts Plus page
with an interactive chart. You
may change the company being
displayed, the time period,
frequency and chart style.
In addition to this you may
compare the company other
companies (up to 20), an index
and display other data and
indicators.
The icons in the
upper right allow
you to export the
data to Excel or the chart image to the clipboard.
Fundamentals
The Fundamentals selection under the Company Views mode has
three items under it: Financial Reports, Reuters Fundamentals, and
Comparables.
                                                     ThomsonONE.com Investment Banking User’s Guide
June 2013                                            McLeod Business Library, Mason School of Business
                                                                                               Page 9
The Financial Reports page
is displayed when this
selection is first opened. This
page has five tabs: Balance
Sheet, Income Statement,
Cash Flow Statement,
Ratios, and Summary. Each
of these will display a
spreadsheet of pertinent data.
The display may be changed
to show annual or other
information by selecting
different options from the
drop-down menu in the
Report box. The annual
selections will display five years of data.
The header for each of these tabs has three icons: Export Current Report (to Excel),
Export Current Report (in PDF), and Export All reports (to Excel).
The Export All Reports will export all five tabs to Excel. The report will display the data that
is selected in the current report (e.g., Interim, Annual, etc.) for all reports.
The Reuters Fundamentals
page has seven tabs
(Balance Sheet, Income
Statement, Cash Flow
Statement, Ratios,
Summary, Segments, and
Metrics), each displaying a
table of data. Each tab has
a Display Options section
that allows you to modify
the data being displayed.
This page allows you to
Export the data to Excel.
The Comparables page
give you three tabs
(Market Data & Price
Multiples, EV Multiples &
Credit Ratios, and Key
Financials & Effectiveness)
of data comparing the
company you are researching
with its major competitors.
This data may also be exported
to Excel.

                                                        ThomsonONE.com Investment Banking User’s Guide
June 2013                                               McLeod Business Library, Mason School of Business
                                                                                                  Page 10
Estimates
The Estimates selection under the Company Views mode has five
items under it: Consensus Estimates, Detail Estimates, Earnings
Surprise, Estimate Activity, and Estimate History.
Consensus Estimates
The Estimates
selection opens with the
Consensus Estimates
selection Company
Forecast page display.
This page opens with
the current financial
status of the company,
and an estimate for the
current year
performance. Hovering
the mouse pointer over
the table causes a Mean
column to appear.
The data display may
be changed to reflect past data or future estimates by selecting years from the Fiscal Year box
drop-down menu. The menu offers about five years of future selections. The further into the
future, the data is more general and limited.
Select the date and click on the Go button to change the display.
Detail Estimates
The Detail Estimates
selection opens the Company
Detail Forecasts page. This
page offers another set of
data, including a variety of
analysts’ estimates. The data
display may be changed by
selecting dates from the
Period box drop-down menu.
Four years or so of future
estimates are available.
Earnings Surprise, Estimate
Activity, and Estimate
History
The Earnings Surprise, Estimate Activity, and Estimate History selections open more pages
of estimate information. The Estimate Activity and Estimate History selections allow you to
change the displays to reflect other periods.
ThomsonONE.com Investment Banking User’s Guide
June 2013 McLeod Business Library, Mason School of Business
Page 11Debt Overview
The Debt Overview
selection under the
Company Views mode
opens the Debt Overview
RK page. This page shows
you a display of the
company’s debt, including
the number of issues
outstanding, total face
amount outstanding and
total amount issued. It also
has both current and
historical agency ratings
and lets you see detailed
information on individual
loans and bonds.
Deals
The Deals selection under the
Company Views mode has one
item: Company Deals.
The selection opens with the
Company Deals page displayed. This
page has two tabs: Deals and Shelf
Takedowns.
The Deals tab is divided into five
sections: Deal Summary, Banking
Relationships, Largest Deals, Deal
Statistics and Deal List. Each section
gives information concerning deals
in which the company being
researched is involved.
The Chart button
in the upper right
allows you to toggle between a chart
display and a table display. The List
button will display the Deal List.
You also may export the page to
Excel or to a PDF file.
The Shelf Takedowns tab displays
shelf takedown information.
ThomsonONE.com Investment Banking User’s Guide
June 2013 McLeod Business Library, Mason School of Business
Page 12Share Ownership
The Share Ownership selection under the Company Views mode has
three selections under it:
Ownership Summary, All
Shareholders and Shareholder
Momentum.
All three pages give you
information about the owners
and shareholders of the company
you are researching.
The Ownership Summary page is
displayed when the Share
Ownership selection is first
opened. This page has seven tabs
across the top, each one will
display a different set of
information concerning company
ownership. The tabs are: Firms, Funds, Insider Summary, Insider Transactions, Non-
Holders, UK Raw Beneficial, and UK Raw Nominee. Not every tab will have data for every
company.
The various pages may be exported to Excel by clicking on the Excel Download icon
in the upper right corner of the page. Some may also be exported in PDF format by
clicking on the PDF Download icon.
The Recent Downloads link will open a window with a listing of downloads, if any have been
made.
Research
The Research selection under the Company Views
mode has one item under it: Company Research.
This opens the Company Research—Embargoed
page. The page has a list of research reports. Access
to these reports is not part of the current
subscription.
ThomsonONE.com Investment Banking User’s Guide
June 2013 McLeod Business Library, Mason School of Business
Page 13Filings
The Filings selection under the
Company Views mode has two
items: Company Filings and
Delta Reports. The Company
Filings page is displayed when this
selection is first opened. This page
lists the filings the company has
submitted to the SEC.
The top of the page lists the latest
key filings. You may view the
filing by clicking on the name of
the filing in the Filing Type
columns. This will open the report
in a new window.
The other table lists the rest of the reports. The first column has icons that indicate the formats
in which the report is available. These are HTML, As Filed, PDF and Word.
Clicking on the icon will open the report in a new window.
Selecting Delta Reports will open the Delta List page. This page will have a list of the delta
reports that are available.
Note: An SEC Delta Report identifies changes between two sequential SEC Filings of the
same form type, currently available in annual 10-Ks and quarterly 10-Qs. The filings are
compared and changes in the text are highlighted and numbered in the Delta Report.
Officers & Directors
The Officers & Directors
selection under the Company
Views mode has two items:
Officers & Directors and Officer
Detail.
The Company Officers and
Directors Report page is
displayed when this selection is
first opened. This page lists the
top personnel of the company.
Columns list information such as
age, position, and various dates.
Each name is link that will open a
page with more detail about that person. This is the same page that will be displayed when the
Officer Detail selection is opened.
The Officer Detail page has the top personnel listed in a drop-down menu in the Officers box.
Selecting a name from this list will open the detailed information about that person.
ThomsonONE.com Investment Banking User’s Guide
June 2013 McLeod Business Library, Mason School of Business
Page 14Market Views Mode
The Market Views mode is opened by clicking on the Market Views selection in the mode
column. This will open the Market Views table of contents
at the top of the mode column.
Market Views Selections
The Market Views mode has six main topics, most of
which have selections under them. The main selections are:
News (the opening display), Deal Activity, Corporate
Events, Corporate Governance, Economics, and
Benchmark Bonds.
News
The News selection in the
Market Views mode has
three items in it: Top
News, Market Overview,
and Significant
Developments.
When News first opens the
Top News page is
displayed. This page lists
news stories from many
areas. The menu column
on the left has numerous
selections, grouped into
categories: Home (with the Front Page selection displayed), Breaking News, Banking &
Finance, Company News, Market News, Commodities Markets, Industry News, National &
Regional News, National Language News, and Sport & Lifestyle.
Clicking on one of the selections will display the articles included in that area in the main part
of the page. Clicking on an article’s title will open the article in the display area.
The Market Overview selection will
open the Market Overview page. This
page lists various indices, bonds and
other instruments grouped in topic
tables: Equity Indices, FOREX,
Government Bond Yields, LIBOR,
and Commodity Futures.
Each table entry has an icon that
will open a menu with three
selections: Chart
1 Year, Chart -
Intraday, and Go
to Advanced Charting.
ThomsonONE.com Investment Banking User’s Guide
June 2013 McLeod Business Library, Mason School of Business
Page 15Clicking on Chart 1 Year or Chart - Intraday
will open a chart in a new window. The Go to
Advanced Charting selection will open the Price
Chart page in the Company Views mode. See page
9 for information about the Price Chart page.
The Market Overview page has 13 tabs across the
top of the page: Global (the initial display), US,
Americas, EMEA, Asia Pacific, Equity Indices,
ETFs, Mutual Funds, Forex, Commodities, Government Bonds, Most Active, and Pre-
Market. Each of these tabs will open similar pages with tables of data pertinent to the tab’s
topic. Each table will have similar characteristics as the ones on the Global tab.
The Significant Developments
selection will open the Market
Significant Developments page.
This page lists articles about
important happenings. Clicking
on a title will open the article in
the same table cell. You may
close the article by clicking on
the title again.
You may export the
table to Excel or PDF
by clicking on the
Excel or PDF icon. The entire
table will be exported if no
check box has been selected. If you select one or more articles and then click on the icon only
those articles selected will be exported.
ThomsonONE.com Investment Banking User’s Guide
June 2013 McLeod Business Library, Mason School of Business
Page 16Deal Activity
The Deal Activity selection under Market Views has four items under it:
M&A, Equity, Bonds, and
Loans. Each of these also
has a submenu with the same
four items: Market
Overview, Recent Deals,
League Tables, and Volume
Trends.
Each of these pages is
similar to the other pages of
the same names.
Overview
All Overview pages are a
long scrolling page with
charts and tables. Each
section of the pages have
headers with Details links.
Clicking on this link will
display the data from that
section in a table.
Clicking on an entity name (e.g., industry) in
some tables or icons in others will open lists of
deals. These lists give detailed information
about the various deals or the companies
involved in the deals. Some tables have icons
for View Deal Tearsheets,
View Filings, and View News.
Recent Deals
The Recent Deals selections will
open pages with tables of
information about companies
involved in deals.
The Recent Deal page under the
M&A selection will have two
tabs: Announced and Completed.
Both tabs are similar.
There are icons in the
top section of the page
where you may
download the table of information
to Excel or print it.
ThomsonONE.com Investment Banking User’s Guide
June 2013 McLeod Business Library, Mason School of Business
Page 17The top part of the table has boxes (Announced or Completed, Target Public Status, Target
Industry, and Target Region) where you may make selections from the drop-down menus to
modify the companies displayed in the table. Click on the Go button to display the selections
you have made.
There are also two buttons (Export Tearsheet and
Print Tearsheet) that allow you to export or print
selected company deal information. Companies are selected by clicking on the check box
beside the company name so that a check mark appears in the box. More than one may be
selected at a time.
Each company line includes one or two icons that represent data that may be viewed.
These are View Deal Tearsheets and View Filings.
The Recent Deals pages under the
Equity, Bonds, and Loans selections
are similar to each other. These pages
will have two, three or four tabs
(Calendar, Pipeline, Withdrawn and
Completed). The Calendar tab (under
the Equity selection only) will have a
calendar with tickers listed in each day
indicating when the various deals were
scheduled. Clicking on a ticker will
open a deal tearsheet with the deal
information.
The Pipeline, Withdrawn, and Completed
tabs are all similar to and operate in a similar
fashion as the Recent Deals page under the
M&A selection. Please go to page 17 for
information about using these tabs.
Corporate Events
The Corporate Events selection under the
Market Views mode has three items under it: Corporate Events, Event
Briefs, and Event Transcripts.
Each of these selections will open
pages with information
concerning corporate events.
Note: The information is very
limited with the current
subscription.
The subscription also does not
cover the content of briefs and
transcripts.
ThomsonONE.com Investment Banking User’s Guide
June 2013 McLeod Business Library, Mason School of Business
Page 18Corporate Governance
The Corporate Governance selection
under the Market Views mode has one
item under it: Shareholder Activism.
The Shareholder Activism page is
automatically opened when Corporate
Governance is selected.
This page is in six sections: Recent
Activist Campaigns, Activist Campaigns
by Industry, Activist Campaigns by
Demand, Activist Campaigns by Status,
Top Activists by Total Number of
Campaigns, and Prominent Activists.
The Recent Activist Campaigns section
lists the companies that have had
campaigns against them. The name of each company in the list is a link to that company’s
Company Overview page. See page 7 for information about the Company Overview page.
Each company also has a Tearsheet icon that will open a tearsheet about the campaign in a
new window.
The Prominent Activists section list the entities that are involved in campaigns. The name of
each entity is a link that will open an information page about that entity in a new window.
Economics
The Economics selection under the Market Views mode has three
items under it:
Economic Indicators,
Economic Events, and
Economic Calendar.
The Economic
Indicators page is
displayed when the
Economics selection is
first opened. This page
has two tabs: Key
Indicators and
Overview. The Key
Indicators tab is
usually the initial
display when the page
first opens.
The indicators displayed may be changed by selecting a different country (from about 120
selections) or category (about 80 are available) from the boxes at the top of the list.
ThomsonONE.com Investment Banking User’s Guide
June 2013 McLeod Business Library, Mason School of Business
Page 19The page is a table of indicators that are broken up into topics: Surveys & Cyclical Indexes,
National Accounts, Money & Finance, Prices, Labor Market, Consumer Sector, Industry
Sector, Government Sector, and External Sector.
Each name of an indicator is a
link that will open the Overview
tab with a display of that
indicator’s chart and a table of
data.
You may return to the list of
indicators by clicking on the Key
Indicators tab.
Each indicator has an icon
next to its name. Clicking on
this icon will open a chart in
a new window.
Each chart will display up to fifty
years of information.
Economic Events
The Economic Events selection under
Economics will open the Economic
Event List View page. This page has a
list of economic events. The list may be
filtered by changing the dates or
classification settings at the top of the
page.
Clicking on the title of an event in the
list will open an Events Details page in
a new window.
Economic Calendar
The Economic Calendar selection will
open the Economic Calendar page. This
page lists events on a long scrolling
calendar. The events of each day are
listed in the date cell. This makes the cells
very long and to get to the next week you
must scroll to find it.
Clicking on the title of an event in the list
will open an Events Details page in a new
window.
ThomsonONE.com Investment Banking User’s Guide
June 2013 McLeod Business Library, Mason School of Business
Page 20Benchmark Bonds
The Benchmark Bonds selection
under the Market Views mode
opens the Benchmark Bonds page.
This page has a graph at the top of
page with about one year of United
States 5 Year Yield activity.
The settings for this graph may be
changed by using the selections on
the right side of the page.
Below the graph is a table of bond
data on about 25 countries.
ThomsonONE.com Investment Banking User’s Guide
June 2013 McLeod Business Library, Mason School of Business
Page 21Screening & Analysis Mode
The Screening & Analysis mode is opened by clicking on the
Screening & Analysis selection in the mode column. This will open
the Screening & Analysis table of contents at the top of the mode
column.
Screening & Analysis Selections
The Screening & Analysis mode has six main topics, most of
which have selections under them. The main selections are Companies (the opening display),
Deals & League Tables, Share Ownership, Institutional Investors, Filings, and Individuals.
Companies
The Companies selection in
the Screening & Analysis
mode has one selection
under it: Company
Screener. This opens the
Company Screening page.
The Company Screening
page has four tabs: Search
Library, Basic Search,
Advanced Search, and
Results. The Basic Search
tab is displayed when the
page first opens.
Basic Search Tab
The screen has three
sections with the top section
expanded and the bottom
two contracted. Clicking on
the Expand/Contract
arrows for each section
will cause each section to
expand to display the
options available.
The sections are Profile Criteria, Financial Criteria and Stock & Earnings Criteria. You may
enter search terms or select as many or as few criteria as needed to make a search.
When you have made your selections/entered terms click on the Search button in any section
and your search will be conducted.
Your search results will be placed in the Results tab, which is automatically opened. See page
25 for information about the Results tab.
ThomsonONE.com Investment Banking User’s Guide
June 2013 McLeod Business Library, Mason School of Business
Page 22Advanced Search Tab
Clicking on the Advanced Search tab will
open a search page with three steps. The steps
are: Step 1: Select Base Set to Search Against;
Step 2: Select Items; and Step 3: Confirm/
Refine Search Criteria.
Perform a search by completing each step.
1. In Step 1 open the drop-down menu and
select the set you wish to use in your
search. The choices are All Companies,
Active Companies, and Quotes. Making a
selection will place that set in the Search
Criteria column for row 1 in the Step 3
table.
2. Step 2. Select the database to use in your
search by opening the drop-down menu in
the Database box. The choices are
Personal, Thomson Financial, DataStream, IBES History, First Call,
Private Company, and Worldscope. The default selection is Thomson
Financial.
Next, select the Categories and search codes you want to use. The
Categories box contains a list of topics. Each topic is a header for more
topics below it. Click on the “+” sign and more topics will be revealed.
As you click on the lowest level of topics, the codes in the right box will
change. You may scroll up and down the list of codes until you find one you want.
Highlight the code and click on the Definition button if you need to know about this item.
This will open the TAFieldDefinition window where a definition of the highlighted code is
displayed.
Click the Select button to open the Thomson
One Banker – Expression Builder window.
This window allows you to complete setting
up your search expression. The code item
you selected is displayed in the Item box.
You have the option to select a specific
Period. Also, the operator must be selected
(the default is Greater than or equal) and a
value must be entered in the Value box.
Depending on the items selected, the
number of selections in the Expression
Builder window may be different.
There are additional criteria available for
selection/de-selection in the right column.
ThomsonONE.com Investment Banking User’s Guide
June 2013 McLeod Business Library, Mason School of Business
Page 23As the expression is modified the changes show up in the Expression box at the bottom of
the window.
When you are finished building your expression, click on the Add button.
This will place your expression in row 2 of the table in Step 3.
You may add more expressions using the Expression Builder. Each will be added to another
row in the table in Step 3.
3. In Step 3 you have the ability to refine your search terms, add a query, or save your query.
You may also change the currency used in the search results. The default currency is USD
(U.S. dollars).
Clicking on one of your expressions in the table will open the Expression Builder window
where you may replace the expression. The last column of the table has a red “X” for each
row. Clicking on the “X” will delete that row.
Additional expressions may be added to the table by clicking on the Add Item link at the
bottom of the screen. This will open the Expression Builder window.
When you have finished, click on the Search button and the search will be conducted.
Your search results will be placed in the Results tab, which is automatically opened. See
page 25 for information about the Results tab.
Note: To save or view your set, the number of companies in the set must be at least one and
less than 5001 companies. If your search results has too many companies they will
not be displayed.
Search Library Tab
Clicking on the Search Library tab will open
the Search Library page. This page has
numerous topics divided into general topics such
as Regions & Countries, Sectors & Industries
and Analytics. Clicking on a topic will open a
window where you may select a specific item
from a list.
For example, clicking on Country Breakdown
will open a window where you may scroll down
a list of countries or search for a country by
entering a term in the Search Codes box and
clicking the Search button.
Once you have a country highlighted, click on
the Select button to place it in the Selected
Codes box.
Clicking on the Add button starts your search.
Your search results will be placed in the Results tab, which is
automatically opened. See page 25 for information about the Results tab.
ThomsonONE.com Investment Banking User’s Guide
June 2013 McLeod Business Library, Mason School of Business
Page 24Results Tab
When a search is made in the
Search Library, Basic Search,
or Advanced Search tabs the
results are automatically
displayed in the Results tab.
The search results are displayed
in a Result Data table. The
companies are displayed with a
maximum of 150 companies per
page.
The company names in the
Result Data table are links to that
company’s Company Overview
page in the Company Views
mode. See page 7 for information
about the Company Overview
page.
The other columns in the table
display data that you selected in
your original search (e.g., market
sector, country code, etc.)
Results Page Tabs
Across the top of the table is a row of tabs. These tabs (Search Data, Profiles, Financials,
Market Data, Key Items (not displayed for all searches), and Report Writer) are used to
display information about the companies in your search results list. The default display is to
have the Search Data tab open to the Result Data table.
Profiles Tab
Clicking on the Profiles tab will display
the search result companies in a Profile
Info table.
The company Name and Quote Symbol
columns display that information about
the company in each row. Each of these
items are links that will open the
Company Overview page for that
company. See page 7 for information
about the Company Overview page.
The other columns display CUSIP,
SEDOL, Country, Exchange, and
Primary SIC Code information about each company.
ThomsonONE.com Investment Banking User’s Guide
June 2013 McLeod Business Library, Mason School of Business
Page 25Financials Tab
The Financials tab displays the search result
companies in a Key Financials table. The company
name is a link to that company’s Company Overview
page. See page 7 for information about the Company
Overview page.
Market Data Tab
The Market Data tab displays the search results companies in a Key Market Data table. The
company name is a link to that company’s Company Overview page. See page 7 for information
about the Company Overview page.
Key Items Tab
The Key Items tab displays the search results companies in
a Key Items table. The company name is a link to that
company’s Company Overview page. See page 7 for
information about the Company Overview page.
Report Writer Tab
Clicking on the Report Writer tab opens a drop-down menu with two
selections, Open a Saved Report and Create Report.
The Open a Saved Report selection will open the Thomson One Banker – User Storage
window with any saved reports listed. Double click on a report to have the report displayed in
the Report Writer tab.
The Create Report selection will open the
Search Report Creator window. You may use this
window to select items to have displayed in a
customized report. Items in the Selections box are
those that will be displayed in your report. Click
on the OK button when you have selected the
elements for your report. This will display the
report in the Report Writer tab.
Once a report is displayed in the Report Writer
tab, the tab has a secondary menu with three
selections, Create/Edit Report, Open a Saved Report, and Save Custom Report. The
Create/Edit Report and Open a Saved Report selections open the same windows as the two
selections in the Report Writer drop-
down menu. The Save Custom Report
selection allows you to name and save the
report you have created.
The report is displayed in a Result Data
table, with column elements
corresponding to the items you selected in
the Search Report Creator window. If you
open a saved report, the report name will
be displayed instead of “Result Data.”
ThomsonONE.com Investment Banking User’s Guide
June 2013 McLeod Business Library, Mason School of Business
Page 26Deals & League Tables
The Deals & League Tables selection under the Screening &
Analysis mode has six items under it: Advanced Search (the opening
display), M&A, Equity, Bonds, Loans, and Project Finance. Except
for the Advanced Search selection, each of these have more items
under them.
Advanced Search
The Advanced Search page is opened
when Deals & League Tables is
selected. This page has the first step
for setting up your search. On this
page you select the databases to
include in the search. When you have
made your selections by clicking on
the checkboxes next to your
selections click on the Continue
button to go on to the next step.
This will open a new Advanced
Search page. This page allows you to
select the data items you
want to include in the search.
The data items section has
two tabs: Item List and Item
Search. The Item Search
tab allows you to search for
items while the Item List tab
allows you to browse for
items to include.
Clicking on an item on this
list will open a dialog
window where you may
search for and select items to
include in your search.
Selected items will be
displayed in the Search List
box.
Once you have populated the Search List box you may view the results by clicking on the
Preview button. Clicking on the Results tab or Execute button do not produce any results. The
results are displayed on a Quick Display page under the Results tab.
ThomsonONE.com Investment Banking User’s Guide
June 2013 McLeod Business Library, Mason School of Business
Page 27The results are displayed in a table with
tearsheet and filing icons by
each entry. Clicking on a
View Deal Tearsheet icon
will open the tearsheet for that deal in a
new window. The View Filings icon
will open a window with a list of SEC
filings that may de downloaded or
viewed in a variety of formats.
The Quick Display page has four
buttons across the top of the list: Apply
to Search, Exclude From Search,
Export Tearsheet, and
Print Tearsheet.
The Export Tearsheet button will export to Excel the selected tearsheet, this is the same
tearsheet that is opened with the View Deal Tearsheet icon.
The Print Tearsheet button will print the selected tearsheet.
The Apply to Search and Exclude From Search buttons will open the Advanced Search
window with your original search criteria entered. A new criterion line is added to the Search
List box specifically for the selected deal.
M&A, Equity, Bonds and Loans
The M&A, Equity, Bonds and Loans selections each have three items
under them: Search Library, Quick Search and Advanced Search. Each
of these selections are similar and operate in a similar manner in all four
areas (M&A, Equity, Bonds and Loans). However, each area has pages
tailored specifically for the area in which it is
located.
The Search Library selections open the
Search Library pages. Each page is divided
into topics. Each topic has a list of items with
two links: Year to Date and Year to Last
Full Q. Clicking on one of these links will
open a page of data.
ThomsonONE.com Investment Banking User’s Guide
June 2013 McLeod Business Library, Mason School of Business
Page 28The Quick Search selections
will open the Quick Search
pages. These pages are similar to
each other and operate in a
similar manner. These pages
have a variety of criteria
selections grouped into five
sections: Date Criteria, Company
Criteria, Deal Criteria, Advisor
Criteria, and Financials Criteria.
The different search pages have
the headings tailored to the
specific areas. Each section may
be expanded or contracted by
clicking on the arrow icons on
the right side of each section header.
You may use data fields from one section or from all sections to set up the criteria for your
search.
There are three buttons near the top of the page. These buttons are also repeated at the bottom
of the page.
To clear all entries from the various sections click on the Clear Search button. The Send
Criteria to Advanced Search button
will take the criteria you have
selected and enter it into the
Advanced Search form. The
Advanced Search form will be
opened with the criteria entered. See
page 27 for information about the
Advanced Search pages.
The View Results button will start
your search. The results will be
displayed on a Report page.
The results are displayed in a
table with tearsheet icons by
each entry. Clicking on an icon will
open the tearsheet for that deal in a
new window.
The Advanced Search selections will open the Advanced Search pages. These pages are
similar to the main advanced search page opened by clicking on the Advanced Search
selection under Deals & League Tables. See page 27 for information about the Advanced
Search page.
ThomsonONE.com Investment Banking User’s Guide
June 2013 McLeod Business Library, Mason School of Business
Page 29Project Finance
The Project Finance selection has one item
under it: Quick Search. This opens the Project
Finance Quick Search page. This page operates
in a similar manner as the other Quick Search
pages. See page 29 for information about the
Quick Search pages.
Share Ownership
The Share Ownership selection under the
Screening & Analysis mode has five items
under it: Single Security Analysis, Single Security Momentum,
Peer Analysis, Peer
Momentum, and
Holdings Detail.
The Single Security
Analysis page is displayed
when the Share
Ownership selection is
first opened.
If you have been
researching a company, the
company information is
already entered into the Holding section. The other sections are blank until you choose criteria
for the analysis.
Criteria are selected by opening windows and selecting criteria from established lists. The
criteria windows are opened by clicking on the selections in the criteria column on the left. The
column is divided into sections corresponding to the sections on the page (Holding, Ownership
Details, Investor Attributes, and Report Settings). The Holdings section is the first one and has
the original company entered. This company may be changed by clicking on the in Specific
Security link in the column. This will open the Security Lookup window where you may search
for a different company. Clicking on the OK button will return you to the Single Security
Analysis page.
The other sections may have criteria added
in a similar manner. Click on the criterion
type you want to use to open the lookup
window for that criterion (e.g., Filing Type
Lookup). All the lookup windows operate in
a similar manner. Select or find the criterion
you want, then click on the OK button to
move the criterion to the Single Security
Analysis page. Some lookup windows allow
you to select only one item while others allow you to select as many as you need.
ThomsonONE.com Investment Banking User’s Guide
June 2013 McLeod Business Library, Mason School of Business
Page 30When you have finished setting up your analysis click on the Results tab near the top of the
page. The results will be
displayed in the main part of
the page, replacing the criteria
selection feature.
The results are displayed in a
table. Each line in the table is
a different investor. Clicking
on the name will open an
information page about that
investor.
The other selections under Share
Ownership (Single Security
Momentum, Peer Analysis, Peer
Momentum, and Holdings Detail)
operate in a similar manner (the
Peer Analysis page is pictured).
Institutional Investors
The Institutional Investors selection under the Screening &
Analysis mode has three items under it: Search Firms, Search Funds
and Target Investors.
The Search Firms
item is displayed
when the
Institutional
Investors selection
is first opened. This
opens the Firm by
Name Screener
page.
The Search Firms and Search Funds selections’ pages are similar and operate in the same
manner. Each has a search function near the top of the page. To make a search enter a name into
the data field. You have the option to select whether the search term you entered is searched as
Begins with, Contains, or is an Exact Match with the target firms. You also may include
Strategic Entities by clicking on the check box next to this selection. When you are ready, click
on the Go button to begin your search.
ThomsonONE.com Investment Banking User’s Guide
June 2013 McLeod Business Library, Mason School of Business
Page 31The results of the search are
displayed below the search
function.
The list of firm or fund names
has 11 columns of information.
The firm or fund name is a link
that opens a page with
information about the
organization.
The information page has five
tabs across the top of the page.
Each tab displays additional
information about the
organization. The tabs are
Overview, Fundamentals,
Mapped Funds, Contacts, and
Who’s Who. This page also
has a button and two icons in the top
right corner of
the page. The
open tab may be downloaded in
either PDF or Excel format by
clicking on one of the icons.
The View Portfolio button opens a
list of companies, in a new window,
in which the firm has investments.
The Target Investors selection
under Institutional Investors
opens a page with a search
function that has three sections.
When the page first opens there
are no criteria selected. To
populate the sections with criteria
you must select the criteria from
the menu column on the left side
of the page. The menu column is
divided into three sections.
Clicking on a category in the
menu column will open a
window with the criteria
selection function for that item. More than one criteria may be selected. Each criterion has to be
added to the main search function page before the window is closed. This system is similar to
the search function for the Single Security Analysis selection under Share Ownership in the
Screening & Analysis mode. Please go to page 30 for information about how this search
function works.
ThomsonONE.com Investment Banking User’s Guide
June 2013 McLeod Business Library, Mason School of Business
Page 32Filings
The Filings selection in the Screening & Analysis mode has one item
under it: Filings Search. This selection opens with the Advanced Filings Component page
displayed.
This selection allows you
to search for SEC filings
for companies. Enter the
company information
(name, ticker, ISIN, CIK
or CUSIP) into the first
box.
Select the other options
you want to use (time
period and filing
category) from the drop-
down menus.
You also may expand the lower
section of the page to display more
search options.
After making your selections and
entering any other data you may
wish to use click on the Search
button at the bottom of the page.
The search results will be displayed
in a table below the search form.
The first column has icons that
indicate the formats in which the
report is available. These are
HTML, As Filed, PDF and Word.
Clicking on the icon will open the report in a new window.
Individuals
The Individuals selection in the Screening & Analysis mode has two
main items under it: Officers & Directors and Institutional
Contacts. Each of these has two or three items under them.
Officers & Directors
The Officers & Directors
selection has three items:
Search Officers & Directors,
Connections, and Corporate
Relationships. The Search
Officers & Directors selection
is opened when the Individuals selection is first opened. This displays the Officer & Director
ThomsonONE.com Investment Banking User’s Guide
June 2013 McLeod Business Library, Mason School of Business
Page 33Search page. To search for people enter
search terms into as many of the four
boxes you wish to utilize. Only one box is
needed but placing terms in more will
narrow the search. Click on the Search
button when you are ready to start the
search.
The results are displayed in a table on a
new page. The list of names are links to
information pages for that person. It
includes some personal information and
information about the company with
which he or she is associated.
The Connections selection
opens the Officers and Directors
Connections page. This page has
two boxes for data entry. Enter a
name into the Officer 1 box and
click on the magnifying
glass icon. This will display
a list of officers to choose
from. Click on your choice and it
will be displayed in the box. Do the same for the Officer 2 box. Click on the Update View
button to display any relationships between the two officers.
The Corporate Relationships
selection opens the Officer and
Director Corporate
Relationships page. Enter a
search term into the Search box
(Last Name and First Name) and
click on the Go button. This will
display a list of company
officers. Select the one you want
to research and click on the Update View button. This will display a list of relationships for
that officer. You have the option of displaying a detailed listing of information about that
officer.
ThomsonONE.com Investment Banking User’s Guide
June 2013 McLeod Business Library, Mason School of Business
Page 34Institutional Contacts
The Institutional Contacts selection has two items
under it: Name Search and Target Contacts. The
Contact by Name Screener page is opened when
Institutional Contacts is selected. You have the
option to search for contacts by First Name, Last
Name, Contact City or Investor Name. Enter search
terms into one or more of the boxes
and click on the Go button.
Any people who meet your search
criteria are listed in a table below the
search function. Clicking on a
person’s name will open an
information page about her or him.
Clicking on a company name will
open an information page about that
company. The company information
page is the same as the page opened in
the Institutional Investors selection
under the Screening & Analysis
mode. See page 32 for information about this information page.
The Target Contacts selection
will open the Contact Screener
page. This page is a search
function with a criteria menu
column on the left side of the
page.
This page is similar to and
operates in a similar manner as
the pages under the Share
Ownership selection in the
Screening & Analysis mode. See
page 30 for information on the
operation of this page.
ThomsonONE.com Investment Banking User’s Guide
June 2013 McLeod Business Library, Mason School of Business
Page 35You can also read