STRATEGIES TO REDUCE TRAFFIC ACCIDENT RATES IN DEVELOPING COUNTRIES: LESSONS LEARNED FOR ASSESSMENT AND MANAGEMENT
←
→
Page content transcription
If your browser does not render page correctly, please read the page content below
I. M. Schoeman, Int. J. of Safety and Security Eng., Vol. 8, No. 1 (2018) 98–109

  STRATEGIES TO REDUCE TRAFFIC ACCIDENT RATES
 IN DEVELOPING COUNTRIES: LESSONS LEARNED FOR
         ASSESSMENT AND MANAGEMENT
                                             I. M. SCHOEMAN
                               Unit for Business Mathematics and Informatics,
                               North West University (Potchefstroom Campus),
                                                South Africa.

                                               ABSTRACT
Strategy formulation and approaches in assessment and management of traffic engineering challenges
related to the impact of traffic accidents on road networks in developing countries is problematic. The
core focus of this paper consists of research output derived from traffic accident data available in South
Africa. The availability of traffic accident data will be assessed to formulate applicable intervention
traffic management strategies. Furthermore, the paper will include a statistical analysis and projection
of such road traffic accident data in order to derive at certain tendencies from existing realities.
    From the outcome of the research lessons learned for improved traffic planning, management and
formulation of intervention strategies in developing countries will be deduced. Improved traffic and
transportation planning practices is a priority in developing countries and economies and will guide
resilient and sustainable traffic planning in developing countries.
Keywords: traffic accident, traffic management, traffic planning, transportation planning

                                      1 INTRODUCTION
Patel et al. [1] report that road traffic injuries (RTIs) are the eighth-leading cause of death
worldwide. The Department of Transport agency in South Africa that is responsible for road
safety, road traffic law enforcement and data collection and management on traffic accidents
and mortality is the Road Traffic Management Corporation (RTMC) [2] (Section 22 of the
RTMC Act and Treasury Regulation 28.2). Traffic data from Ref. [2] reveal that some 24
fatalities/100,000 population occur in 2015 in South Africa.
   Notwithstanding the fact that Australia’s per population road death rates have declined
57.9% for the period 1975–1995 they are continuously working on their road safety. Lang-
ford & Newstead [3] report that Australia adopts a Safe System Strategy in 2003 that is
similar to the one that have been implemented in Sweden and the Netherlands to support safer
roads, safer speeds and safer vehicles. The outflow of this was only 5.6 fatalities per 100,000
population in 2010. In 2011, they also released a new National Road Safety Strategy which
includes an update of key statistical measures. Hence, to improve road safety in developing
countries, there must be on-going planning and management. This paper will guide develop-
ing countries in improving road safety by lessons learned from assessment of road safety data
and in showing how to manage, analysis and predict traffic accidents which must inform
intervention strategy formulation and management.

     2 GAPS AND PROBLEMS WITH SOUTH AFRICA’S ROAD SAFETY DATA
Table 1 shows a summarised assessment of the RTMC website data by classifying the data
into four classes i.e., major crashes, fatalities, vehicle and licence information. This assess-
ment provides more information on the data available on the RTMC website, the period the
data cover and on the format of the available data.

© 2018 WIT Press, www.witpress.com
ISSN: 2041-9031 (paper format), ISSN: 2041-904X (online), http://www.witpress.com/journals
DOI: 10.2495/SAFE-V8-N1-98-109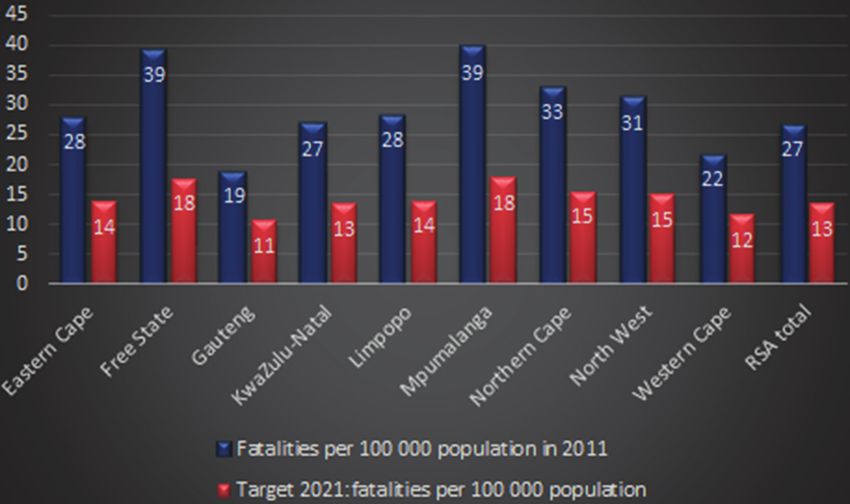
I. M. Schoeman, Int. J. of Safety and Security Eng., Vol. 8, No. 1 (2018)       99

               Table 1: Assessment of the data as available on the RTMC website.

Source: Own construction

The assessment of the available traffic accident data in South Africa concludes that:

• Traffic reports are not released on time on the RTMC website;
•• The available data are not reported in a research-friendly format (consider Table 1). Most
     of the available data must be retrieved indirectly from various Pdf-formatted reports on the
     website. The restricted data on the RTMC website that is available in EXCEL format are
     not provided on an on-going basis for analysis. The data must be available in summarised
     time series format for the most recent time frames of 10 years.
••   The data on the RTMC website only report on national and provincial level even though
     one of the objectives of the RTMC is to establish a partnership between national, provin-
     cial and local spheres of government.
••   Due to the fact that death certificates do not report the cause of death correctly (e.g., a road
     accident), it follows that Stats SA annual report on mortality and causes of death under
     estimate such reported figures.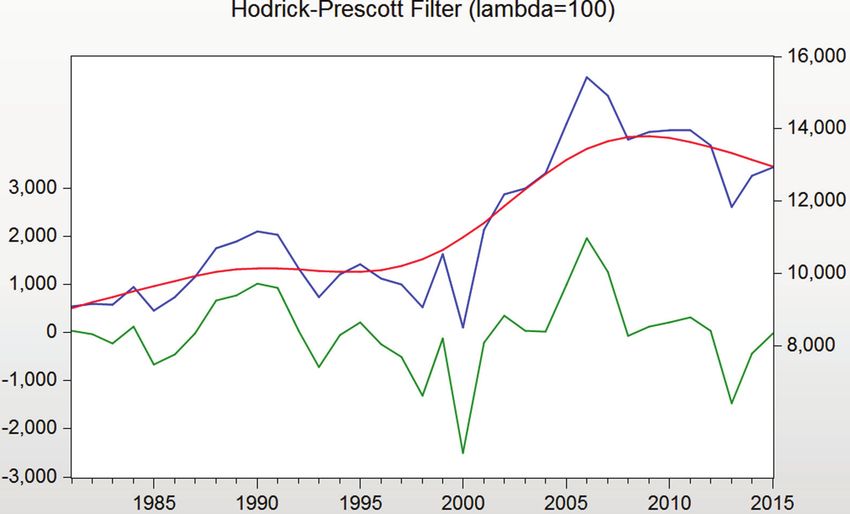
100 I. M. Schoeman, Int. J. of Safety and Security Eng., Vol. 8, No. 1 (2018)
•• Research undertaken by Chokotho et al. [4] report extensive data quality problems in
the police data, including significant underreporting of traffic injury deaths. In addition,
recording of the ‘time variables’ in the mortuary dataset was substandard. It was further
concluded that not all assumptions underlying the use of the capture-recapture method
were met; hence, estimates provided by this capture-recapture analysis should be inter-
preted with caution.
•• Annual reports of most municipalities do ot include any data on major crashes, fatalities or
vehicle and licence information in the municipality area.
3 AN ANALYSIS OF THE TRAFFIC DATA IN SOUTH AFRICA
3.1 Traffic accident trends
Figure 1 represents a very high linear relationship (correlation coeffisient of 0.975) as
would be expected between the number of fatal crashes and the fatalities (per 100 milllion
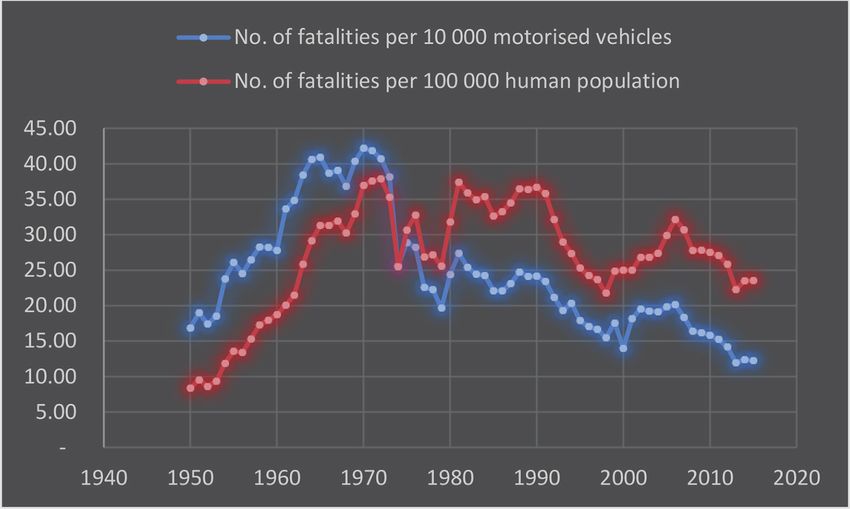
vehicle kilometres travelled). From Fig. 2 follows a recently minimum ratio of 22 for the
number of fatalities per 100,000 human population which were measured in 1998 and
2013. Moreover, global maximum ratios of 38 were measured in 1971 and 1972 with local
maximum ratios of 36 in 1982, 37 in 1990 and 32 in 2006. Figure 2 clearly indicate that
1974 was a watershed year since prior to 1974 the number of fatalities per 10,000 motor-
ised vehicles was higher than the number of fatalities per 100,000 human population but
after 1974 the inverse is true due to motorisation, affordability of vehicles and population
growth.
3.2 Statistical analysis of the traffic accident data
The traffic data is time-dependant, therefore an Auto Regressive Integrated Moving Average
(ARIMA) model is used to capture the dynamics of the fatalities per human population.
For more information on ARIMA models consider Gujurati & Porter [5]. ARIMA models
Figure 1: The relationship between the fatalities and fatal crashes (Source: Own construction
using data from the RTMC website).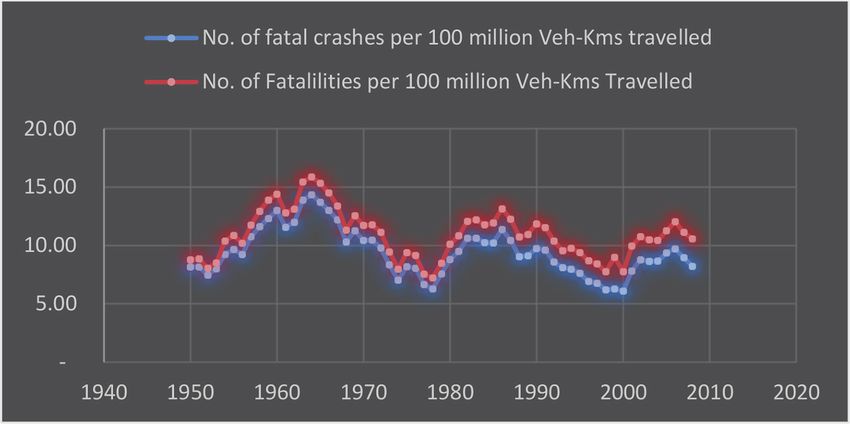
I. M. Schoeman, Int. J. of Safety and Security Eng., Vol. 8, No. 1 (2018)    101

Figure 2: The relationship between fatalities per human population and fatalities per number
          of motorised vehicles (Source: Own construction using data from the RTMC
          website).

attempt to capture empirically relevant features (patterns) of the observed data using only
information contained in the variable past values and error terms. The Box-Jenkins approach
is used to select the appropriate parsimonious ARIMA model. The ARIMA model that esti-
mate the fatality data the best is the ARIMA(1,1,0) model.
   The Hodrick-Prescott (HP) filter is a univariate two-sided linear filtering technique which
decomposes a time series into a long-term trend and cyclical part. This technique was first
used by Hodrick and Prescott to analyse post-war U.S. business cycles in Ref. [6]. In Fig. 3,

Figure 3: Hodrick–Prescott filter (Source: Own construction using the RTMC fatality data).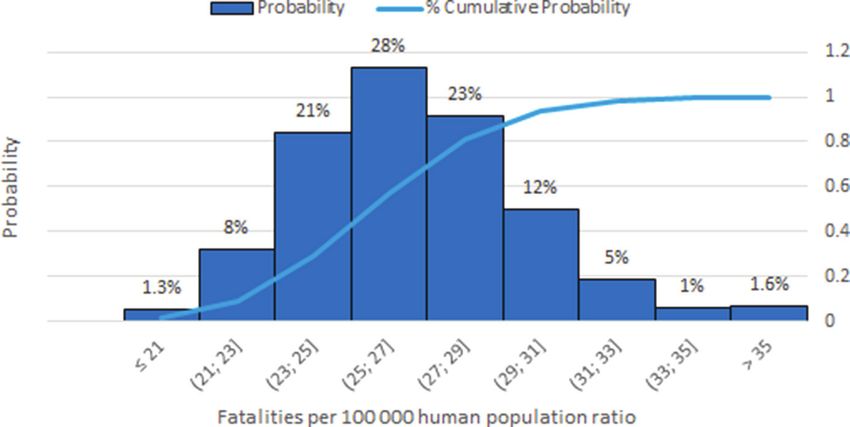
102           I. M. Schoeman, Int. J. of Safety and Security Eng., Vol. 8, No. 1 (2018)

           Table 2: Models that capture the dynamics of the number of fatalities.

Source: Own construction using fatality data from the RTMC website

the blue line represents the total number of fatalities, the red line shows the long-term trend
and the green line indicates the cyclical part included in the fatality data.
   In the Single Exponential Smoothing method ŷ_(t + 1) = α*y_t + (1 – α)*ŷ_t, the smooth-
ing series ŷ_t of the actual series y_t is determined as a weighted average of the past values
of y_t and the smoothing parameter α is calculated by minimizing the sum of squared errors.
The Exponential Smoothing (Holt-Winters – No seasonal) method is a double smoothing
method; consider Hyndman et al. [7] for more on Exponential Smoothing methods.
   Other methods like the Past Values Average and Moving Averages were also used in
Table 2 to capture the dynamics of the traffic data.

                         4 PREDICTION OF TRAFFIC ACCIDENTS
In this section, the best forecasting model will be determined by dividing the data up into a
training set and a validation set. The training set is used to determine the different parameters
(values) of each model in Section 3.2, and the validation set is used to determine the forecast
ability of each of these models. Therefore, the values for the forecast accuracy measures given
in Table 3 is the result of using the input data (number of fatalities for the period 1992–2015)
with training period 1992–2012 and forecast evaluation period 2013–2015. Here, the best
forecast model is illustrated to be the Average of all the Past Values which minimum values for
the forecast errors e.g., root mean squared error (RMSE), mean squared error (MSE) and the
mean absolute percentage error (MAPE). The Average Past Values predict 13,455 road
fatalities for 2016 in South Africa.
   Further, using the training period (1992–2013) and forecast period (2014–2015) on the
road mortality data, the forecast results follows in Table 4. By considering these forecast
I. M. Schoeman, Int. J. of Safety and Security Eng., Vol. 8, No. 1 (2018) 103
Table 3: Forecast evaluation for the number of fatalities.
Source: Own construction using the data in Table 2
Table 4: Forecast evaluation for the road mortality rate.
Source: Own construction using data from the models that capture the dynamics of the
mortality rate.
errors, we can conclude the best model to predict the mortality rate is the Hodrick–Prescott
filter, which predict a road mortality rate of 24 for 2016.
William et al. [8] report that a Monte Carlo Simulation is a probability simulation used by
decision makers for risk management thus to plan ahead for the future by estimating the rel-
ative likelihood and range of the possible uncertain (random) variable values. Hereby the
decision makers can assess the likelihood of a desirable outcomes and the risk of undesirable
outcomes.
Figure 4 is constructed using South Africa’s fatalities per 100,000 human population ratio
for the period 2002 to 2015. From using these historical data combined with a Monte Carlo
simulation, it follows that the likelihood of having a fatalities per 100,000 human population
ratio in the interval (25; 27] is the highest at 28% and the profitability of having this ratio
higher than 25 is equal to 71%. Hence, the Monte Carlo method implies that the probability
is very high in 2016 for the realisation of a mortality rate greater than 24.
Figure 4: The likelihood of the fatalities per 100,000 human population ratio ordered by
different classes (Source: Own construction using the RTMC fatality data).104 I. M. Schoeman, Int. J. of Safety and Security Eng., Vol. 8, No. 1 (2018)
5 HOW TO ACHIEVE AND SET TARGETS
Tolon-Becerraa et al. [9] propose a way of meeting the required European Union road safety
target on the reduction of fatalities in a certain period of time. This is done by distributing the
effort between the different European Union member countries, using an inverse logarithmic
function that penalise in a smooth way countries according to their base year mortality rate.
Hence, countries with high base year fatality rates are assigned high rates of reduction in
comparison with countries with low base year fatality rates.
This methodology if applied to the provinces in South Africa as illustrated in Fig. 5, using
2011 as base year to meet the UN’s target in [10] of halving the 2011 number of fatalities by
2020. Note that the RTMC supports the UN’s target in their annual reports.
Due to the fact that the current tendencies and results are due to yesterday’s habits, it follows
that targets will only be achieved if it is possible to reduce the target by refining and defining the
responsibility of the target. Therefore, the best way to meet a target is by diversifying the respon-
sibility to different applicable responsibility levels and by refining the responsibility as much as
possible. Hence, the above target methodology combined with progress monitoring must be
implemented not only on provincial level but also on local municipality level and must be adapted
and monitored on an annual basis. Due to the lack of municipality level road accidents data (and
the impossible process of getting hold of it), it is only applied to provincial level in this paper.
6 ROAD ACCIDENT CAUSES TO BE CONSIDERED IN ROAD SAFETY
STRATEGIES
6.1 Developed countries
Hughes et al. [11] provide the following traffic accidents contributing components and
factors that must be managed and coordinated by a Safety Management System:
1. Human (driver/pedestrian/passenger)
•• Compliance to traffic rules (overtaking, speeding, etc.)
•• Impairment (drugs, alcohol, etc.)
•• Abilities and capabilities (license, vision, etc.)
Figure 5: Setting fatality and mortality targets for each province (Source: Own construction
using Stats SA population data and RTMC fatality data).I. M. Schoeman, Int. J. of Safety and Security Eng., Vol. 8, No. 1 (2018) 105
•• Attitude and attention (emotion, phone distraction, etc.)
•• Helmets and protection clothing utilisation
•• Seatbelt utilisation.
2. Vehicle(s)
•• Maintenance, inspections, damage
•• Condition of wheels and tires
•• Condition of brakes
•• Condition of steering, pedals, levers, lights and suspension
•• Design standards
•• Overloading.
3. Road infrastructure
•• Surface (friction, shoulders, potholes, etc.)
•• Geometry (gradient, lanes, no shoulder, curves, etc.)
•• Poor maintenance
•• Traffic volumes
•• Inadequate signs, reflectors, signal, lighting, etc.
•• Obstacles (intersection type, crosswalk, island, etc.)
•• Poor road system (entry and exist of vehicles).
4. Transport and land use
•• Transport alternatives, other modes
•• Spatial arrangement, co-location
•• Accessibility - remoteness, location, service levels
•• Transport integration.
5. Environmental
•• Weather (fog, rain, etc.)
•• Smoke
•• Wildlife
•• Dawn, dusk, night and sun.
6. Socio-economic circumstance
•• Economics (finance, funding)
•• Employment structure
•• Population growth
•• Politics and government
•• Social norms and background
•• Travel purposes and activities
•• Legal (regulation, liability, insurance).
7. Crash response system
•• Emergency services and rehabilitation.
6.2 Developing countries
According to the work done by the World Health Organisation (cf. [12–15]), Nantulya and
Reich [16] and Juillard et al. [17] the main reasons for the high road traffic fatality and injury
rates in Africa are due to one or more of the following considerations:
• Road infrastructure [with the main emphasis on the lack of pedestrian subways and side-
walks (pedestrians) cycling infrastructure lanes and the uncorrelated growth between road
infrastructure improvement and the number of commuters];106 I. M. Schoeman, Int. J. of Safety and Security Eng., Vol. 8, No. 1 (2018)
•• Human: disregard of cyclists and pedestrians by drivers (inclusive of non-motorised traffic);
•• Road infrastructure: lack of road signs;
•• Transport and land use: the traffic modal mix on the roads;
•• Safety management system: ineffective planning by government inclusive of health,
emergency and transport agencies due to poor sampling techniques, varying traffic fatal-
ity definitions used by different reporting agencies, underreporting, reporting errors and
lack of integration between reporting agencies;
•• Socio-economic circumstance and transport and land use: non-existing unavailability or
non-affordable public transport;
• Socio-economic circumstance: increase in the utilisation of motorised transport due to
economic development, affordability and availability.
Traffic Offence Survey [18] reports the five highest contributory factors in 2015 to fatal
crashes in South Africa are due to:
• Human: Jay-walking pedestrians (41.6%);
•• Human: Speed too high for circumstances (9.2%);
•• Human: Hit and run (8.8%);
•• Vehicle: Tyre burst prior to accident (4.7%);
• Human: Intoxicated driver with liquor/drug usage (4.3%).
These five factors contribute 69% to all fatal accidents in South Africa.
From the above, it follows that main components on which developing countries must
focus on in their road safety strategies is the human, vehicle, road infrastructure, socio-
economic, safety management system and transport and land use.
7 STRATEGIES TO REDUCE TRAFFIC ACCIDENTS
Studying the reduction of road mortalities in the Netherlands (1972), UK (1983) and Spain
(1991) Lassarre [19] and Elvik [20] in combination with the papers of Hughes et al. [11],
World Health Organisation (cf. [12–15]), Nantulya and Reich [16], Juillard et al. [17] and
Traffic Offence Survey [18] it follows that road safety can be improved if the strategies,
function, objectives and output strive on a continuous basis to improve:
Safe Management:
• Risk management: (identification, assessment, analysis, prediction)
•• Information (data and research): Use common (police, hospital, mortuary, Department
of Transport, Stats SA) accident database. Allowing for more detailed and reliable anal-
yses of data. On municipality level, the location of crash incidents must be used to deter-
mine hotspots and to create a hotspot map of crashes in the municipal areas and thereby
identifying priority spatial locations for strategy formulation
•• Standards and well-defined targets. (Consider Section 5 on ways to achieve targets). Each
municipality needs to prioritise and apply sound traffic safety measures in line with the
applicable legislative framework with given targets that are based on their appropriate base
year performance in order to ensure and boost the countries but also the municipality’s
road safety and economic statistics
•• Capability (skills, knowledge, experience)
•• Capacity (financial, human, system, technology)I. M. Schoeman, Int. J. of Safety and Security Eng., Vol. 8, No. 1 (2018) 107
•• Systems (processes, structures, procedures, standards)
•• Integration (vertical coordination on national, provincial and local spheres and horizontal
alignment of sources on road accident data all using the same database and definitions)
• Implementation and improvement of policy, planning, design, installation, maintenance,
monitoring, evaluation, revision.
Safer road infrastructure:
• Improved design of roads and related supporting infrastructures
•• Identify pedestrian hazardous locations
•• Identification of hazard location (traffic accident hotspots)
• Information on the reason for accident.
Safer vehicles:
• Strong political commitment on design standards
•• Enforcement of legislation
• Inspections.
Human component behaviour change:
• Education: Educate young people or road safety using a guide like the Road Safety Cities
in Europe, Handbook [21]
•• Information (campaigns) on crashes to better the understanding of the risk
•• Strong enforcement initiatives with the focus on
•• speed control
•• alcohol consumption (‘drink and drive initiatives’)
•• promotion of helmet utilisation
•• promotion of seatbelt utilisation
•• road user sensitivities related to both motorised and non-motorised modes of transport.
Transport and land use
• Sustainable transport systems like bus rapid transit, to decrease traffic accidents and traffic
congestion.
ACKNOWLEDGEMENTS
The author gratefully acknowledges the National Research Foundation (GUN No. 81221) for
financial support.
REFERENCES
[1] Patel, A., Krebs, E., Andrade, L., Rulisa, S., Vissoci, J.R.N. & Staton, C.A., The
epidemiology of road traffic injury hotspots in Kigali, Rwanda from police data.
BMC Public Health, 16(697), 2016.
https://doi.org/10.1186/s12889-016-3359-4
[2] Road Traffic Management Corporation, South Africa, available at http://www.rtmc.
co.za/ (accessed 1 February 2017).108 I. M. Schoeman, Int. J. of Safety and Security Eng., Vol. 8, No. 1 (2018)
[3] Langford, J., & Newstead, S., Road accidents in Australia. IATSS Research, 32(2),
pp. 122–125, 2008.
https://doi.org/10.1016/s0386-1112(14)60215-6
[4] Chokotho, L.C., Matzopoulos, R. & Myers, J.E., Assessing quality of existing data
sources on road traffic injuries (RTIs) and their utility in informing injury prevention in
the Western Cape Province, South Africa. Traffic Injury Prevention, 14(3), pp. 267–273,
2013.
https://doi.org/10.1080/15389588.2012.706760
[5] Gujarati, D.N. & Porter, D.C., Basic Econometrics. McGraw-Hill, International
Edition, pp. 775–784, 827–828, 2009. ISBN: 978-007-127625-2.
[6] Hodrick, R. & Prescott, E., Postwar U.S. business cycle: an empirical investigation.
Journal of Money, Credit and Banking, 29, pp. 1–16, 1997.
https://doi.org/10.2307/2953682
[7] Hyndman, R.J., Koehler, A.B., Ord, J.K. & Simone, G., Forecasting with exponential
smoothing: the state space approach. Berlin: Springer-Verlag, 2008.
[8] William, L., Dunn, J. & Kenneth, S., Exploring Monte Carlo methods. Academic Press
(Elsevier), 2011, ISBN: 9780444515759.
[9] Tolón-Becerraa, A., Lastra-Bravob, X. & Bienvenido-Bárcena F., Proposal for territo-
rial distribution of the 2010 EU road safety target. Accident Analysis and Prevention,
41, pp. 1008–1015, 2009.
https://doi.org/10.1016/j.aap.2009.06.005
[10] Decade of Action for Road Safety 2011–2020: Global Launch, WHO (2011), available
at http://www.who.int/roadsafety/publications/decade_launch/en
[11] Hughes, B.P., Anund, A. & Falkmer, T., A comprehensive conceptual framework for
road safety strategies. Accident Analysis and Prevention, 90, pp. 13–28, 2016.
https://doi.org/10.1016/j.aap.2016.01.017
[12] Global status report on road safety: time for action. World Health Organization,
Geneva, 2009.
[13] Status report on road safety in countries of the World Health Organization (WHO)
African Region 2009. Brazzaville: WHO Regional Office for Africa, 2010.
[14] Global status report on road safety 2013: supporting a decade of action. Geneva: World
Health Organization, 2013.
[15] Global status report on road safety, 2015. Geneva: World Health Organization, 2015.
[16] Nantulya, V.M. & Reich, M.R., The neglected epidemic: road traffic injuries in
developing countries. BMJ, 324, pp. 1139–1141, 2002.
https://doi.org/10.1136/bmj.324.7346.1139
[17] Juillard, C., Labinjo, M., Kobusingye, O. & Hyder, A.A., Socioeconomic impact of
road traffic injuries in West Africa: exploratory data from Nigeria. Injury Prevention,
BMJ, 16, pp. 389–392, 2010.
https://doi.org/10.1136/ip.2009.025825
[18] Traffic Offence Survey (TOS). RTMC, 2016, available at http://www.rtmc.co.za/
images/documents/Traffic%20Offence%20Survey%20(TOS)%20Report%20-%20
December%202016.pdf. (accessed 17 February 2017).
[19] Lassarre, S., Analysis of progress in road safety in ten European countries. Accident
Analysis and Prevention, 33, pp. 743–751, 2001.
https://doi.org/10.1016/s0001-4575(00)00088-9I. M. Schoeman, Int. J. of Safety and Security Eng., Vol. 8, No. 1 (2018) 109
[20] Elvik, R., Dimensions of road safety problems and their measurement. Accident
Analysis and Prevention, 40, pp. 1200–1210, 2008.
https://doi.org/10.1016/j.aap.2008.01.004
[21] Road Safety Cities in Europe (RoSaCe): Implementation Handbook, 2007, (accessed
16 March 2017).You can also read