Prototyping an Affordable and Mobile Sensor Network to Better Understand Hyperlocal Air Quality Patterns for Planning and Design
←
→
Page content transcription
If your browser does not render page correctly, please read the page content below
94                                                                                               Full Paper

Prototyping an Affordable and Mobile Sensor
Network to Better Understand Hyperlocal
Air Quality Patterns for Planning and Design
Emily Schlickman1, Nikita Andrikanis2, Corbin Edward Burns Harrell2, Peter Nelson2
1University   of California, Davis, California/USA · eschlickman@ucdavis.edu
2University   of California, Davis, California/USA

Abstract: While there is a growing interest in employing planning and design tactics to improve air
quality issues, landscape architects often rely on coarse data that may not reflect hyperlocal conditions.
This paper explores how landscape architects might assemble their own sensor network to collect data
on hyperlocal air quality patterns, how this data might vary spatially and temporally across a site, and
how findings from this exercise might inform the site analysis process. To explore these issues, we
prototyped an affordable and mobile sensor network that could be publicly deployed to capture air
quality variation at the block scale. We tested the system by building units and collecting data across
the University of California, Davis campus for 30 days. By analyzing the resulting data, the sensor
system is capable of identifying spatial and temporal hotspots. More generally, when deployed at a
larger scale, such a system could be used to improve our understanding of hyperlocal air quality patterns
for planning and design.
Keywords: Sensors, landscape architecture, air quality, environmental monitoring, particulate matter

1      Introduction
The field of landscape architecture has a long history of using environmental data to help
make informed decisions about planning and design. Oftentimes, though, due to the time and
resource intensive nature of site-level data collection, this information tends to be secondary,
coarse, and abstract with limited ties to the landscape itself. As a result, assumptions are often
made about hyperlocal variations in environmental conditions. Recently, though, there has
been a growing desire in the field to find new ways of understanding hyperlocal site condi-
tions through the development and deployment of environmental sensors (CANTRELL &
HOLZMAN 2015, LOKMAN 2017, CANTRELL & MEKIES 2018).
In this paper, we explore how landscape architects might assemble their own units to collect
data on hyperlocal air quality patterns, how this data might vary spatially and temporally, and
how findings might inform the site analysis process. To do this, the paper begins by address-
ing why landscape architects are increasingly interested in gathering site-level air quality
data. The paper then explores how some academics and practitioners are currently experi-
menting with air quality monitoring in their work. The paper continues by unpacking the
methodology of a recent hyperlocal air quality monitoring project with details about the site
and general study design. The paper concludes with results from the study, a discussion of
preliminary observations as well as potential avenues for future research.
To begin, there are a number of reasons why landscape architects are increasingly interested
in gathering site-level air quality data. In a broad sense, the field of landscape architecture
has experienced a shift towards evidence-based design and landscape performance metrics
(DEMING & SWAFFIELD 2011). Secondly, air pollution is considered a major risk factor for

Journal of Digital Landscape Architecture, 6-2021, pp. 94-100. © Wichmann Verlag, VDE VERLAG GMBH ·
Berlin · Offenbach. ISBN 978-3-87907-705-2, ISSN 2367-4253, e-ISSN 2511-624X, doi:10.14627/537705006.
This article is an open access article distributed under the terms and conditions of the Creative Commons
Attribution license (http://creativecommons.org/licenses/by-nd/4.0/).

E. Schlickman et al.: Prototyping an Affordable and Mobile Sensor Network                   95

adverse health effects and with climate change, air pollution is becoming an increasingly
problematic issue (TIBBETTS 2015). Furthermore, in many parts of the world, air pollution is
not equally distributed across populations, leading to environmental justice concerns. In ad-
dition, recent evidence suggests that tactics employed by landscape architects can improve
air quality issues; this can happen at a master-planning scale with the careful siting of pro-
grams and site elements to minimize risk and this can also happen at a design scale with the
development and incorporation of green infrastructure (BARWISE & KUMAR 2020, HEWITT,
ASHWORTH & MACKENZIE 2020). Furthermore, air quality sensors are becoming more af-
fordable and user-friendly due to a changing paradigm in environmental monitoring that is
increasing the diversity of available sensor technology (SNYDER et al. 2013). Lastly, these
new systems for gathering site-level air quality data are helping to fill gaps in existing
knowledge, both spatially and temporally, as landscape architects have traditionally used
generalized and averaged air quality information at the local or regional scale.
The potential for employing sensor-based technology in landscape architecture has become
a growing topic of discussion in the field (CANTRELL & HOLZMAN 2015, LOKMAN 2017,
CANTRELL & MEKIES 2018). At the same time, while some academics and practitioners in
the field have experimented with hyperlocal air quality monitoring, the work has been pri-
marily speculative or limited (CHADDERTON 2020, ERVIN 2018). On the speculative end,
there are academic projects like Metabolic Forest (COX & DARDEN 2013) and The Digital &
The Wild (DUKE 2016), both of which explore the role of air quality sensing in creating
responsive feedback loops for design. On the implemented but limited end, there are projects
like Atmosphere InFormed (SPERANZA et al. 2016) and Greenscapes to Brownscapes: A
Study on Impacts to Contaminant Levels in Landscapes Adjacent to Highways (HARVEY &
ADAMS 2020), both of which are real-world air quality monitoring pilot studies but are not
yet scalable.
Additionally, there are a number of air quality monitoring precedents outside the field of
landscape architecture that might be of use for designers interested in collecting site-level
data. Two precedents of particular interest for this project come from PurpleAir and Aclima.
To start, PurpleAir is a widely used air quality sensor network platform that provides real-
time data on an online map. The sensors that are available for purchase through the company
are relatively small and affordable – $250 at the low end – and use laser particle counters to
detect PM2.5 levels in the air (PURPLEAIR 2020). Due to their stationary design, this network
is dependent on a dense and geographically-dispersed series of sensors to provide a holistic
overview of hyperlocal conditions. Aclima, on the other hand, has developed an air pollution
monitoring platform that pulls data from both stationary and roving sensors. For one project,
Aclima affixed air quality sensors onto Google Street View cars and collected data in West
Oakland, California. The data from this study showed small-scale variability in air quality,
even within individual city blocks, highlighting the potential benefits of a roving sensor sys-
tem over the interpolation of stationary sensors (APTE et al. 2017). The lab-grade sensors
used in this project were expensive and large; thus, the data collection platform cannot be
easily configured into a distributed system.
The study outlined in this paper sought to merge principles from both precedent projects
outlined above to prototype an affordable and roving sensor network that could be deployed
to the public to capture air quality variation at the block scale. The research team was driven
by three primary questions: 1) How can we design an air quality unit assembly process to be
open and accessible? 2) What general conclusions can be drawn from the spatial and temporal
96                                              Journal of Digital Landscape Architecture · 6-2021

variability in the data? And 3) How might these findings impact the site analysis portion of
the design process?

2     Methods
To address these questions, an interdisciplinary team of researchers formed with expertise in
landscape architecture, urban design, computer science and electrical engineering. Addition-
ally, experts in atmospheric pollutants and climate science were consulted. Our site for the
study was the main campus of the University of California, Davis, located in the Central
Valley of California, roughly 24 kilometers west of Sacramento. This region of California –
due to its topography, proximity to wildlands and wildfire, and agricultural land use – is a
unique landscape for studying particulate matter (PM2.5) levels. Furthermore, the city of
Davis has only one regulatory air quality monitor and 21 citizen science monitors; all of these
are stationary and only one is located on the main campus of the university.
To study the hyperlocal PM2.5 conditions of campus and to help augment existing air quality
data, the team aimed to create a mobile low-cost sensor network called “Aggie Air” to gather
hyperlocal and real-time data on PM 2.5 air pollution. The first step towards developing this
network was to design hardware for individual units using an Arduino platform. For the sen-
sor itself, the team selected the PMS5003 model by Plantower which “uses laser scattering
to radiate suspending particles in the air, then collects scattering light to obtain the curve of
scattering light change with time. The microprocessor calculates equivalent particle diameter
and the number of particles with different diameter per unit volume” (ADAFRUIT 2020). This
specific model was selected because recent studies indicate that it is suitable for studying
short-term spatially localized particulate matter concentrations (BULOT et al. 2019).
The alpha version of the unit featured the particulate matter concentration sensor, a GPS module
for logging locations, and an SD card module for saving data. After initial testing, the team
refined the prototype with a stripped-down beta version; the GPS module and SD card module
were removed and replaced with a Bluetooth-enabled mobile app to log locations and transfer
data to a cloud-based database (Fig. 1). This shift simplified the construction of the unit while
reducing the overall cost to under $100 per unit. Ultimately, a small fleet of twenty units were
built that could be affixed onto bikes and used across campus to collect data.

Fig. 1: Components of the final Beta unit
E. Schlickman et al.: Prototyping an Affordable and Mobile Sensor Network                  97

While the research team initially intended to recruit twenty undergraduates to collect data,
health and safety concerns associated with COVID-19 precluded this from happening. Thus,
one research member from the team collected data for the study. Over the course of 30 days,
this research member traced the same route across campus each day following four north-to-
south transects, logged air quality data, and mapped surface adjacencies along the route to
better understand context (Fig. 2). For the adjacency mapping, the researcher documented
the primary surface conditions twenty feet from the route on both sides of the bike. Further-
more, to better understand temporal patterns, the research member alternated the time of day
data was collected – 10 days focused on morning hours from 8-11am, 10 days focused on
afternoon hours from 1-4pm and 10 days focused on evening hours from 6-9pm.

Fig. 2: The data collection route and the surface adjacency mapping

During the rides, real-time PM2.5 data was expressed through a color-changing LED attached
to the unit, which functioned as an actuator, and was displayed on an app displaying a digital
map of campus that was searchable by date and time. Both the real-time and batched data
used the standard air quality index color code ranging from green (good) to maroon (hazard-
ous).
Lastly, for context, over the course of the 30-day data collection period, the prevailing wind
primarily came from the north at an average speed of 8kph, the average temperature was 14
degrees Celsius. Furthermore, while detailed traffic data for the city blocks around campus
and along State Route 113 and I-80 was unavailable for the data collection period, it is gen-
erally known that weekday mornings and Friday afternoons tend to have higher rates of traf-
fic congestion than other times of the week.

3     Findings
The first question that drove this study focused on how the air quality unit assembly and data
collection process might be designed to be open and accessible. To do this, the research team
developed a step-by-step instruction manual to lead people through the process in a straight-
forward manner. While the research team intended to recruit a number of undergraduate stu-
dents to test the manual, this was not possible due to health and safety concerns associated
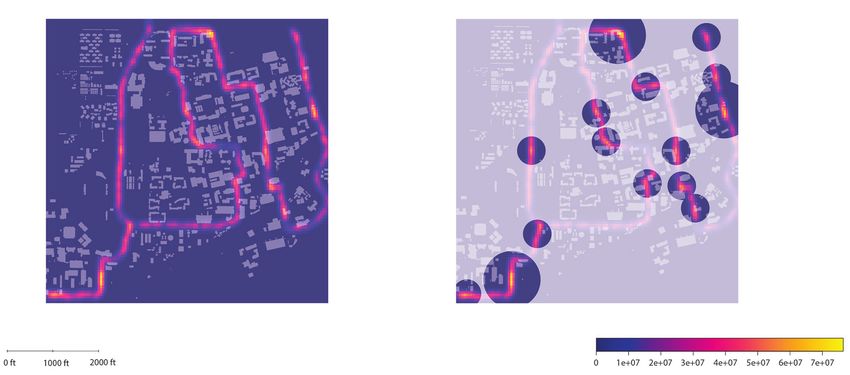
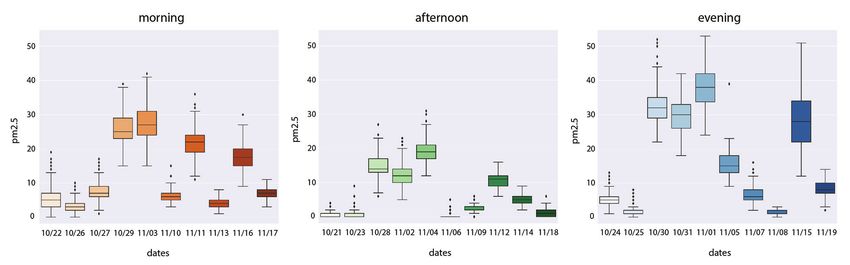
98                                              Journal of Digital Landscape Architecture · 6-2021

with COVID-19. That being said, three members of the interdisciplinary team tested the in-
structions for the Beta design, successfully built fully-functional units, and were able to col-
lect data across campus using the platform.
The second question that drove this study focused on what general conclusions could be
drawn from the spatial and temporal variability in the collected data. To unpack the spatial
variability in the study, the research team mapped the 90th percentile of PM2.5 levels at each
spatial location along the bike route for each of the thirty rides, created a color gradient from
purple (fewer instances) to yellow (more instances), and visually analyzed the resulting map.
Ultimately, 14 geographically-dispersed hotspots were identified based on areas that con-
tained yellow pixels. Of those 14, three hotspots with the most yellow pixels were selected
for further analysis (Fig. 3). These three areas appeared to share four general characteristics.
Each areas was located on the edge of campus, close to a vehicular intersection, on a dedi-
cated bike lane along an active road, and were adjacent to surface conditions comprised of
hardscape or built-up areas. To unpack the temporal variability in the study, the research team
grouped the morning, afternoon, and evening rides and plotted the PM2.5 levels (Fig. 4). The
resulting data showed elevated PM2.5 levels in the evening hours followed by elevated levels
in the morning hours. Rides done in the afternoon hours showed the lowest PM2.5 levels of
the three sets.

Fig. 3: Heat map showing 90th percentile PM2.5 areas for the 30 rides and the 14 hotspots

Fig. 4: PM2.5 levels grouped by morning, afternoon, and evening rides
E. Schlickman et al.: Prototyping an Affordable and Mobile Sensor Network                   99

The final question that drove this study considered how the spatial and temporal patterns
observed in the data might inform the site analysis process. For this, the research team spec-
ulated about how design and planning professionals might use this data in their work and
how the general conclusions from the study might raise questions about potential site inter-
ventions in the future. Based on the spatial findings from the study, two questions were de-
veloped for potential development sites located on the edge of campus, near active roads and
intersections, and next to significant hardscape or built-up zones: 1) Should areas like these
be reserved for certain types of campus programming to reduce long-term exposure to ele-
vated PM2.5 levels? And 2) Might these areas benefit from increased green infrastructural
interventions to reduce hyperlocal air quality issues? Based on the temporal findings from
the study, one question for future research was developed: Could responsive landscape sys-
tems be designed to offer sites more protection in the evening hours?

4     Discussion and Conclusion
The potential for using an affordable and mobile sensor network, like the one outlined in this
study, to better understand hyperlocal air quality patterns for planning and design is signifi-
cant. This kind of system could be employed by landscape architects for site analysis to un-
derstand hyperlocal environmental risks and could also be helpful post-construction for de-
signers to monitor the impact of built work on air quality levels in an effort to guide future
management protocols and site design. The individual units developed for the project are
significantly more affordable than off-the-shelf units and are easy enough to assemble with
the step-by-step manual. Furthermore, the research team was able to draw general spatial and
temporal conclusions from the pilot project data that might be helpful for designers.
Currently, though, the data collection process put forth in this study should only serve as a
tool that can be used to generate hypotheses for further testing and exploration. To move the
project forward towards specific design and planning recommendations, a number of study
limitations must be addressed. To begin, more people should be recruited to test the unit
assembly process to better understand the ease of construction. Secondly, more PM2.5 data
should be gathered. Multiple units should collect data simultaneously to cross-validate levels,
the route should be expanded to include more areas of campus, and the data collection process
should extend beyond 30 days to capture multiple seasons and conditions. Furthermore, more
time should be spent on analyzing site conditions to better understand potential correlations.
Lastly, the following technical issues with the system should be addressed. The campus-wide
WiFi network was often too weak and unreliable to use for data collection so the research
team resorted to using mobile phone hotspots. The mobile app had to be physically open for
the data to be logged and the app only functioned on Android devices. The mobile phone and
the unit had to be charged before every ride for a reliable power supply. Lastly, while this
was not an issue for the short-term study outlined in this paper, future longer-term studies
should consider the potential for data drift and should plan for sensor re-calibration.

Acknowledgements
The authors would like to acknowledge The Green Initiative Fund (TGIF) and the Depart-
ment of Human Ecology at UC Davis for financially supporting the project and Professor
100                                          Journal of Digital Landscape Architecture · 6-2021

Xin Liu of the Computer Science Department at UC Davis for facilitating the computer sci-
ence senior design project which made this collaborative effort possible.

References
ADAFRUIT (2020), PM2.5 Air Quality Sensor Overview.
   https://learn.adafruit.com/pm25-air-quality-sensor (03.03. 2021).
APTE et al. (2017), High-Resolution Air Pollution Mapping with Google Street View Cars:
   Exploiting Big Data. Environmental Science & Technology, 51 (12).
BARWISE, Y. & KUMAR P. (2020), Designing vegetation barriers for urban air pollution abate-
   ment: a practical review for appropriate plant species selection. NPJ Climate and Atmos-
   pheric Science, 3 (12).
CANTRELL, B. & HOLZMAN, J. (2015), Responsive landscapes: strategies for responsive tech-
   nologies in landscape architecture. Routledge, UK.
CANTRELL B. & MEKIES, A. (2018), Codify: Parametric and Computational Design in Land-
   scape Architecture. Routledge, UK.
CHADDERTON, C. (2020), Sensors in the Landscape: A Peatland Perspective. Journal of Dig-
   ital Landscape Architecture, 5-2020.
COX, S. & DARDEN, P. (2013), Metabolic Forest.
   http://responsivelandscapes.com/2013/12/10/metabolic-forest-2/ (03.03.2021).
DEMING, E. & SWAFFIELD, S. (2011), Landscape Architectural Research: Inquiry, Strategy,
   Design. John Wiley & Sons, New York.
DUKE, J. (2016), The Digital and The Wild.
   https://www.asla.org/2016studentawards/186884.html (03.03.2021).
ERVIN, S. M. (2018), Sensor-y Landscapes: Sensors and Sensations in Interactive Cybernetic
   Landscapes. Journal of Digital Landscape Architecture, 3-2018.
HARVEY, A. & ADAMS, A. (2020), Greenscapes to Brownscapes: A Study on Impacts to Con-
   taminant Levels in Landscapes Adjacent to Highways.
   https://www.lafoundation.org/news/2020/03/deb-mitchell-grant-winner (03.03.2021).
HEWITT, C. N., ASHWORTH, K. & MACKENZIE, A. R. (2020), Using green infrastructure to
   improve urban air quality. Ambio, 49.
LOKMAN, K. (2017), Cyborg landscapes: Choreographing resilient interactions between in-
   frastructure, ecology, and society. Journal of Landscape Architecture, 12 (1).
PURPLEAIR (2020), PurpleAir PA-II.
   www2.purpleair.com/collections/air-quality-sensors/products/purpleair-pa-ii
   (03.03.2021).
SNYDER E. et al. (2013), The Changing Paradigm of Air Pollution Monitoring. Environmen-
   tal Science & Technology, 47 (20).
SPERANZA, P., VIADER, M., MINGUILLON, M. & QUEROL, X. (2016), Atmosphere InFormed.
   https://www.speranzaarchitecture.com/air/xd56pt0ycbpoz27fh85i513t9sbc8b
   (03.03.2021).
TIBBETTS, J. H. (2015), Air quality and climate change: a delicate balance. Environmental
   Health Perspectives, 123.
You can also read