Simulation study on the effects of diffractive collisions on the prediction of the observables in ultra-high-energy cosmic-ray experiments
←
→
Page content transcription
If your browser does not render page correctly, please read the page content below
Prog. Theor. Exp. Phys. 2021, 033F01 (22 pages)
                                                                                                             DOI: 10.1093/ptep/ptab013

Simulation study on the effects of diffractive
collisions on the prediction of the observables in
ultra-high-energy cosmic-ray experiments
Ken Ohashi1,∗ , Hiroaki Menjo1 , Yoshitaka Itow1,2 , Takashi Sako3 , and Katsuaki Kasahara4
1
  Institute for Space-Earth Environmental Research, Nagoya University, Nagoya, Aichi 464-8601, Japan

                                                                                                                                                        Downloaded from https://academic.oup.com/ptep/article/2021/3/033F01/6132351 by guest on 23 October 2021
2
  Kobayashi-Maskawa Institute for the Origin of Particles and the Universe, Nagoya University, Nagoya, Aichi
464-8602
3
  Institute for Cosmic Ray Research, the University of Tokyo, Kashiwa, Chiba 277-8582, Japan
4
  College of Systems Engineering and Science, Shibaura Institute of Technology, Minuma-ku, Saitama 337-
8570, Japan
∗
  E-mail: ohashi.ken@isee.nagoya-u.ac.jp
Received May 26, 2020; Revised January 19, 2021; Accepted January 28, 2021; Published February 10, 2021

                     ...................................................................................................................
                     The mass composition of ultra-high-energy cosmic rays is important for understanding their ori-
                     gin. Owing to our limited knowledge of the hadronic interaction, the interpretations of the mass
                     composition from observations include several open problems, such as the inconsistent interpre-
                                                 μ
                     tations of Xmax  and Xmax    . Furthermore, a large difference between the predictions exists in the
                     hadronic interaction models. Diffractive collision is one of the proposed sources of the uncer-
                     tainty. In this paper, we discuss the effect of the detailed characteristics of diffractive collisions on
                     the observables of ultra-high-energy cosmic-ray experiments, focusing on three detailed charac-
                     teristics. These are the cross-sectional fractions of different collision types, the diffractive-mass
                     spectrum, and diffractive-mass-dependent particle production from the diffractive dissociation
                     system. We demonstrate that the current level of uncertainty in the cross-sectional fraction can
                                                                μ
                     affect Xmax  by 8.9 g/cm2 and Xmax          by 9.4 g/cm2 , whereas the other details of diffractive
                     collisions exhibit relatively minor effects.
                     ...................................................................................................................
                     Subject Index              F02, F03

1.      Introduction
The origin of ultra-high-energy cosmic rays (UHECRs) above 1018 eV is one of the most important
questions in astrophysics. The mass composition of these cosmic rays provides key information for
the understanding of their origin. UHECRs are observed by measurements of extended air showers.
Mass-sensitive observables, such as the depth of the maximum shower development Xmax , the depth
                                                        μ
of the maximum muon production in an air shower Xmax , and the number of muons at the ground
Nμ , are extracted from the air-shower data. The mass composition is estimated by comparing these
observables, measured by the Pierre Auger Observatory [1–5] and the Telescope Array Collabora-
tion [6], with predictions based on Monte Carlo (MC) simulations. However, owing to the limited
knowledge of hadronic interactions at such high energy, the interpretations of the mass composi-
                                                               μ
tion have several problems. Actually, the interpretation from Xmax predicts a heavier composition in
comparison with the prediction from Xmax [4], and the predictions on Nμ provide us with a much
smaller value than the experimental data [5]. The excess of Nμ in the observations with respect to
the MC predictions is widely recognized as the “muon excess problem”. Recent experimental results
related to this problem are summarized in Ref. [7]. In addition, there are significant differences

© The Author(s) 2021. Published by Oxford University Press on behalf of the Physical Society of Japan.
This is an Open Access article distributed under the terms of the Creative Commons Attribution License (http://creativecommons.org/licenses/by/4.0/),
which permits unrestricted reuse, distribution, and reproduction in any medium, provided the original work is properly cited.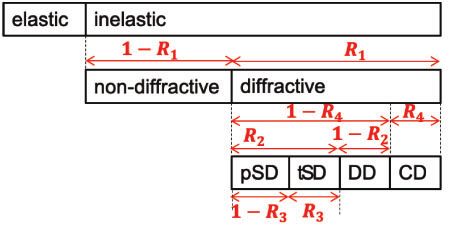
PTEP 2021, 033F01 K. Ohashi et al.
between predictions of air-shower observables calculated by different hadronic interaction models.
For example, the difference in the predictions of Xmax , which is the average of Xmax , of the models
for 1019 eV proton primary cosmic rays is 30 g/cm2 , whereas the size of the systematic uncertainties
in the experiments is 15 g/cm2 [1]. As the Xmax predictions from simulations become larger, the
interpretations of mass composition from the experimental data become heavier. Therefore, precise
understanding of and improvements in the treatment of hadronic interactions in simulations are
required.
In MC simulations, hadronic interaction models are used to simulate the interactions between a
hadron and an air nucleus. Since quantum chromodynamics is difficult to study by first-principles
calculations for low-momentum transfer processes, such calculations in the hadronic interaction
Downloaded from https://academic.oup.com/ptep/article/2021/3/033F01/6132351 by guest on 23 October 2021
models are described, being based on the phenomenology. Diffractive collisions are characterized by
low-momentum transfer. Therefore, there are large uncertainties in the predictions of these collisions.
Moreover, the energies of the particles produced in diffractive collisions are larger than those from
other collisions; thus these collisions may have a large impact on the air-shower development [8].
A few previous studies have discussed the effect of diffractive collisions on the UHECR observ-
ables. Under an extreme assumption, turning on and off the diffractive collisions in the air-shower
simulations, the difference in Xmax was estimated to be as large as 15 (14) g/cm2 for 1020 eV proton
(iron) primaries [9]. In another study, the effect of the different modeling of the diffractive collisions
was discussed by changing the differential cross-section of the diffractive mass in SIBYLL 2.3c over
whole air showers of 1019 eV proton primaries with a 67◦ incident zenith angle (F. Riehn, private
communication). The effect turned out to be +5.0 g/cm2 for Xmax and −5% for the average number
of muons at the depth, X = 2240 g/cm2 . Even though these analyses indicate that the effects of the
diffractive collisions are not negligible, only the total effect and the effect of the differential cross-
section of diffractive mass in one model are discussed in the previous works. The effects of different
types of diffractive collisions, such as single, double, and central diffractions, and the effect of the
diffractive-mass distributions and particle production from diffractive dissociation remain unclear.
In this study, to understand the impact of the detailed characteristics of diffractive collisions on
the UHECR mass composition analyses, the effect of these characteristics on predicting the UHECR
observables using an air-shower simulation package, CONEX v6.40 [10], was studied. In particular,
μ
the composition-sensitive observables, Xmax and Xmax , were focused on. For this purpose, several
characteristics of the diffractive collision processes were parameterized. By changing these param-
eters within the variations in the different models, possible effects on the observables are discussed.
The modifications were applied only for the first interaction, in case A, and for all interactions in
air showers, in case B. This case B modification is used for a study of the effects of cross-section
fractions in Sect. 4.2.2. The case A modification is used for all studies including the effects of cross-
section fractions and the modeling of diffractive collisions in Sects. 4.2.1 and 4.3. The details of the
diffractive collisions and the simulation set-up are discussed in Sects. 2 and 3, respectively. Basic
profiles of longitudinal air-shower developments are also discussed in Sect. 3. Subsequently, we
μ
discuss the effects on the longitudinal properties of air showers, Xmax and Xmax , in Sect. 4. Then,
the effects on the fluctuation of Xmax are discussed in Sect. 5. The conclusion is provided in Sect. 6.
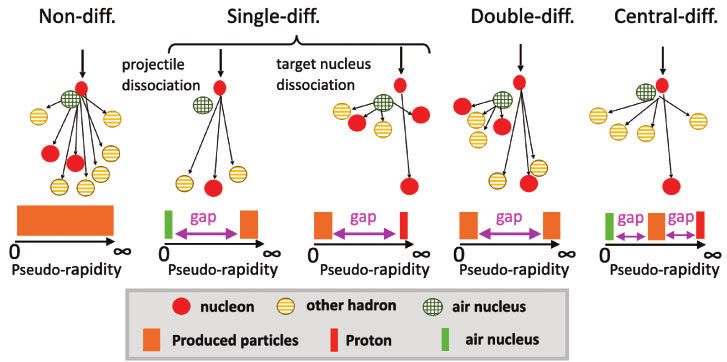
2. Diffractive collisions
Diffractive collisions are explained using the exchange of a virtual particle without any quantum
numbers, called a pomeron. The mechanism of diffractive collisions, including particle production
from the diffractive dissociation system, is not well understood yet. Experimentally, these collisions
2/22PTEP 2021, 033F01 K. Ohashi et al.
Fig. 1. Feynman diagrams of (a) single diffractive (SD) collisions, (b) double diffractive (DD) collisions, and
(c) central diffractive (CD) collisions. IP represents a pomeron.
Downloaded from https://academic.oup.com/ptep/article/2021/3/033F01/6132351 by guest on 23 October 2021
Fig. 2. Schematic of the collision between a cosmic-ray proton and an air nucleus for each collision type.
Illustrations of rapidity distributions of produced particles for each collision type are also shown at the bottom.
are characterized by a rapidity gap of the produced particles from the dissociation of the incident
particles [11]. Because the energy of the produced particles in the diffractive collisions is expected
to be higher than in other types of collisions, the diffractive collision is expected to be more relevant
to the air-shower observables [8]. There are three types of diffractive collisions: single diffractive
(SD) collisions, double diffractive (DD) collisions, and central diffractive (CD) collisions. One of the
initial particles dissociates, whereas the other is intact in the SD collisions. Both the initial particles
dissociate in the DD collisions. The CD collisions are diffractive collisions with particle production
from collisions between two or more pomerons without dissociation of the initial particles, and
these collisions typically have two rapidity gaps. Figure 1 displays the Feynman diagrams of these
collisions. In this study, inelastic collisions excluding diffractive collisions are called non-diffractive
(ND) collisions. SD collisions with projectile cosmic-ray dissociation and those with target air
nucleus dissociation induce different effects on the air-shower development, as displayed in Fig. 2.
In this paper, the former collision type is called projectile single diffractive (pSD) collision, whereas
the latter is called target single diffractive (tSD) collision.
In single and double diffractive collisions, an incident particle dissociates to particles and the
modeling of this dissociation process has large uncertainty. In hadronic interaction models, this
dissociation process is modeled using the diffractive mass MX ; an incident particle is excited by the
pomeron exchange and particles are produced from the dissociation of the excited state, e.g., the
decay of a resonance in the low diffractive-mass region or string fragmentation in the high diffractive-
mass region. The modeling of the diffractive collision varies in hadronic interaction models, and they
3/22PTEP 2021, 033F01 K. Ohashi et al.
are summarized in Ref. [11]. MX can be calculated using the momentum of the produced particles
in a dissociation system as
n 2
MX2 = pi , (1)
i
where pi and n are the four-momentum of the ith particle and the number of particles in the dissociation
system, respectively. The modeling of the diffractive collisions can be divided into two parts: the
dσ
differential cross-section of diffractive mass, dM X
, and treatment of particle production from the
Downloaded from https://academic.oup.com/ptep/article/2021/3/033F01/6132351 by guest on 23 October 2021
dissociation of the incident particle for each event. Hereafter, we call the latter particle production
from diffractive dissociation. This particle production from diffractive dissociation depends on the
diffractive mass. The modeling of diffractive collisions has two characteristics and there are four
types of diffractive collision. Therefore, there are three characteristics in diffractive collisions:
◦ cross-section of each collision type,
◦ diffractive-mass spectrum, and
◦ particle production from diffractive dissociation.
Because diffractive collisions are characterized by low multiplicity and high elasticity, air-shower
development shifts deep in the atmosphere [8]. The collision types in the diffractive collisions also
affect the UHECR observables as follows: If the first interaction of an air shower is a pSD or a DD
collision, the projectile particle dissociates and produces several high-energy particles. However, if
the first interaction is produced by a tSD or a CD collision, the projectile particle is intact; therefore,
Xmax is predicted to become approximately one interaction length deep. The modeling of the
diffractive collisions is also important. The diffractive collisions with smaller MX are characterized
by using a smaller number and higher energy of produced particles, which results in large Xmax .
Furthermore, there are differences in particle production of the diffractive dissociation between the
models, and these differences in the distribution of MX affect the uncertainty of the energy and the
number of produced particles in the diffractive collisions.
Recently, the cross-sections of diffractive collisions were measured by TOTEM [12,13],
ATLAS [14–16], CMS [17], and ALICE [18] at the Large Hadron Collider (LHC) at CERN. Since
most of the particles are produced only in the very forward regions in the low diffractive-mass
cases, measurements of low diffractive-mass events with MX < 3.4 GeV are limited. Therefore
there are large uncertainties in the cross-section. Since the total and elastic cross-sections are pre-
cisely measured using Roman Pots by TOTEM [19,20] and ATLAS [21], the uncertainty in the
inelastic cross-section is very small. However, the relative cross-sections between the collision types
are equally important as the absolute value of the total and inelastic cross-sections. Moreover, par-
ticle production from diffractive dissociation in the diffractive collisions are not well constrained
by the collider experiments. Thus, these three quantities, such as cross-section of each collision
type, diffractive-mass spectrum, and particle production from diffractive dissociation, have large
uncertainties.
Large differences in the predictions of the diffractive collisions are found in the latest hadronic
interaction models. Figure 3 displays the cross-sectional fraction in the proton–air collisions for
1019 eV and 1017 eV projectile protons. The difference of the cross-sectional fractions of the ND
collisions between the hadronic interaction models is approximately 10%, and SIBYLL 2.3c [22,23]
4/22PTEP 2021, 033F01 K. Ohashi et al.
collision collision
Downloaded from https://academic.oup.com/ptep/article/2021/3/033F01/6132351 by guest on 23 October 2021
Fig. 3. Cross-sectional fractions of the ND, pSD, tSD, DD, and CD collisions for (a) 1019 eV proton primaries
and (b) 1017 eV proton primaries.
Fig. 4. The probability of the diffractive mass (diffractive-mass spectra) of the pSD collisions for three hadronic
interaction models: EPOS-LHC (magenta solid line), QGSJET II-04 (blue dotted line), and SIBYLL 2.3c (green
dashed line). The projectile particles are (a) 1019 eV protons and (b) 1017 eV protons, and the target particles
are air nuclei at rest. Approximately 40 000 events are simulated for each case using CONEX v6.40 [10].
and EPOS-LHC [24] present the largest and smallest values, respectively. The difference of the
cross-sectional fractions between models is relatively larger for the DD and CD collisions than that
for the pSD and tSD collisions. Figure 4 displays the diffractive-mass spectra of the proton–air
√
collisions for 1019 eV and 1017 eV projectile protons. Here, ξ is defined as ξ = MX2 /s, where s
is the center-of-mass energy of the proton–air collision. The logarithm of ξ , log10 (ξ ), is used in
Fig. 4 and following figures. Large differences can be noted between SIBYLL 2.3c and the other
models, particularly in the lowest diffractive-mass regions. QGSJET II-04 [25] displays a strong
peak in the low diffractive-mass region, whereas SIBYLL 2.3c does not present diffractive-mass
dependences and EPOS-LHC has a bimodal spectrum. Even though the latest hadronic interaction
models are updated using the experimental results from the LHC, they do not reproduce the results
of the measurements of the diffractive collisions from the LHC [26].
In the following sections, to understand the effect of these quantities in predicting the observables,
the effects of the cross-sectional fraction, diffractive-mass spectrum, and particle production from
diffractive dissociation on the UHECR observables are discussed. The focus is on the large differences
in the cross-sectional fractions of the models and in the diffractive-mass spectra of SIBYLL 2.3c
and the other models.
5/22PTEP 2021, 033F01 K. Ohashi et al.
3. Air-shower simulations
3.1. Simulation set-up
Air-shower events were simulated using CONEX v6.40 [10] with three hadronic interaction models,
EPOS-LHC, QGSJET II-04, and SIBYLL 2.3c. UrQMD [27,28] was used for the collisions with
incident particle energy less than 80 GeV. Primary protons of 1019 and 1017 eV with an incident zenith
angle 60◦ were assumed. The following three types of modifications of CONEX were applied: (1)
the information on the collision type at the first interaction was additionally included in the output of
each shower event. For the definition of the collision type, we used the collision information obtained
from each hadronic interaction model, similar to a previous study [9]. (2) To simulate the events
Downloaded from https://academic.oup.com/ptep/article/2021/3/033F01/6132351 by guest on 23 October 2021
used in Sect. 4.2.2, the fractions of diffractive collisions were modified for the first interactions and
following interactions of secondary particles. (3) For the study of the diffractive-mass dependence,
as described in Sect. 4.3, the diffractive mass at the first interaction was calculated for each air shower
from the momenta of the particles in the dissociation system. For these air-shower events used in
(3), the collision type at the first interaction was fixed to the pSD collision for the simplicity of the
calculation of the diffractive mass. For some models, an intact atmospheric nucleus is handled as
nucleons after the collision even for the pSD collision. To separate these nucleons and the proton
dissociation system, a rapidity threshold was used, which is set as 1.5 in the laboratory frame, and
particles with rapidity larger than 1.5 were used for the calculation of the diffractive mass. The number
of produced events was 40 000 for each case. Although the calculation is effective for most of the
events, less than 0.5% of the events have masses smaller than that of a proton, which is non-physical,
owing to the mis-separation of the dissociation system in the calculations. These non-physical events
were not used in the analysis.
CONEX is sufficiently fast to simulate a sufficient number of events because it employs the 1D
cascade equation. To confirm the predictions by CONEX, Xmax calculated by CONEX was com-
pared to the result by a 3D air-shower simulation package, COSMOS 8.035 [29], for a 1017 eV proton
primary case. To reduce the time-consuming calculation, a 1D analytical calculation is conducted for
the calculations of electromagnetic cascade showers in COSMOS. In this comparison, QGSJET II-04
was used as a high-energy interaction model, and the zenith angle was 0◦ . UrQMD was used for the
low-energy interactions below 80 GeV in CONEX, whereas DPMJET III [30] and PHITS [31] were
used in COSMOS for the interactions at 2–80 GeV and less than 2 GeV, respectively. In COSMOS,
the number of electrons was calculated every 25 g/cm2 , and Xmax was calculated by fitting them to
the Gaisser–Hillas function. The number of simulated air showers was 3000 for each package. The
result of Xmax was 683.4 ± 1.3 g/cm2 for CONEX and 680.9 ± 1.3 g/cm2 for COSMOS. The
1D cascade equation in CONEX presents a reasonable agreement with the 3D cascade simulation
by COSMOS.
3.2. Longitudinal shower profiles and collision type
μ
Before discussing Xmax and Xmax , the basic relationship between the diffractive collision type and the
longitudinal air-shower profile is discussed. To understand the relationship, the events are categorized
by the collision type at the first interaction of the air shower, and the mean longitudinal shower profile
is calculated for each category. The profiles of the electrons plus positrons (electrons hereafter unless
mentioned) in 1019 eV showers with a zenith angle of 60◦ using EPOS-LHC are displayed in Fig. 5(a).
The peak position of the diffractive collision categories is 40–50 g/cm2 deeper than that of the ND
collision category, whereas the differences in categories of the diffractive collision are small.
6/22PTEP 2021, 033F01 K. Ohashi et al.
The shower profiles of the muons and muon production using EPOS-LHC are presented in Figs. 5(b)
and (c), respectively.1 Similar to the electron profiles, the peak positions for the diffractive collision
categories is 40–50 g/cm2 deeper than that by the ND. Additionally, the categories of the pSD and
DD collisions exhibit a smaller peak height than the other categories. For depth X > 1100 g/cm2 ,
the number of muons of the tSD and CD collision categories is the largest among the five categories,
whereas those of the pSD and DD collision categories are the smallest. This is because projectile
cosmic rays are intact for the tSD and CD collisions while the projectile cosmic rays dissociate and
low-multiplicity collisions are expected for the pSD and DD collisions. Moreover, the difference in
the number of muons of the categories depends on the depth, and it decreases in a deeper atmosphere.
Diffractive collisions are characterized by high elasticity, and that make the shower developments
Downloaded from https://academic.oup.com/ptep/article/2021/3/033F01/6132351 by guest on 23 October 2021
deep. For the pSD and DD collision categories, the peak height is small while the shower devel-
opments are deeper than for the ND collision category. Therefore the differences between the ND
and pSD collision categories in a deeper atmosphere are small. At X = 2000 g/cm2 , the differ-
ences between the ND collision category and the diffractive collision categories are less than 3%.
Considering small fractions of diffractive collisions, the effects of diffractive collisions at the first
interaction are expected to be less than 0.3%. It is noted that diffractive collisions of interactions of
secondary particles is not considered although they also affect the number of muons.
These mean longitudinal profiles are directly related to the observable variables in the air-shower
experiments. The peak depth of the electron profile is defined by Xmax , and the peak depth of the
μ
muon production point is defined by Xmax . It is found that diffractive collisions at the first interaction
μ
make Xmax and Xmax larger. Another observable is the number of muons on the ground, Nμ . Since
the effect of diffractive collisions on the number of muons at X = 2000 g/cm2 , which is around the
μ
ground for inclined showers, is expected to be small, we only focus on Xmax and Xmax . Quantitative
μ
discussions of the model dependences and the effects on Xmax and Xmax are given in Sect. 4,
focusing on the detailed characteristics of diffractive collisions, such as the cross-section of each
collision type, the diffractive-mass spectrum, and particle production from diffractive dissociation.
The effects on the fluctuation of Xmax are discussed in Sect. 5.
4. Effect of diffractive collisions on Xmax and Xμmax
μ
4.1. Collision type and its effect on Xmax , Xmax
μ
Xmax and Xmax are calculated for each event category at the first interaction, as displayed in
Figs. 6(a) and (b), respectively. We can find differences between predictions of collision type cate-
gories even in one model, and the prediction of the tSD collision category shows the largest among
the categories. This feature means that the collision type at the first interaction affects Xmax and
μ
Xmax as follows: if the cross-sectional fraction of the tSD collision becomes larger, the average of
the Xmax prediction also becomes larger. Moreover, even in the same category, there are differences
in the predictions of the models. In this section, we discuss the effects of cross-sectional fraction
between collision types and the effects of the modeling of diffractive collisions.
μ
In Figs. 6(a) and (b), SIBYLL 2.3c displays large differences of Xmax and Xmax between the pSD
and tSD collision categories, which is 20–30 g/cm2 . Moreover, the size of the difference between
the pSD and tSD collision categories is as large as the difference between the ND and pSD collision
categories. For EPOS-LHC, the differences between the pSD, tSD, and DD collision categories are
1
Some structures can be found around the peak of muon production profiles. The hadronic interaction model
was changed at 80 GeV in CONEX and it can create these structures.
7/22PTEP 2021, 033F01 K. Ohashi et al.
Downloaded from https://academic.oup.com/ptep/article/2021/3/033F01/6132351 by guest on 23 October 2021
Fig. 5. Profiles of the average of (a) the number of electrons and positrons, (b) the number of muons, and
(c) the amount of muon production in a 1019 eV proton shower with a zenith angle of 60◦ as a function of
the atmospheric depth, X . Different lines represent the profiles categorized by the collision type at the first
interaction. EPOS-LHC is used for the hadronic interaction model. Electrons and positrons with energy more
than 0.01 GeV and muons with energy more than 1 GeV are counted.
8/22PTEP 2021, 033F01 K. Ohashi et al.
Downloaded from https://academic.oup.com/ptep/article/2021/3/033F01/6132351 by guest on 23 October 2021
collision collision
μ
Fig. 6. (a) Xmax and (b) Xmax categorized by collision type at the first interaction and the average. The energy
of the primary proton is 10 eV (open symbols) and 1019 eV (filled symbols), and EPOS-LHC (magenta),
17
QGSJET II-04 (blue), and SIBYLL 2.3c (green) are used for the interaction model.
much smaller than those between the pSD and ND collision categories. These features suggest that
the cross-sectional fraction of the diffractive collisions to the ND collisions is more important than
that of the pSD and tSD collisions for the EPOS-LHC cases. In comparison, the cross-sectional
μ
fractions of the pSD and tSD collision categories may affect Xmax and Xmax in the SIBYLL 2.3c
case. Details of the effects of the cross-sectional fractions are discussed in the following section.
Focusing on the values in each category of the collision type, the size of the difference between
SIBYLL 2.3c and the other models varies with the collision categories, while the difference between
QGSJET II-04 and EPOS-LHC is found to be mostly independent of the collision category. For
μ
example, the differences in Xmax between SIBYLL 2.3c and EPOS-LHC for the pSD and the DD
collision categories are larger than those for the ND and tSD collision categories. The projectile
protons (cosmic rays) dissociate only for the pSD and the DD collisions; therefore, the diffractive-
mass spectrum affects the shower development in the pSD and DD cases only. Thus, this could be
related to a large difference of the diffractive-mass spectrum between SIBYLL 2.3c and the other
models. It is important to examine the effects of the modeling of the diffractive collisions, including
μ
the effect of the diffractive-mass spectrum on Xmax and Xmax .
μ
4.2. Effect of cross-sectional fractions of the collision types on Xmax and Xmax
The contribution of the cross-sectional fractions is examined from two points of view. One is the
effect of the first interaction in the air showers focusing on all the cross-sectional fractions. The other
is the effect including the interactions of secondary particles over the whole air shower, focusing on
one cross-sectional fraction that displays the largest effect at the first interaction.
4.2.1. Effect of first interaction
μ
The effects of the cross-sectional fractions at the first interaction are studied using Xmax and Xmax ,
average
as introduced in Fig. 6. The average of Xmax , Xmax can be calculated from the Xmax of each
category shown in Fig. 6 considering the cross-section fractions of each category as follows:
average
Xmax = f i Xmax
i
, (2)
i
9/22PTEP 2021, 033F01 K. Ohashi et al.
Fig. 7. Schematic view of the four ratios R1 , R2 , R3 , and R4
Downloaded from https://academic.oup.com/ptep/article/2021/3/033F01/6132351 by guest on 23 October 2021
μ,average
where f i is the cross-sectional fraction of the ith collision type. Xmax can be calculated sim-
average
ilarly as above. We can easily estimate the effects of the cross-sectional fraction on Xmax and
μ, average average
Xmax by changing f i artificially in Eq. 2. Hereafter, the expected value of Xmax after artifi-
cial modification of f i is referred to as Xmaxmodified . Using this method, the effects of the cross-sectional
fractions can be studied without repeating the time-consuming MC simulations. For example, if the
cross-sectional fraction of the tSD collisions is increased while the fraction of the ND collisions
is reduced, Xmax modified becomes larger. Instead of directly changing f i , the four ratios of the cross-
sections, R1 , R2 , R3 , and R4 , are introduced. As illustrated in Fig. 7, the ratios are defined between
0 and 1. R1 is the ratio of all the diffractive collisions to the inelastic collisions. R2 is the ratio of
the SD (pSD + tSD) collisions to the sum of the SD and DD collisions. R3 is the ratio of the tSD
collisions to all the SD collisions. R4 is the ratio of the CD collisions to all the diffractive collisions.
The cross-sectional fractions, f i , can be calculated from these four ratios as
f ND = 1 − R1 ,
f pSD = R1 (1 − R4 )R2 (1 − R3 ),
f tSD = R1 (1 − R4 )R2 R3 ,
f DD = R1 (1 − R4 )(1 − R2 ), and
f CD = R1 R4 . (3)
μ,modified
modified and X
Xmax max are calculated using the cross-sectional fractions and Eq. 2 by changing
the ratios.
modified and X μ,modified dependences for the ratios R , R , and R are displayed in Figs. 8
The Xmax max 1 2 3
μ,modified original
and 9. Upper panels display Xmax modified and Xmax (lines) and the original predictions Xmax
μ,original
and Xmax (black circles) by three interaction models for 1019 eV proton primaries. The middle
plots are the same as the upper plots except for the 1017 eV proton primaries. Magenta (solid
and dash–dotted), blue (dashed and dash–double-dotted), and green (dotted and dash–triple-dotted)
lines display the results of the EPOS-LHC, QGSJET II-04, and SIBYLL 2.3c models, respectively.
The error bars of these plots display the statistical errors of the MC simulations. The bottom plots
present the differences in Xmax modified and X μ,modified from the original predictions, where X
max max
is defined as
original
Xmax = Xmax
modified
− Xmax . (4)
10/22PTEP 2021, 033F01 K. Ohashi et al.
Downloaded from https://academic.oup.com/ptep/article/2021/3/033F01/6132351 by guest on 23 October 2021
Fig. 8. The Xmaxmodified
dependence for the ratios (a) R1 , (b) R2 , and (c) R3 . Hatched regions display the sta-
tistical errors. The upper and middle panels present Xmax modified
for the 1019 eV and 1017 eV proton primaries,
respectively. Black circles denote the predictions with the original R of the model. The bottom panel displays
Xmax . Magenta solid lines denote the results of EPOS-LHC for 1019 eV (1017 eV), the blue dashed lines
represent the results of QGSJET II-04 for 1019 eV (1017 eV), and the green dotted lines display the results of
SIBYLL 2.3c for 1019 eV (1017 eV). In the bottom plots, the solid (dashed) lines present the results for 1019 eV
(1017 eV), and the statistical errors of EPOS-LHC for 1019 eV only are displayed.
11/22PTEP 2021, 033F01 K. Ohashi et al.
Downloaded from https://academic.oup.com/ptep/article/2021/3/033F01/6132351 by guest on 23 October 2021
μ,modified
Fig. 9. The Xmax dependence on the ratios R1 , R2 , and R3 .
In the bottom plots, the error bars for the 1019 eV EPOS-LHC case only are drawn for visibility. The
calculation for R4 is not performed, because SIBYLL 2.3c does not include CD collisions.
Based on the upper plot of Fig. 8(a), the original R1 , which is equal to the cross-section fraction
of diffractive collisions in inelastic collisions, ranges from 0.074 (SIBYLL 2.3c) to 0.182 (EPOS-
LHC), which is regarded as the model uncertainty of R1 in this analysis. When R1 is changed in this
μ
range, Xmax changes by 3.7 g/cm2 for SIBYLL 2.3c and 5.0 g/cm2 for QGSJET II-04, and Xmax
changes by 3.4 g/cm2 for SIBYLL 2.3c and 4.8 g/cm2 for QGSJET II-04 for 1019 eV. However,
12/22PTEP 2021, 033F01 K. Ohashi et al.
the shifts for the change of the ratios of R2 and R3 within the model uncertainties are smaller than
0.4 g/cm2 , which is comparable to the statistical errors. These results signify that the cross-section
ratio of the diffractive collisions to the inelastic collisions R1 has a dominant effect on Xmax and
μ
Xmax . On the other hand, the cross-section ratios of the diffractive collision types, i.e., R2 and R3 ,
μ
are not sensitive to Xmax and Xmax . The ratio dependences of 1017 eV for R1 are similar to those
of 1019 eV.
4.2.2. Effect of interactions over a whole air shower
The effects of the interactions over a whole air shower including interactions of secondary particles
μ
on Xmax and Xmax are discussed in this section, focusing on the cross-sectional ratio of the
Downloaded from https://academic.oup.com/ptep/article/2021/3/033F01/6132351 by guest on 23 October 2021
diffractive collisions to inelastic collisions R1 . This exhibits the largest effect at the first interaction,
as presented in Sect. 4.2.1. In this study, the ratio for collisions with projectile energy larger than
1015 eV was modified. This threshold energy was chosen in a previous study using CONEX [8].
Before the modification, we defined the reference R1 ratios, RRef 1 , which are used for the reference
Ref
of the ratio in the modification procedure, as follows: R1 as a function of energy is estimated
from the simulated ratios of EPOS-LHC and SIBYLL 2.3c, as displayed in Fig. 10 by fitting with
a function defined as a log10 E + b, where a and b are free parameters. The magenta (green) solid
and dashed lines are the fitting results of the ratio for proton–nitrogen and π + –nitrogen collisions
simulated by EPOS-LHC (SIBYLL 2.3c), respectively. The fitting results of the proton–nitrogen
(π + –nitrogen) collisions are used as RRef1 for baryon–air nucleus (meson–air nucleus) collisions at
a given energy in an air shower. Hereby, the modification with RRef 1 taken from the EPOS-LHC
and SIBYLL 2.3c results is called the EPOS-based R1 case and the SIBYLL-based RRef
Ref
1 case,
respectively. Then, cross-sectional fractions of collision types are modified for each collisions in an
air shower. The procedure for this modification is described below:
(1) For every collision with a projectile energy larger than 1015 eV in an air shower, a collision type
is selected before the collision generation by following the cross-sectional fraction, fi , using
RRef
1 .
(2) A collision is generated according to each model, and the collision type of the produced collision
is compared to the one selected in (1). If the two types are not the same, another collision is
generated repeatedly for this collision until those two types become the same. If the two types
are the same, the produced collision is accepted and the simulation of the air shower proceeds.
The results of Xmax with this modification are summarized in Table 1. The difference between the
value of EPOS-LHC and the one obtained with the modification using EPOS-based RRef 1 accounts
for the systematic uncertainty of the method, and the size of the difference is 2.0 g/cm2 . The
difference for the SIBYLL 2.3c case is 0.9 g/cm2 . This systematic uncertainty is due to the difference
between the original prediction of R1 and RRef1 , which is defined by fitting. We discuss the impact
of the change in R1 from the original prediction to the reference one. The effect of the ratio R1 is
8.9±0.4 g/cm2 at the maximum for the EPOS-LHC-based case and 4.2±0.4 g/cm2 at the maximum
for the SIBYLL 2.3c-based case, and they are 1–2 times as large in comparison with the value
estimated from the cross-section ratio at the first interaction, 3.7–5.0 g/cm2 . From the comparison
between the estimation at the first interactions and the estimation with modification for a whole air
shower, it is suggested that the effects of the ratios at the first interaction and the interactions of
secondary particles are equally important for the Xmax predictions.
13/22PTEP 2021, 033F01 K. Ohashi et al.
Downloaded from https://academic.oup.com/ptep/article/2021/3/033F01/6132351 by guest on 23 October 2021
Fig. 10. Energy dependences of the cross-section ratio, R1 . The ratios of the proton–nitrogen collisions (filled
markers) and π + –nitrogen collisions (open markers) for three hadronic interaction models using CRMC v1.7
[32] are displayed. Straight lines are the fitted results of the cross-section ratios with a log10 E +b. The magenta
solid (dashed) line is the fitted result for the proton (π + )–nitrogen collisions by EPOS-LHC, and the green
solid (dashed) line is the fitted result for the proton (π + ) nitrogen collisions by SIBYLL 2.3c.
There is another important point. The maximum differences in the Xmax predictions between
the models with this modification are 31.9±0.5 g/cm2 for the EPOS-LHC-based case and
32.0±0.4 g/cm2 for the SIBYLL 2.3c-based case, as displayed in the bottom row of Table 1. More-
over, they are larger than the difference without any modification: 27.4±0.4 g/cm2 . This means that
even if the cross-section ratio, R1 , is fixed to the same value in the three models, the difference in
the prediction Xmax between the models becomes large. This result may be caused by the other
sources of the differences in Xmax predictions; in the original models, several sources contribute
to the difference of Xmax predictions and the differences of R1 in models reduce the difference of
Xmax predictions by chance. The cross-section ratios affect the mean value of Xmax predictions;
however, they cannot solve the differences in the Xmax predictions between models.
μ
Xmax can be similarly discussed based on Table 2. The effects of the cross-section ratio, R1 , are
9.4±0.4 g/cm2 for the EPOS-LHC-based case and 4.4±0.4 g/cm2 for the SIBYLL 2.3c-based case
μ
at maximum. The differences in the Xmax predictions between the models, with this modification,
are smaller by 5.2±0.6 g/cm2 and 0.4±0.6 g/cm2 than those of the original predictions for the
EPOS-LHC-based case and the SIBYLL 2.3c-based case, respectively. The cross-section ratios
μ
affect the mean value of the Xmax predictions; however, they cannot solve the differences in the
μ
Xmax predictions of the models.
μ
4.3. Effects of diffractive collision modeling on Xmax and Xmax
As we discussed in Sect. 4.1, there are differences between the predictions of each model with the
same collision type at the first interaction. These differences between models vary with the collision
μ
type. This suggests that the modeling of the diffractive collision affects Xmax and Xmax . The
remaining characteristics, the diffractive-mass spectrum and the particle production of diffractive
μ
dissociation, may affect Xmax and Xmax . If the fraction of the low diffractive-mass events increases
for the pSD collisions, the energies of particles become higher; thus the predictions of Xmax and
μ pSD μ,pSD
Xmax for the pSD collision category, Xmax and Xmax , become larger. Firstly, to understand
pSD μ, pSD
the overview of the effect of the modeling, the diffractive-mass dependences of Xmax and Xmax
14/22PTEP 2021, 033F01 K. Ohashi et al.
Table 1. Results of Xmax with cross-section ratio modifications over the whole air shower. The reference
ratio, RRef
1 , for the modification is set by fitting the ratio of the predictions by EPOS-LHC or SIBYLL 2.3c
with energy above 1015 eV.
Xmax [g/cm2 ]
original model with modification
interaction EPOS-based RRef 1 SIBYLL-based RRef
1
model difference difference
EPOS-LHC 807.5±0.3 809.5±0.3 2.0±0.4 803.3±0.3 −4.2±0.4
QGSJET II-04 792.2±0.3 796.6±0.3 4.4±0.4 788.5±0.3 −3.7±0.4
SIBYLL 2.3c 819.6±0.3 828.5±0.3 8.9±0.4 820.5±0.3 0.9±0.4
maximum difference between models 27.4±0.4 31.9±0.5 32.0±0.4
Downloaded from https://academic.oup.com/ptep/article/2021/3/033F01/6132351 by guest on 23 October 2021
μ
Table 2. Results of Xmax with cross-sectional fraction modifications over the whole air shower. RRef
1 for the
modification is set by fitting the ratio of the predictions by EPOS-LHC or SIBYLL 2.3c with energy above
1015 eV.
μ
Xmax [g/cm2 ]
original model with modification
interaction EPOS-based RRef 1 SIBYLL-based case RRef
1
model difference difference
EPOS-LHC 590.5±0.3 591.4±0.3 0.9±0.4 586.1±0.3 −4.4±0.4
QGSJET II-04 552.5±0.3 558.6±0.3 6.1±0.4 548.5±0.3 −4.0±0.4
SIBYLL 2.3c 579.6±0.3 589.0±0.3 9.4±0.4 580.6±0.3 1.0±0.4
maximum difference between models 38.0±0.4 32.8±0.4 37.6±0.4
pSD μ, pSD
are discussed. Figures 11(a) and 12(a) display the diffractive-mass-dependent Xmax and Xmax ,
respectively, for 1019 eV incident protons. The differences between models in Figs. 11(a) and 12(a)
represent the differences with the same diffractive-mass pSD collisions at the first interactions for
each model; thus the differences originate from particle production from diffractive dissociation and
pSD μ, pSD
in interactions of secondary particles. The dependences of Xmax and Xmax are similar; they
become larger as the diffractive mass becomes smaller, and the diffractive-mass dependences are
small for log10 (ξ ) > −6.
pSD μ, pSD
The difference between the maximum and the minimum Xmax (Xmax ) in the diffractive-
mass range is less than 30 g/cm2 in each model. This suggests that even if we assume an extreme
pSD μ, pSD
diffractive-mass spectrum, e.g., a delta function, Xmax and Xmax are only affected by 30 g/cm2 .
Since projectile protons dissociate only for the pSD and DD collisions, the diffractive-mass spectrum
only affects the pSD and DD collisions. In this section, we first discuss the effect on predictions of
pSD μ,pSD μ
Xmax and Xmax , then the effects on Xmax and Xmax are summarized later.
It is difficult to separate the effects of particle production from diffractive dissociation and the
interactions of secondary particles. The difference between models for each diffractive-mass bin
displayed in Figs. 11(a) and 12(a) reflects both the effects with the same diffractive mass. However, the
differences in the diffractive-mass dependences indicate the differences in particle production from
diffractive dissociation, because it is hard to explain the change of the diffractive-mass dependences
using only the effect of the interactions of secondary particles; if we assume the same particle
production from diffractive dissociation between SIBYLL 2.3c and EPOS-LHC, the interactions of
15/22PTEP 2021, 033F01 K. Ohashi et al.
Downloaded from https://academic.oup.com/ptep/article/2021/3/033F01/6132351 by guest on 23 October 2021
Fig. 11. Diffractive-mass dependences of Xmax for events whose collision type at the first interaction is pSD
for (a) 1019 eV and (b) 1017 eV.
μ
Fig. 12. Diffractive-mass dependences of Xmax for events whose collision type at the first interaction is pSD
for (a) 1019 eV and (b) 1017 eV.
secondary particles should make a few g/cm2 difference at log10 (ξ ) = −8 in Fig. 11(a), whereas
more than 15 g/cm2 differences is recognized at log10 (ξ ) = −2. The diffractive-mass dependences of
EPOS-LHC and QGSJET II-04 are similar, whereas a difference can be seen between SIBYLL 2.3c
and the other models; SIBYLL 2.3c only displays a small dip at log10 (ξ ) = −8. These features
suggest that particle production from diffractive dissociation in SIBYLL 2.3c is different between
pSD μ,pSD
the low and middle diffractive-mass regions, and this feature affects Xmax and Xmax . These
diffractive-mass dependences are the same for 1017 eV proton primaries as displayed in Figs. 11(b)
pSD
and 12(b). It is interesting that the models exhibit a good agreement in Xmax predictions only
around log10 (ξ ) = −6, as found in Fig. 11(b). The reason for such differences in the diffractive-
mass dependences and the energy dependence of the differences between models is worth studying
in future.
To estimate the effect of the diffractive-mass spectrum quantitatively, the diffractive-mass spectrum
pSD μ,pSD
at the first interaction was artificially changed. Xmax (Xmax ) after modification of the diffrative
mass spectrum is defined as,
(μ)pSD, modified
(μ)pSD, i
Xmax = i
PM X
Xmax , (5)
i
i
where PM is the probability of the ith diffractive-mass bin of an arbitrary model in Fig. 4, and
X
(μ)pSD, i (μ)pSD
Xmax is Xmax taken from the ith diffractive-mass bin of Fig. 11 (Fig. 12). Using this method,
16/22PTEP 2021, 033F01 K. Ohashi et al.
Table 3. The results of Xmax
pSD
with the modification by the diffractive-mass spectrum, Xmax
pSD, modified
, for the
19
10 eV proton primary case. EXmax is the size of effects estimated by three diffractive-mass spectra as defined
in Eq. 6.
Xmax
pSD, modified
[g/cm2 ]
model for a diffractive-mass the size of
spectrum the effects
model original model EPOS-LHC QGSJET II-04 SIBYLL 2.3c EXmax [g/cm2 ]
EPOS-LHC 838.0±0.3 838.0±0.3 841.7±0.5 837.6±0.5 4.1±0.7
QGSJET II-04 833.3 ±0.3 829.3±1.0 833.3±0.3 828.2±0.6 5.1±0.7
SIBYLL 2.3c 847.4±0.3 850.3±0.7 851.9±0.6 847.4±0.3 4.4±0.7
maximum difference 14.1±0.5 21.0±1.2 18.6±0.7 19.2±0.6
Downloaded from https://academic.oup.com/ptep/article/2021/3/033F01/6132351 by guest on 23 October 2021
Table 4. The results of Xmax
pSD, modified
for the 1017 eV proton primary case.
Xmax
pSD, modified
[g/cm2 ]
model for a diffractive-mass the size of
spectrum the effects
model original model EPOS-LHC QGSJET II-04 SIBYLL 2.3c EXmax [g/cm2 ]
EPOS-LHC 725.5 ±0.3 725.5±0.4 729.8±0.5 725.9±0.5 4.3±0.7
QGSJET II-04 726.5±0.4 719.4±1.0 726.5±0.4 720.9±0.6 7.1±1.2
SIBYLL 2.3c 730.6±0.4 734.7±0.7 735.5±0.6 730.7±0.4 4.8±0.7
maximum difference 5.2±0.5 15.3±1.2 9.0±0.7 9.8±0.7
we can estimate the effect when the diffractive-mass spectrum is changed at the first interactions;
if the cross-section of low diffractive-mass events is increased in the diffractive-mass spectrum,
pSD, modified
Xmax becomes larger. The effects of replacing PM
i
X
between the three models on Xmax
μ
and Xmax , EXmax , are defined as follows:
(μ)pSD, modified (μ)pSD, modified
EXmax = Xmax max − Xmax min , (6)
(μ)pSD, modified (μ)pSD, modified
where Xmax max (Xmax min ) is the maximum (minimum) value of
(μ)pSD, modified
Xmax in the three models.
pSD, modified
The results of Xmax are displayed in Table 3 for 1019 eV and in Table 4 for 1017 eV.
If the diffractive-mass spectrum of QGSJET II-04 is replaced by a spectrum of another model,
pSD, modified
Xmax becomes smaller. The size of EXmax is (4.1±0.7)–(5.1±0.7) g/cm2 for 1019 eV and
(4.3±0.7)–(7.1±1.2) g/cm2 for 1017 eV. Differences between the model predictions when the same
diffractive-mass spectrum was assumed at the first interaction are summarized in the bottom row
of Tables 3 and 4. The size of the differences is (18.6±0.7)–(21.0±1.2) g/cm2 for 1019 eV, which
is larger by 4.5–6.9 g/cm2 than the original difference. Therefore, the differences of predictions
between models become larger even when the same diffractive-mass spectrum is used in the first
pSD collisions. It is noted that these differences include the effect of particle production from
diffractive dissociation and the interactions of secondary particles, and these two effects cannot be
separated.
μ,pSD, modified
The results of Xmax are displayed in Table 5 for 1019 eV and in Table 6 for 1017 eV. The
pSD, modified
tendencies of the effect of the diffractive-mass spectrum are similar to the Xmax case; if the
μ,pSD, modified
diffractive-mass spectrum of QGSJET II-04 is replaced by that in another model, Xmax
17/22PTEP 2021, 033F01 K. Ohashi et al.
μ,pSD, modified
Table 5. The results of Xmax for the 1019 eV proton primary case.
μ,pSD, modified
Xmax [g/cm2 ]
model for a diffractive-mass the size of
spectrum the effects
model original model EPOS-LHC QGSJET II-04 SIBYLL 2.3c EXmax [g/cm2 ]
EPOS-LHC 618.2 ±0.3 618.2±0.3 621.7±0.5 618.4±0.5 3.5±0.6
QGSJET II-04 590.9±0.3 587.4±1.1 591.0±0.3 586.2±0.6 4.8±0.7
SIBYLL 2.3c 604.8±0.3 607.1±0.7 607.6±0.6 604.8±0.3 2.8±0.7
maximum difference 27.3±0.5 30.9±1.3 30.7±0.7 32.2±0.7
Downloaded from https://academic.oup.com/ptep/article/2021/3/033F01/6132351 by guest on 23 October 2021
μ,pSD, modified
Table 6. The results of Xmax for the 1017 eV proton primary case.
μ,pSD, modified
Xmax [g/cm2 ]
model for a diffractive-mass the size of
spectrum the effects
model original model EPOS-LHC QGSJET II-04 SIBYLL 2.3c EXmax [g/cm2 ]
EPOS-LHC 529.1±0.4 529.1±0.4 533.8±0.6 529.5±0.6 4.7±0.7
QGSJET II-04 506.6±0.4 499.4±1.1 506.6±0.4 501.1±0.6 7.1±0.8
SIBYLL 2.3c 514.5±0.4 518.6±0.8 518.8±0.7 514.4±0.4 4.4±0.8
maximum difference 22.5±0.6 29.7±1.2 27.3±0.7 28.4±0.9
becomes smaller. EXmax is (2.8±0.7)–(4.8±0.7) g/cm2 for 1019 eV and (4.4±0.8)–(7.1±0.8) g/cm2
for 1017 eV. The differences between the model predictions become larger even when the same
diffractive-mass spectrum is used in the first pSD collisions.
The estimation above is only focused on the pSD collision category. The diffractive-mass spectrum
is only related to particle production in the dissociation system of the diffractive collision, and that
mainly affects the pSD and DD collision categories. Because the cross-section of the pSD and DD
collisions is 5–12% of the inelastic collisions, the effect of diffractive collision modeling at the first
μ
interactions on Xmax and Xmax is approximately 10 times smaller than the estimations above.
Therefore, the effects of the diffractive-mass spectrum on the average of predictions of Xmax and
μ
Xmax are expected to be 0.5 g/cm2 at maximum. These effects of the diffractive-mass spectrum
are much smaller than the effect of the cross-sectional fractions, which are 5.0 g/cm2 at maximum
as discussed in Sect. 4.2.1. The effects of the diffractive-mass spectrum are similar in Xmax and
μ
Xmax .
From the results in Sects. 4.2 and 4.3, the effects of the diffractive collisions on Xmax show
μ
similar size and the same direction as that on Xmax . Therefore, both the effects of the cross-sectional
fraction and the diffractive-mass spectrum do not solve the problem of inconsistent interpretations
μ
of the cosmic-ray mass composition estimated from Xmax and Xmax . It must be noted that the
μ
collisions of low-energy projectiles below 1015 eV also affect Xmax and Xmax . According to
μ
Ref. [33], collisions with lower-energy projectiles affect Xmax more than Xmax .
18/22PTEP 2021, 033F01 K. Ohashi et al.
Table 7. σ (Xmax ) with categorization at the first interaction.
ND pSD tSD DD CD original
EPOS-LHC 53.8 65.3 69.5 61.8 66.0 58.2
QGSJET II-04 57.1 66.5 76.3 66.8 92.6 60.5
SIBYLL 2.3c 60.5 64.2 76.9 62.6 61.8
Table 8. Results of σ (Xmax ) with modifications of R1 at the first interaction.
σ (Xmax ) [g/cm2 ]
Downloaded from https://academic.oup.com/ptep/article/2021/3/033F01/6132351 by guest on 23 October 2021
original model with modification
interaction R1 = 0.182 R1 = 0.074
model difference difference
EPOS-LHC 58.2 58.2 0.0 55.7 −2.5
QGSJET II-04 60.5 62.2 1.7 59.4 −1.1
SIBYLL 2.3c 61.8 63.4 1.6 61.8 0.0
maximum difference between models 2.6 5.2 6.1
5. The fluctuation of Xmax
The fluctuation of Xmax , σ (Xmax ), is another mass-sensitive observable widely used in experiments.
In this section, we estimate the effect of the ratio of diffractive collisions R1 , which shows the largest
effects on Xmax as discussed in Sect. 4, on σ (Xmax ) for one simple case.
Table 7 shows σ (Xmax ) computed as the standard deviation of each sample categorized at the first
interaction for the 1019 eV proton primary case. The σ (Xmax ) values for all categories of diffractive
collisions are slightly larger than those of the non-diffractive category. One should note that large
differences in Xmax and fractions should be taken into account when we consider σ (Xmax ); the
categories of diffractive collisions show approximately 40–50 g/cm2 larger Xmax than the average,
and the fraction of diffractive collisions is 0.074–0.182 as shown in Figs. 3 and 6. Because of the
large difference in the mean values between ND and the others, the diffractive components affect
σ (Xmax ) even when the fraction is small.
The estimation of the effect on σ (Xmax ) at the first interaction is performed by calculating the Xmax
distribution with changing R1 . The Xmax distribution of each category is rescaled according to the
modified fraction obtained from Eq. 3, and the modified σ (Xmax ) is calculated from the combined
Xmax distribution of them. The results of σ (Xmax ) at the minimum and maximum R1 values, which
are R1 = 0.074 and R1 = 0.182, respectively, are shown in Table 8. The size of the effects when
R1 is changed from 0.074 to 0.182 is 1.6 g/cm2 at SIBYLL 2.3c and 2.8 g/cm2 at QGSJET II-04.
Moreover, if the same R1 is used, the differences between models become larger than the original
differences between models; the size of differences between models with the same R1 is 5.2 g/cm2
for the maximum R1 case and 6.1 g/cm2 for the minimum R1 case, while the original difference is
2.6 g/cm2 . It seems that the effects of diffractive collisions are canceled out with the differences in
other parts by chance.
The estimation of effects over the whole air shower is performed following the method used in
Sect. 4.2.2. The results of σ (Xmax ) are shown in Table 9. The size of the effects is 2.4–3.0 g/cm2 .
Comparing the estimation at the first interaction, the size of the effects is similar for EPOS-LHC and
19/22PTEP 2021, 033F01 K. Ohashi et al.
Table 9. Results of σ (Xmax ) with cross-section ratio modifications over the whole air shower. The reference
ratio, RRef
1 , for the modification is set by fitting the ratio of the predictions by EPOS-LHC or SIBYLL 2.3c
with energy above 1015 eV.
σ (Xmax ) [g/cm2 ]
original model with modification
interaction EPOS-based RRef 1 SIBYLL-based RRef
1
model difference difference
EPOS-LHC 58.2 58.0 0.2 55.6 −2.6
QGSJET II-04 60.5 63.1 2.6 59.4 −1.1
SIBYLL 2.3c 61.8 64.8 3.0 62.3 0.5
maximum difference between models 2.6 6.8 6.7
Downloaded from https://academic.oup.com/ptep/article/2021/3/033F01/6132351 by guest on 23 October 2021
0.9 g/cm2 larger for QGSJET II-04 and SIBYLL 2.3c. We have confirmed that the first interaction
has a dominant contribution on σ (Xmax ).
The size of the effects of R1 on σ (Xmax ) is 3.0 g/cm2 at maximum, which is larger than the
original differences of σ (Xmax ) between models. However, the effect is smaller than the difference of
σ (Xmax ) between proton (approximately 60 g/cm2 ) and helium primaries (approximately 40 g/cm2 );
therefore the effect of R1 makes no significant impact on the interpretation of the mass composition
from σ (Xmax ).
6. Discussion and conclusion
μ
In this work, the effects of the diffractive collisions on Xmax , σ (Xmax ), and Xmax were studied
with focus on three detailed characteristics of the diffractive collisions, (1) cross-sectional fractions
among collision types, (2) diffractive-mass spectra, and (3) particle production from diffractive
μ
dissociation. The diffractive collisions make Xmax and Xmax larger, and the cross-sectional fraction
of the diffractive collisions in the inelastic collisions displays the largest effect among the detailed
characteristics.
If we assume the current differences in predictions between models as uncertainties, the maximum
μ
effect of R1 over a whole air shower is 8.9±0.4 g/cm2 and 9.4±0.4 g/cm2 for Xmax and Xmax ,
respectively. If the same cross-sectional fraction of the diffractive collisions is used for collisions
of > 1015 eV projectiles, the differences between the model predictions become larger by approxi-
μ
mately 4.5 g/cm2 for Xmax and smaller by 0.4–5.2 g/cm2 for Xmax ; therefore the differences of
interpretation of the mass composition from Xmax between models become larger. The effect of
μ
R1 at the first interaction on Xmax and Xmax is approximately 5 g/cm2 for 1019 eV, whereas the
effects of other cross-sectional fractions and the diffractive-mass spectrum at the first interaction are
less than 1 g/cm2 for 1019 eV. Therefore, the effects of cross-sectional fractions between the pSD,
μ
tSD, and DD collisions and the diffractive-mass spectrum are negligible for both Xmax and Xmax .
Any details of diffractive collisions discussed in this paper cannot solve the differences of Xmax
μ
and Xmax predictions between the models. The effect of R1 on σ (Xmax ) is also discussed; however,
the effect has no significant impact on the mass composition from σ (Xmax ).
μ
We found that the sizes of the effect on Xmax and Xmax by any details of diffractive collisions
are similar. This suggests that the discussions in this paper cannot explain the discrepancy between
μ
the interpretations of the cosmic-ray mass composition from Xmax and Xmax . The effects of low-
energy collisions of < 1015 eV projectiles are not discussed in this paper; however, they will affect
20/22You can also read