Forecasting of COVID-19 epidemic size in four high hitting nations (USA, Brazil, India and Russia)
←
→
Page content transcription
If your browser does not render page correctly, please read the page content below
The current issue and full text archive of this journal is available on Emerald Insight at:
                         https://www.emerald.com/insight/2634-1964.htm

Forecasting of COVID-19 epidemic                                                                                       COVID-19 case
                                                                                                                        projections of
 size in four high hitting nations                                                                                           worst-hit
                                                                                                                              nations
 (USA, Brazil, India and Russia)
     by Fb-Prophet machine
          learning model                                                                                               Received 10 September 2020
                                                                                                                        Revised 21 September 2020
                                                                                                                       Accepted 14 November 2020
                        Gopi Battineni and Nalini Chintalapudi
                      Telemedicine and Telepharmacy Center,
     School of Medicinal Products and Health Sciences, University of Camerino,
                               Camerino, Italy, and
                                        Francesco Amenta
                    Telemedicine and Telepharmacy Center,
   School of Medicinal Products and Health Sciences, University of Camerino,
                             Camerino, Italy and
 Research Department, International Radio Medical Center (C.I.R.M.), Rome, Italy

Abstract
Purpose – As of July 30, 2020, more than 17 million novel coronavirus disease 2019 (COVID-19) cases were
registered including 671,500 deaths. Yet, there is no immediate medicine or vaccination for control this
dangerous pandemic and researchers are trying to implement mathematical or time series epidemic models to
predict the disease severity with national wide data.
Design/methodology/approach – In this study, the authors considered COVID-19 daily infection data four
most COVID-19 affected nations (such as the USA, Brazil, India and Russia) to conduct 60-day forecasting of
total infections. To do that, the authors adopted a machine learning (ML) model called Fb-Prophet and the
results confirmed that the total number of confirmed cases in four countries till the end of July were collected
and projections were made by employing Prophet logistic growth model.
Findings – Results highlighted that by late September, the estimated outbreak can reach 7.56, 4.65, 3.01 and
1.22 million cases in the USA, Brazil, India and Russia, respectively. The authors found some underestimation
and overestimation of daily cases, and the linear model of actual vs predicted cases found a p-value (
ACI Originality/value – In this paper, the authors adopted the Fb-Prophet ML model because it can predict the
epidemic trend and derive an epidemic curve.
Keywords COVID-19 pandemic, Worst-hit nations, Infection rates, Fb-Prophet, Seasonal modeling
Paper type Research paper
1. Introduction
The latest epidemic caused by novel coronavirus disease 2019 (COVID-19) is already spread
all over the world [1]. The world has reached the brink of stagnation and struggled by daily
registered new infections [2] and researchers confirmed that the present pandemic has been
caused by the severe accurate respiratory syndrome coronavirus 2 (SARS-CoV-2) [3]. By the
end of July 2020, over 17 million people were globally infected and 650,000 people died
because of this deadly virus [4]. It is said that the virus can transfer easily by either physical
contact or absorption of droplets from an infected case during a talk, cough or sneeze.
The capacity to recognize the rate at which the virus spread is vital in the battle against
pandemics. Monitoring the degree of spreading pace at random time can help national
authorities for planning public health and policymaking to address the pandemic outcomes
[5]. Some recent studies are proposing transmission dynamic models for easy understanding
of virus spread in a specific population, also to propose preventive measures [6–8]. Especially
forecasting by time series models can successfully analyze the COVID-19 disease
characteristics and a cumulative number of infections [9]. The present study is in line with
the research associated with the calculation of COVID-19 cases in China by time series and
panel data models have successfully presented the control of endogeneity, dependence and
unobserved heterogeneity [6]. The authors presented a linear relationship between confirmed
cases and deaths and the nonlinear relationship between total registered cases and confirmed
cases. The recent spreading characteristics of COVID-19 were compared by previous
coronavirus families (i.e. SARS and Middle East respiratory syndrome (MERS)) by adopting
the propagation growth model is presented in ref [10]. Results mentioned that the COVID-19
transmission rate is almost double than of SARS and MERS and infected cases increased
twice every two–three days without having human intervention.
Many researchers worldwide produced studies associated with COVID-19 predictions in
severely affected countries. Indian research conducted by [11] was considered an suspectable-
exposed-infected-recovered (SEIR) compartmental model in order to understand the knowledge
of virus longevity and manage healthcare systems at regional levels. Another study with the
incorporation of the SEIR model has successfully estimated the virus dynamics by adding an
isolation compartment and proposed controlling measures of infection rates [12]. The Italian
study with the adoption of autoregressive integrated moving average (ARIMA) time series
models has successfully predicted confirmed and recovered cases by the continuation of a 60-
day national lockdown and results achieved 93.75%, and 84.4% for both confirmed and
recovered cases [13]. The work of [14] was developed four-time series models, namely,
autoregressive (AR) models, moving average (MA), a combination of both AR and MA (ARMA)
and ARIMA to compare the best-fitted model in prediction of COVID-19 spread in Saudi Arabia.
Outcomes suggested that the ARIMA model was outperformed than the other three models.
The impact seasonal characteristics in virus spread from Wuhan and Italy was well
analyzed in ref [15] by the incorporation of time series models. Results highlighted that the
cold weather in early 2020 has largely caused the virus spread in Wuhan and a similar strike
has been observed in Northern Italy. In continuation of the above studies, we developed the
COVID-19 predictive model of the four most affected nations such as the USA, Brazil, India
and Russia to calculate the total possible infections by end of September 2020. In this paper,
we adopted the Fb-Prophet machine learning (ML) model because it can predict the epidemic
trend and derive an epidemic curve [16].The rest of the paper is as follows. The next section presented data collection sources and COVID-19 case
Prophet model equations. In Section 3, two-month projections on cumulative infections are projections of
presented for four included countries. Finally, Section 4 summarizes the main results of the
present work along with suggested measures that need to follow for the fight against COVID-19.
worst-hit
nations
2. Methods
2.1 Data sources
Many COVID-19 open data sources that are available to do epidemic forecasting. The most
recent daily outbreak data have been retrieved from the John Hopkins University dashboard
that displays country-level epidemic trends [4]. The data can be automatically updated on a daily
base since the epidemic origination. The periodical analysis is conducted by COVID-19 data of
mentioned four nationalities from January 20 to July 30, 2020. The dashboard including
nationwide infected cases including deaths confirmed cases and total confirmed cases.
2.2 Fb-Prophet model
ML algorithms for predictive analysis are works through training of historical data and deep
learning, linear regression, artificial neural networks and Bayesian algorithms are examples
of them [17]. These algorithms select the best suitable model according to dataset features
and predict future outcomes. This study applied similar practices to COVID-19 prediction for
global epidemic data. We applied Fb-Prophet, famously known as the open-source
framework of Facebook that was introduced in 2017 to perform time series forecasting by
an additive model.
Fb-Prophet nonlinear trends are set with daily, weekly and yearly seasonality, plus
holiday effects [16]. This perfectly fits for historical data of several seasons data and strong
seasonal effects and it is fully automatic with limited manual involvement. A well-derived
Prophet model not only helps to future predictions but also to detect anomalies and fill gaps in
missing values. Most scholars prefer to conduct epidemic forecasting either by time series
models (i.e. ARIMA) or SEIR models. This paper includes a nonlinear time series model of
three components such as seasonality, trend and holidays y(t) 5 g(t) þ s(t) þ h(t) þ et; where
g(t): stepwise linear or logistic growth curve for modeling of nonperiodic changes in time
series, s(t): seasonal changes, h(t): effects of holidays with irregular schedules, and et: error
term. To fit and forecast the effects of seasonal changes, the model relies on the Fourier
P
series for adjustments, and seasonal changes s (t) is derived as sðtÞ ¼ Nn¼1 ðan cosð2πTntÞ þ
bn sinð2πTntÞÞ; where parameters [a1, b1. . . an, bn] need to be estimated for a given N and T is the
time value. In this research, we developed an example of Prophet class with fit and predictive
techniques. The model input always is a time series with two features: t is time and y: is the
total cases in a particular country.
3. Results
This section presents the experimental results of COVID-19 trend forecasting for four countries
based on historical epidemic data (January 20, 2020–July 30, 2020). Weekly epidemic trends and
model performance are further analyzed to understand model effectiveness.
3.1 Epidemic trend forecasting
We produce model input of two parameters such as time (in months) and total confirmed
cases. The prophet model without considering daily and yearly seasonality because we do not
have sufficient data to measure. Figure 1 displays 60-day prediction results for the
cumulative number of infected cases. With current measures of epidemic control, the total
infections can reach peak value by the end of September in the USA, Brazil and India.
Whereas in Russia the linear trend can be observed with little infection rate. The totalACI
Figure 1.
Epidemic forecasting
of four infected nations
Actual Predicted
Actual Predicted
8.00e+6
5.00e+6
7.00e+6 4.50e+6
USA
6.00e+6 4.00e+6 BRAZIL
3.50e+6
5.00e+6
3.00e+6
4.00e+6
2.50e+6
3.00e+6 2.00e+6
1.50e+6
2.00e+6
1.00e+6
1.00e+6
500000
0 0
–500000
Feb 2020 Mar 2020 Apr 2020 May 2020 Jun 2020 Jul 2020 Aug 2020 Sep 2020 Feb 2020 Mar 2020 Apr 2020 May 2020 Jun 2020 Jul 2020 Aug 2020 Sep 2020
Actual Predicted
Actual Predicted
1.40e+6
3.00e+6
1.20e+6
2.50e+6 INDIA RUSSIA
1.00e+6
2.00e+6
800000
1.50e+6
600000
1.00e+6
400000
500000
200000
0
0
Feb 2020 Mar 2020 Apr 2020 May 2020 Jun 2020 Jul 2020 Aug 2020 Sep 2020
Feb 2020 Mar 2020 Apr 2020 May 2020 Jun 2020 Jul 2020 Aug 2020 Sep 2020epidemic population has predicted in the USA to be 7,567,914 (7,518,768–7,753,816:95% CI) COVID-19 case
by late September. Similarly, this size estimated in Brazil, India and Russia are 4,654,312 projections of
(4,612,561–4,708,145:95% CI), 3,009,896 (2,998,019–3,108,654:95% CI) and 1,219,896
(1,208,114–1,431,017; 95% CI), respectively.
worst-hit
nations
3.2 Epidemic curve of daily register cases
We plotted daily epidemic characteristic curves for each country to understand the disease
behaviors. These curves present only artificial data patterns but did not confirm the actual
infections per day. This may happen because of the fluctuations in data characteristics of
available data and factual information. Sometimes there is a possibility of not every infected
person could not be tested or confirmed [18]. For instance, in the USA a low epidemic size has
been observed on Wednesday and a high epidemic on Saturday (Refer Figure 2), but it is not
necessarily happened to be the USA people can be exposed to the virus on Saturday. In Brazil,
epidemic size is high on Friday and Saturday and low on Monday. Moreover, a high epidemic
can be observed in India and Russia on Sunday and Monday, and low on Wednesday for
India and Friday for Russia.
The model parametric relationship between COVID-19 confirmed cases in four nations has
presented in Table 1. The model generated forecasting values are statistically significant
with 95% confidence intervals (CI) and the corresponding predictive R2 value is from 99.91%
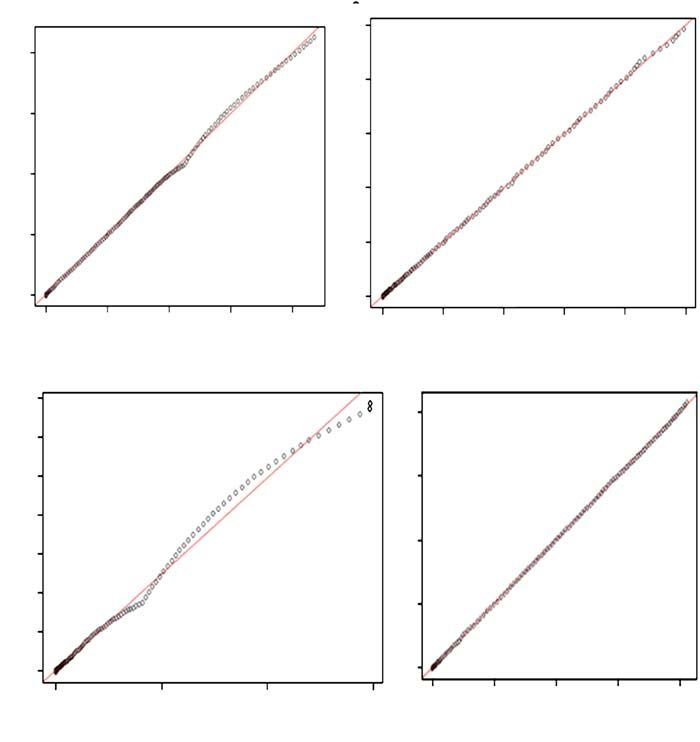
to 99.99%. The summarization of daily cases has observed are presented in Table 2. To
analyze the developed model we plot the linear regression models by presenting actual cases
(x-axis) versus predicted cases (y-axis). In these models for the only country India, we found
both underestimation and overestimation and for the other three countries such as the USA,
Brazil and Russia simple linear trend has observed (Refer Figure 3). These models are further
validated by getting R2 value ranged from 0.9951 to 0.9999 at a 5% level significance. For all
four models the lowest p-value ofACI
Figure 2.
Epidemic trend and
of COVID-19 infection
rates in four countries
weekly characteristics
8e+06 5e+06
USA
4e+06
Brazil
6e+06
3e+06
4e+06
trend
trend
2e+06
2e+06 1e+06
0e+00 0e+00
Apr Jul Oct Apr Jul Oct
ds ds
5000
2500 2500
0 0
weekly
weekly
–2500 –2500
–5000
Sunday Monday Tuesday Wednesday Thursday Friday Saturday Sunday Monday Tuesday Wednesday Thursday Friday Saturday
Day of week Day of week
3e+06
India Russia
1e+06
2e+06
trend
trend
5e+05
1e+06
0e+00 0e+00
Apr Jul Oct Apr Jul Oct
ds ds
2000
100
1000 50
0 0
weekly
–50
weekly
–1000
–100
–2000
–150
Sunday Monday Tuesday Wednesday Thursday Friday Saturday
Sunday Monday Tuesday Wednesday Thursday Friday Saturday
Day of week Day of weekinfections. But the four countries considered in this study are far beyond European nations in COVID-19 case
the assessment of epidemic size. projections of
In Latin American countries like Brazil, approximately 2.5 million people are confirmed for
COVID-19 disease and this number might even touch 4.6 million by late September. These
worst-hit
projections are in accordance with the results of research conducted by Washington University nations
[21]. Brazil also being viewed as a massive epidemic spread place and positioned a high number
of deaths after the USA. Simultaneously, the epidemic size of the other two countries such as
India and Russia will reach up to 3.15, and 1.22 million confirmed cases by the September end.
Besides forecasting, our study also highlighted the weekly epidemic characteristics including
daily seasonal modeling. These models are most effective in understanding the dynamic
spread of COVID-19 and suggest immediate actions to control the epidemic. From the
beginning of the COVID-19 pandemic, some statistical and mathematical modeling studies
are available to predict national and global epidemics by altering the degrees of accuracy.
The uncertainties in prediction accuracy depend upon the assumptions that have been made
on available data. These forecasting outcomes might vary largely because of the difference in
input value parameters and assumptions. During novel pandemics like COVID-19, the quality
and availability are to keep changes as the epidemic progress and cause uncertainties in
predictions at early stages and improved in further stages.
By incorporating the Fb-Prophet ML model, we achieved more than 99% of prediction
accuracy. However, we found a little bias in linear modeling for India’s epidemic forecasting
with the possibility of either overestimation or underestimation. Another study involved with
the Fb-Prophet model estimated that the total epidemic size 1,737,272 for Brazil, 283,029 for
Russia, 330,043 for India by mid-June 2020, and the global outbreak reported 14.12 million
infections will peak in October [22].
4.1 Recommendations
A novel pandemic caused by COVID-19 has been affecting almost every world nation.
COVID-19 is a deadly disease of the 21st century that results in over 8.5 million deaths and
still ongoing. Especially, the mentioned four countries currently are facing severe epidemic
Parameter USA Brazil Russia India
Confirmed cases 0.9131** 0.9463** 0.9697** 0.9354**
Stand.error 2.337eþ03 1.119eþ03 4.316eþ03 8.170eþ02
F Statistic 2.687eþ05 1.727eþ05 3.451eþ03 5.032eþ04
Pr (>jtj)ACI
2500000
4e+06 USA Brazil
3e+06
1500000
pred
pred
2e+06 1e+06
500000
0e+00
0
0e+00 1e+06 2e+06 3e+06 4e+06 0 500000 1000000 1500000 2000000 2500000
actual actual
1400000
8e+05
Russia
India
1000000
6e+05
4e+05
pred
pred
600000
2e+05
200000
0e+00
Figure 3.
0
Residual plots for
actual versus predicted 0 500000 1000000 1500000 0e+00 2e+05 4e+05 6e+05 8e+05
cases of four countries
actual actual
pressure in means of both total infections and deaths. Moreover, this kind of epidemics did
not act like other diseases due to its continuous alterations in pathogens. Local communities
should promote awareness and national administrative sites also have to freely publish
COVID-19 infection cases. Response teams and other medical staff members should take
more care to conduct home-to-home screening tests, especially in worst affect regions.
It can understand that for any country it is beyond the capacity to test every individual.
But imposing partial lockdown in cities, avoiding international travel, shutdown the malls,
theaters and gyms, and could make this epidemic practically controlled. Healthcare
authorities have should make mask-wearing is compulsory in public and kept the ban on
large gatherings. Our model results highlighted that epidemic size could be doubled and peak
can be observed in October 2020. In that scenario, all national governments should think to
impose a second phase country lockdown with no ease and national authorities should make
sure of people have been confined to home. Healthcare centers and hospitals need to manage
the patient flow, also address issues like overcrowd and bed availability. Universities and
other educational institutions are encouraged to continue e-learning methods.4.2 Strengths and limitations COVID-19 case
We involved the Fb-Prophet ML model for forecasting analysis. In SEIR, the model projections of
assumptions are made for every suspected case that has an equal chance of getting contact
with another person, and the transmission rate remains the same throughout an epidemic
worst-hit
duration. This model considered having similar transmission rates for both quarantine and nations
nonquarantine population. At the same time, time series models like ARIMA are dealing with
one or more values per time step and attribute tuning has been mandatory to get
comprehensive accuracy. But the Fb-Prophet model does not require the interpolation of
missing data and enhances better forecasting by an accumulation of seasonal modeling.
Despite the high prediction accuracy, the adopted Fb-Prophet model possesses some
limitations. Primarily by lack of more clear data on daily and yearly seasonality more detailed
predictions are not possible, but these models are helping to forecast future cumulative
infections. But to the best of our knowledge, the forecasting results generated in this work are
effective for the current pandemic situation.
5. Conclusions
The present analysis was conducted by considering live COVID-19 epidemic data of the USA,
Brazil, India and Russia which retrieved from the John Hopkins University dashboard.
Projections are highlighted that there is a chance of an epidemic peak in early October in those
countries. It demands the possibility for a second phase national lockdown with no ease or
else there could be a chance of getting a second-wave outbreak. This study proposed a
forecasting method with the Fb-Prophet model for COVID-19 analysis. A prophet is perfect
for nonlinear trends that fitted with daily, weekly, yearly seasonality plus holiday effects. We
only applied time-series data (ds) as model trend terms. This will leave a knowledge gap for
future research. By converting the imposition of preventive measures like lockdown, travel
bans as holiday effects in the model can enhance research significance. The model proposed
in our work significantly improves the estimations of infection numbers in other global
countries in order to help national authorities to do better planning of health policy
interventions.
References
1. Latest COVID-19 news from monday’s WHO briefing j world economic forum. available at:
https://www.weforum.org/agenda/2020/03/coronavirus-covid19-breaking-world-health-
organisation/ (accessed 10 March 2020).
2. Rothan HA, Byrareddy SN. The epidemiology and pathogenesis of coronavirus disease (COVID-
19) outbreak. J Autoimmun. 2020 May; 109: 102433. doi: 10.1016/j.jaut.2020.102433.
3. Chawla S, Mittal M, Chawla M, Goyal LM. Corona virus - SARS-CoV-2: an insight to another way
of natural disaster. EAI Endorsed Trans. Pervasive Heal Technol. 2020; 6(22). doi: 10.4108/eai.28-
5-2020.164823.
4. COVID-19 map - Johns Hopkins coronavirus resource center. available at: https://coronavirus.jhu.
edu/map.html (accessed 30 July 2020).
5. Battineni G, Chintalapudi N, Amenta F. Tropical Conditions and Outbreak of COVID-19. Pharm
Biomed Res. 2020; 6: 9-16. available at: http://pbr.mazums.ac.ir/article-1-342-en.html
6. Sarkodie SA, Owusu PA. Investigating the cases of novel coronavirus disease (COVID-19) in
China using dynamic statistical techniques. Heliyon. 2020 Apr; 6(4): e03747. doi: 10.1016/j.heliyon.
2020.e03747.
7. Chintalapudi N, Battineni G, Sagaro GG, Amenta F. COVID-19 outbreak reproduction number
estimations and forecasting in Marche, Italy. Int J Infect Dis. 2020 Jul; 96: 327-33. doi: 10.1016/j.ijid.
2020.05.029.ACI 8. Wynants L, Van Calster B, Collins GS, Riley RD, Heinze G, Schuit E, Bonten MMJ, Damen JAA,
Debray TPA, et al. Prediction models for diagnosis and prognosis of covid-19 infection:
systematic review and critical appraisal. BMJ. 2020 Apr 7; 369: m1328. doi: 10.1136/bmj.m1328.
9. Papastefanopoulos V, Linardatos P, Kotsiantis S. COVID-19: a comparison of time series methods
to forecast percentage of active cases per population. Appl Sci. 2020; 10: 3880. doi: 10.3390/
app10113880.
10. Liang K. Mathematical model of infection kinetics and its analysis for COVID-19, SARS and
MERS. Infect Genet Evol. 2020 Aug; 82: 104306. doi: 10.1016/j.meegid.2020.104306.
11. Bhola J, Venkateswaran VR, Koul M. Corona epidemic in Indian context: predictive mathematical
modelling. MedRxiv. 2020. doi: 10.1101/2020.04.03.20047175.
12. Battineni G, Chintalapudi N, Amenta F. SARS-CoV-2 epidemic calculation in Italy by SEIR
compartmental models. Applied Computing and Informatics. 2020. doi: 10.1108/ACI-09-2020-0060.
13. Chintalapudi N, Battineni G, Amenta F. COVID-19 virus outbreak forecasting of registered and
recovered cases after sixty day lockdown in Italy: a data driven model approach. J Microbiol
Immunol Infect. 2020 Jun; 53(3): 396-403. doi: 10.1016/j.jmii.2020.04.004.
14. Alzahrani SI, Aljamaan IA, Al-Fakih EA. Forecasting the spread of the COVID-19 pandemic in
Saudi Arabia using ARIMA prediction model under current public health interventions. J Infect
Public Health. 2020 Jul; 13(7): 914-9. doi: 10.1016/j.jiph.2020.06.001.
15. Scafetta N. Distribution of the SARS-CoV-2 pandemic and its monthly forecast based on seasonal
climate patterns. Int J Environ Res Public Health. 2020 May 17; 17(10): 3493. doi: 10.3390/
ijerph17103493.
16. Yenidogan A, Çayir O, Kozan T, Da g T, Arslan Ç. Bitcoin Forecasting Using ARIMA and
PROPHET. 2018 3rd International Conference on Computer Science and Engineering (UBMK);
2018; Sarajevo. p. 621-24. doi: 10.1109/UBMK.2018.8566476.
17. Battineni G, Sagaro GG, Chinatalapudi N, Amenta F. Applications of machine learning predictive
models in the chronic disease diagnosis. J Pers Med. 2020 Mar 31; 10(2): 21. doi: 10.3390/
jpm10020021.
18. Kwon KT, Ko JH, Shin H, Sung M, Kim JY. Drive-through screening center for covid-19: a safe and
efficient screening system against massive community outbreak. J Korean Med Sci. 2020 Mar 23;
35(11): e123. doi: 10.3346/jkms.2020.35.e123.
19. Petropoulos F, Makridakis S. Forecasting the novel coronavirus COVID-19. PloS One. 2020 Mar
31; 15(3): e0231236. doi: 10.1371/journal.pone.0231236.
20. Jewell NP, Lewnard JA, Jewell BL. Predictive mathematical models of the COVID-19 pandemic:
underlying principles and value of projections. JAMA. 2020 May 19; 323(19): 1893-4. doi: 10.1001/
jama.2020.6585.
21. Available at: https://www.who.int/docs/default-source/coronaviruse/situation-reports/20200707-
covid-19-sitrep-169.pdf?sfvrsn5c6c69c88_2 (accessed 7 July 2020).
22. Wang P, Zheng X, Li J, Zhu B. Prediction of epidemic trends in COVID-19 with logistic model and
machine learning technics. Chaos, Solit Fractals. 2020 Oct; 139: 110058. doi: 10.1016/j.chaos.2020.
110058.
Corresponding author
Gopi Battineni can be contacted at: gopi.battineni@unicam.it
For instructions on how to order reprints of this article, please visit our website:
www.emeraldgrouppublishing.com/licensing/reprints.htm
Or contact us for further details: permissions@emeraldinsight.comYou can also read