Weather variability and transmissibility of COVID-19: a time series analysis based on effective reproductive number
←
→
Page content transcription
If your browser does not render page correctly, please read the page content below
Experimental Results (2021), 2, e15, 1–10
doi:10.1017/exp.2021.4

LIFE SCIENCE AND BIOMEDICINE
NOVEL-RESULT

Weather variability and transmissibility of COVID-19: a
time series analysis based on effective reproductive
number
Xiaohan Si1 , Hilary Bambrick1, Yuzhou Zhang1, Jian Cheng1, Hannah McClymont1                                               ,
Michael B. Bonsall2 and Wenbiao Hu1,*
1
 School of Public Health and Social Work, Queensland University of Technology, Brisbane, 4059, Queensland, Australia, and
2
 Mathematical Ecology Research Group, Department of Zoology, University of Oxford, Oxford, OX1 3SZ, UK
*Corresponding author: E-mail: w2.hu@qut.edu.au

(Received 25 January 2021; Revised 09 February 2021; Accepted 15 February 2021)

    Abstract
    COVID-19 is causing a significant burden on medical and healthcare resources globally due to high numbers
    of hospitalisations and deaths recorded as the pandemic continues. This research aims to assess the effects of
    climate factors (i.e., daily average temperature and average relative humidity) on effective reproductive
    number of COVID-19 outbreak in Wuhan, China during the early stage of the outbreak. Our research
    showed that effective reproductive number of COVID-19 will increase by 7.6% (95% Confidence Interval:
    5.4% ~ 9.8%) per 1°C drop in mean temperature at prior moving average of 0–8 days lag in Wuhan, China.
    Our results indicate temperature was negatively associated with COVID-19 transmissibility during early
    stages of the outbreak in Wuhan, suggesting temperature is likely to effect COVID-19 transmission. These
    results suggest increased precautions should be taken in the colder seasons to reduce COVID-19 transmis-
    sion in the future, based on past success in controlling the pandemic in Wuhan, China.

Keywords: weather factors; COVID-19; effective reproductive number; time series regression model

1. Introduction
COVID-19 is a widespread global pandemic caused by SARS-CoV-2 coronavirus causing significant
socio-economic impact. As of 8th February 2021, over the duration of the pandemic over 106 million
confirmed cases and 2 million deaths have been reported in over 200 countries, areas or territories (Johns
Hopkins University, 2020). Previous studies show that cold and dry weather may positively influence
coronavirus survival time and the transmission rate of upper respiratory tract coronavirus infections
(Chan et al., 2011; Van Doremalen et al., 2013). However, the role of meteorological effect on the spread
of COVID-19 is still controversial (Demongeot et al., 2020; Qi et al., 2020; Tosepu et al., 2020). A recent
review on 23 studies about weather and COVID-19 showed that temperature and humidity can
contribute to increased transmission of COVID-19, particularly in winter conditions which is a
conductive environment for virus survival (McClymont & Hu, 2021). For example, a study on the
growth of new cases in tropical and temperate regions showed that temperature has a positive association
with the number of daily new cases (Chennakesavulu & Reddy, 2020). Another study on multiple cities in
China indicated that temperature and absolute humidity are negatively associated with COVID-19 daily

© The Author(s), 2021. Published by Cambridge University Press. This is an Open Access article, distributed under the terms of the Creative
Commons Attribution licence (http://creativecommons.org/licenses/by/4.0/), which permits unrestricted re-use, distribution and reproduction,
provided the original article is properly cited.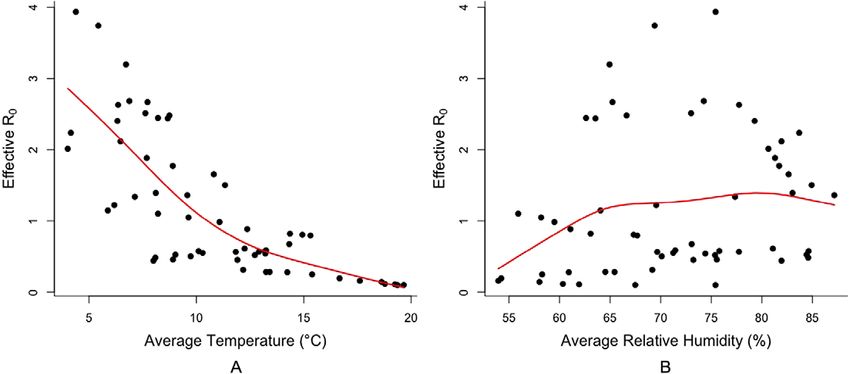
2 Xiaohan Si et al.
new cases (Liu et al., 2020). However, these studies only used confirmed case number as response
variable, rather than transmissibility, to investigate the climate effect in COVID-19 transmission.
Effective reproductive number (Reff) is a robust model-based indicator of transmissibility of COVID-
19, which can reflect the real-time transmissibility of COVID-19 through an outbreak. The research aims
to assess the effects of climate factors (i.e. daily average temperature and average relative humidity) on Reff
of COVID-19 based on local cases in Wuhan, China. The Reff we used in this study considered the effect
from public health interventions, providing more information and reducing confounding factors
compared with daily cases. Also, compared with research only reporting the basic reproductive number
(R0), Reff can also provide greater accuracy in estimating transmissibility as it does not need to meet the
model assumption that the virus is freely transmitted with no intervention (Nishiura & Chowell, 2009).
2. Data collection and statistical methods
Wuhan city was chosen as our study site due to strict lockdown measures which were implemented from
23rd January 2020. During this time, all cases included in our study could be considered as locally
transmitted without any imported cases during this period. This environment is ideal for modelling the
COVID-19 transmission dynamic via effective reproductive number based on Susceptible-Infected-
Removal (SIR) model from Bayesian estimation.
Daily number of confirmed COVID-19 cases reported between 14th January 2020 and 17th March
2020 were obtained from the JHU coronavirus resource center (Dong et al., 2020). Daily data on
temperature and humidity through the same period were obtained from National Climatic Data Center,
US Department of Commerce (https://www.ncdc.noaa.gov).
We used Bayesian Estimation theory to estimate the Reff, and a 10-days averaging window was applied
to reduce the impact from stochastic events (e.g., population migration during Chinese New Year). The
method was used to estimate daily parameter of SIR model and calculate daily Reff (Cori et al., 2013;
Forsberg White & Pagano, 2008). The mean and standard deviation of the incubation period used in this
study are 4.7 days and 2.9 days respectively, estimated by Nishiura et al. (2020). Besides a 10 day time
window was assigned in estimation to improve the estimation accuracy via EpiEstim (Cori et al., 2013).
To control for alterations to case reporting criteria on 12th February, only laboratory confirmed cases
were included, which for this date was 1,072 cases, issued by Health Commission of Hubei Province
(Health Commission of Hubei Province, 2020).
Time series generalized linear model (GLM) and generalized additive model (GAM) with Gamma
distribution and logarithm link function were used to assess the relationship between meteorological
factors and Reff. The GLM can be defined as:
log ðY t Þ ¼ β0 þ β1 TEMPt þ β2 RH t (1)
where Yt denotes the estimated Reff at time t during the outbreak. β0 , β1 and β2 represents the model
intercept and coefficients of independent variables under lag effect on average temperature (TEMP) and
average relative humidity (RH), respectively. We used cross-correlation function (CCF) to evaluate the
lag effect at different days between TEMP, RH and COVID-19 transmission. Based on the assessment of
CCF, we used lag 0–8 days on TEMP and lag 0–3 days on RH in our model.
The GAM can be defined as:
log ðYt Þ ¼ β0 þ sðTEMPT , df ¼ 4Þ þ sðRHt , df ¼ 4Þ (2)
where sðÞ is the thin plate regression spline function for smoothing, which are average temperature and
average relative humidity at time t; df is the degrees of freedom; Yt and β0 represents the same term as in
model (1).
Sensitivity analysis on the degree of freedom (df) of smoothing spline showed that the model has
better performance in generalized cross-validation (GCV) when df = 4 (k-index = 0.82, p = 0.12)
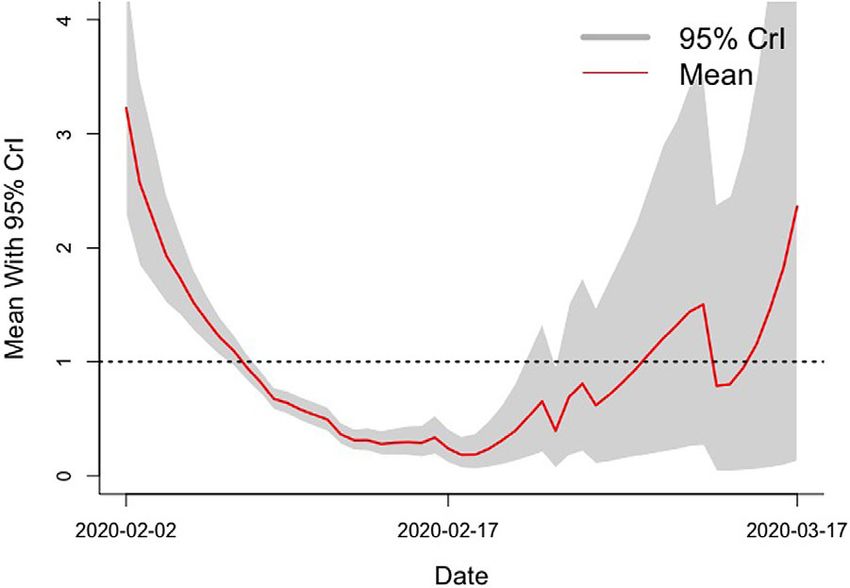
compared with the model when df = 3 (k-index = 0.83, p = 0.07) and df = 2 (k-index = 0.83, p = 0.04).Experimental Results 3 3. Results Figure 1 showed that the real-time changes of Reff during the outbreak had a gradual downward trend until the end of February. Table 1 showed that a moving average of lag 0–8 days temperature after adjusted with RH was associated with daily Reff in Wuhan city (Relative Risk (RR): 0.924, 95% Confidence Interval (CI): 0.902– 0.946). However, there was no association between RH and Reff. Figure 1. Daily Reff curve in Wuhan, China Table 1. Relative risks of Reff from time series generalized linear model Variables Relative Risk 95% CI p-value TEMP (°C) 0.924 (0.902, 0.946)
4     Xiaohan Si et al.

   As for GAM, Figure 2 showed the scatter plots with smoothing spline with 4 degrees of freedom from
the model between daily Reff, TEMP and RH respectively. Figure 2 suggested that TEMP has an
approximate linear relation with Reff, but average relative humidity shows more nonlinear variation in
the relationship.

4. Conclusions
Our research based on the Reff suggested that temperature has a significant negative association with
COVID-19 transmission. This result was similar to results reported in some studies for the association
between temperature and COVID-19 case numbers (Tosepu et al., 2020; Zhu & Xie, 2020). However,
relative humidity was not found to contribute significantly in explaining variation in transmissibility of
COVID-19. Our research filled the gap in illustrating the weather effect on COVID-19 transmission rate
via Reff with strong public health interventions.
    Our result gives a higher variation range of Reff by 1°C changes on temperature (5.4% ~9.8%)
compared with previous studies (2%~4% or no effects) which excluded intervention effects and used
reproductive number looking at virus transmission (Sahafizadeh & Sartoli, 2020; Wang et al., 2020). One
possible explanation for this difference is the choice of time period: a study assessed a very short time
period with no public health intervention in China (19 January–23 January) and U.S. (15 March–
6 April), and all data were from the period prior to stay-at-home orders being fully implemented (Wang
et al., 2020). Furthermore, a large number of cities in different locations were included in some studies to
estimate transmissibility of COVID-19 contemporaneously but without a single region or area having
sufficient epidemic duration for a more robust analysis (Baker et al., 2020; Liu et al., 2020; Qi et al., 2020;
Zhu & Xie, 2020). Our two-month study period is long enough to be considered as a full epidemic
outbreak, given the lag for incubation period of up to 14 days for transmission of this disease. Another
focus which might cause such variation is the potential nonlinear relation between Reff and studying
meteorological variable. Future studies are required to explore these complex nonlinear and interactive
effects on virus transmission risk.
    Previous research showed absolute or relative humidity had positive or negative influence on COVID-
19 transmission (Guo et al., 2020; McClymont & Hu, 2021; Park et al., 2019). These studies reported
marginal correlations between humidity and COVID-19 cases number. Further potential caveats is the
classification of imported versus local cases, which might contribute to the wide variation in transmission
between different groups and potential for super spreaders (Baker et al., 2020; Liu et al., 2020; Qi et al.,
2020; Yao et al., 2020). The misclassification between imported cases and local transmitted cases might
lead to the overestimation of transmissibility of COVID-19, especially in those countries or regions where
imported cases are the cases majority.
    Two other studies used time series Auto Regressive Integrated Moving Average (ARIMA) model and
machine learning as new approaches to assess the association between weather and COVID-19 cases
(Malki, Atlam, Ewis, et al., 2020; Malki, Atlam, Hassanien, et al., 2020). However, ARIMA model requires
a relatively long time period and stationarity of time series data (Chintalapudi et al., 2020). In future
research, seasonal ARIMA modelling can be used to predict the trend of COVID-19 transmission, with
potential socio-environmental factors.
    A possible limitation of this study is that we used the case notification date rather than onset date due
to data availability which may have reduced the strength and/or accuracy of the estimated relationship
between temperature and Reff. UV radiation and air pollution were not included in our study. UV
radiation is associated with COVID-19 transmission as reported in several studies (Cadnum et al., 2020;
Hamzavi et al., 2020). However, UV radiation will only be relevant to outdoor human activities and
subsequent transmission, due to strict lockdowns, Wuhan city banned all outdoor activities for the
entirety of the study period (Pun et al., 2020). Moreover, air pollutant significantly reduced during the
study period in Wuhan while the city was in lockdown (Lian et al., 2020). Under these conditions, it is
reasonable to believe UV radiation and air pollutant could have a limited effect on COVID-19
transmission.
Experimental Results 5 In conclusion, our study suggested that temperature changes have an effect on the transmissibility of COVID-19, with transmission increasing as temperature declines. However, further research is required to assess the complex relationship at global, regional and local levels, and develop a spatiotemporal weather-based early warning system for COVID-19. Acknowledgements. We acknowledge the work and contribution of all workers in National Health Commission of China, Health Commission of Hubei Province and Johns Hopkins University Coronavirus Resource Center on collecting and publishing data of COVID-19 outbreak, and of the National Climatic Data Center, US Department of Commerce on climate data publication. We gratefully acknowledge the efforts of healthcare workers in Wuhan, and globally, caring for patients infected with SARS-CoV-2. Author contributions. WH conceived and designed the study. XS and YZ conducted data gathering. XS performed statistical analyses and drafted the paper. All authors interpreted the results and revised the paper. Funding information. This research received no specific grant from any funding agency, commercial or not-for-profit sectors. Conflicts of interest. All authors declare none. Availability of data. All data used in this article are publicly available. Daily counts of reported confirmed COVID-19 cases, recoveries and deaths for each country are obtained from the JHU coronavirus resource center [1, 18] (publicly available at https://github.com/CSSEGISandData/COVID-19). Weather data is available from National Climatic Data Center, US Department of Commerce (https://www.ncdc.noaa.gov). Code availability. Using R 4.0.0 with package EipEstim 2.2 and mgcv 1.8 for modelling. References Baker, R. E., Yang, W., Vecchi, G. A., Metcalf, C. J. E., & Grenfell, B. T. (2020). Susceptible supply limits the role of climate in the early SARS-CoV-2 pandemic. Science, 369, 315–319. Cadnum, J. L., Li, D. F., Redmond, S. N., John, A. R., Pearlmutter, B., & Donskey, C. J. (2020). Effectiveness of ultraviolet-C light and a high-level disinfection cabinet for decontamination of N95 respirators. Pathogens and Immunity, 5, 52–67. https:// doi.org/10.20411/pai.v5i1.372. Chan, K.-H., Peiris, J. M., Lam, S., Poon, L., Yuen, K., & Seto, W. H. (2011). The effects of temperature and relative humidity on the viability of the SARS coronavirus. Advances in Virology, 2011, 734690. Chennakesavulu, K., & Reddy, G. R. (2020). The effect of latitude and PM2.5 on spreading of SARS-CoV-2 in tropical and temperate zone countries. Environmental Pollution, 266, 115176. https://doi.org/10.1016/j.envpol.2020.115176. Chintalapudi, N., Battineni, G., & Amenta, F. (2020). COVID-19 virus outbreak forecasting of registered and recovered cases after sixty day lockdown in Italy: A data driven model approach. Journal of Microbiology, Immunology and Infection, 53, 396–403. https://doi.org/10.1016/j.jmii.2020.04.004. Cori, A., Ferguson, N. M., Fraser, C., & Cauchemez, S. (2013). A new framework and software to estimate time-varying reproduction numbers during epidemics. American Journal of Epidemiology, 178, 1505–1512. Demongeot, J., Flet-Berliac, Y., & Seligmann, H. (2020). Temperature decreases spread parameters of the new COVID-19 case dynamics. Biology, 9, 94. Dong, E., Du, H., & Gardner, L. (2020). An interactive web-based dashboard to track COVID-19 in real time. The Lancet. Infectious Diseases, 20, 533–534. https://doi.org/10.1016/s1473-3099(20)30120-1. Forsberg White, L., & Pagano, M. (2008). A likelihood-based method for real-time estimation of the serial interval and reproductive number of an epidemic. Statistics in Medicine, 27, 2999–3016. Guo, X. J., Zhang, H., & Zeng, Y. P. (2020). Transmissibility of COVID-19 in 11 major cities in China and its association with temperature and humidity in Beijing, Shanghai, Guangzhou, and Chengdu. Infectious Diseases of Poverty, 9, 87. https:// doi.org/10.1186/s40249-020-00708-0. Hamzavi, I. H., Lyons, A. B., Kohli, I., Narla, S., Parks-Miller, A., Gelfand, J. M., Lim, H. W., & Ozog, D. M. (2020). Ultraviolet germicidal irradiation: Possible method for respirator disinfection to facilitate reuse during the COVID-19 pandemic. Journal of the American Academy of Dermatology, 82, 1511–1512. https://doi.org/10.1016/j.jaad.2020.03.085. Health Commission of Hubei Province. (2020). Hubei Province COVID-19 situation report. http://wjw.hubei.gov.cn/bmdt/ztzl/ fkxxgzbdgrfyyq/xxfb Johns Hopkins University. (2020). Coronavirus resource center. https://coronavirus.jhu.edu Lian, X., Huang, J., Huang, R., Liu, C., Wang, L., & Zhang, T. (2020). Impact of city lockdown on the air quality of COVID-19- hit of Wuhan city. Science of the Total Environment, 742, 140556. https://doi.org/10.1016/j.scitotenv.2020.140556.
6      Xiaohan Si et al.

Liu, J., Zhou, J., Yao, J., Zhang, X., Li, L., Xu, X., He, X., Wang, B., Fu, S., Niu, T., Yan, J., Shi, Y., Ren, X., Niu, J., Zhu, W.,
   Li, S., Luo, B., & Zhang, K. (2020). Impact of meteorological factors on the COVID-19 transmission: A multi-city study in
   China. Science of the Total Environment, 726, 138513.
Malki, Z., Atlam, E. S., Ewis, A., Dagnew, G., Alzighaibi, A. R., Elmarhomy, G., Elhosseini, M. A., Hassanien, A. E., & Gad,
   I. (2020). ARIMA models for predicting the end of COVID-19 pandemic and the risk of second rebound. Neural Computing
   & Applications, 1–20. https://doi.org/10.1007/s00521-020-05434-0.
Malki, Z., Atlam, E. S., Hassanien, A. E., Dagnew, G., Elhosseini, M. A., & Gad, I. (2020). Association between weather data
   and COVID-19 pandemic predicting mortality rate: Machine learning approaches. Chaos, Solitons & Fractals, 138, 110137.
   https://doi.org/10.1016/j.chaos.2020.110137.
McClymont, H., & Hu, W. (2021). Weather variability and COVID-19 transmission: A review of recent research. International
   Journal of Environmental Research and Public Health, 18, 396. https://doi.org/10.3390/ijerph18020396.
Nishiura, H., & Chowell, G. (2009). The effective reproduction number as a prelude to statistical estimation of time-
   dependent epidemic trends. In G.Chowell, J. M.Hyman, L. M. A.Bettencourt, & C.Castillo-Chavez (Eds.), Mathematical
   and Statistical Estimation Approaches in Epidemiology (pp. 103–121). Springer Netherlands.
Nishiura, H., Linton, N. M., & Akhmetzhanov, A. R. (2020). Serial interval of novel coronavirus (COVID-19) infections.
   International Journal of Infectious Diseases, 93, 284–286.
Park, J. U., Son, W. I., Ryu, Y., Choi, S. B., & Ahn, I. (2019). Effects of temperature, humidity, and diurnal temperature range
   on influenza incidence in a temperate region. Influenza & Other Respiratory Viruses, 14, 11–18.
Pun, M., Turner, R., Strapazzon, G., Brugger, H., & Swenson, E. R. (2020). Lower incidence of COVID-19 at high altitude:
   Facts and confounders. High Altitude Medicine & Biology, 21, 217–222. https://doi.org/10.1089/ham.2020.0114.
Qi, H., Xiao, S., Shi, R., Ward, M. P., Chen, Y., Tu, W., Su, Q., Wang, W., Wang, X., & Zhang, Z. (2020). COVID-19
   transmission in Mainland China is associated with temperature and humidity: A time-series analysis. Science of the Total
   Environment, 728, 138778.
Sahafizadeh, E., & Sartoli, S. (2020). Rising summer temperatures do not reduce the reproduction number of COVID-19.
   Journal of Travel Medicine, 28, taaa189. https://doi.org/10.1093/jtm/taaa189.
Tosepu, R., Gunawan, J., Effendy, D. S., Lestari, H., Bahar, H., & Asfian, P. (2020). Correlation between weather and
   COVID-19 pandemic in Jakarta, Indonesia. Science of the Total Environment, 725, 138436.
Van Doremalen, N., Bushmaker, T., & Munster, V. (2013). Stability of Middle East respiratory syndrome coronavirus (MERS-
   CoV) under different environmental conditions. Eurosurveillance, 18, 20590.
Wang, J., Tang, K., Feng, K., & Lv, W. (2020). High temperature and high humidity reduce the transmission of COVID-19.
   https://papers.ssrn.com/sol3/papers.cfm?abstract_id=3551767
Yao, Y., Pan, J., Liu, Z., Meng, X., Wang, W., Kan, H., & Wang, W. (2020). No Association of COVID-19 transmission with
   temperature or UV radiation in Chinese cities. European Respiratory Journal, 55, 2000517.
Zhu, Y., & Xie, J. (2020). Association between ambient temperature and COVID-19 infection in 122 cities from China. Science
   of the Total Environment, 724, 138201.

Cite this article: Si X, Bambrick H, Zhang Y, Cheng J, McClymont H, Bonsall MB, Hu W (2021). Weather variability and
transmissibility of COVID-19: a time series analysis based on effective reproductive number Experimental Results, 2, e15,
1–10. https://doi.org/10.1017/exp.2021.4
Peer Reviews
Reviewing editor: Dr. Michael Nevels
University of St Andrews, Biomolecular Sciences Building, Fife, United Kingdom of Great Britain and Northern Ireland, KY16
9ST

This article has been accepted because it is deemed to be scientifically sound, has the correct controls, has
appropriate methodology and is statistically valid, and has been sent for additional statistical evaluation and met
required revisions.

doi:10.1017/exp.2021.4.pr1

Review 1: Weather variability and COVID-19 transmission rates: a time series analysis based on
effective reproductive number

Reviewer: Dr. Yiqun Ma
Yale University School of Public Health, Environmental Health Sciences, 60 College Street, New Haven, Connecticut, United
States, 06520-8034

Date of review: 31 January 2021

© The Author(s), 2021. Published by Cambridge University Press. This is an Open Access article, distributed under the terms of
the Creative Commons Attribution licence (http://creativecommons.org/licenses/by/4.0/), which permits unrestricted re-use,
distribution and reproduction, provided the original article is properly cited.

Conflict of interest statement. Reviewer declares none.

Comments to the Author: This study investigated the effects of air temperature and relative humidity on
SARS-CoV-2 transmission in Wuhan, China. Great improvements have been made in this manuscript,
such as the brief review of existing studies, the sensitivity analyses by testing different degrees of freedom,
and more justification in the discussion part. There are several minor issues needed to be addressed
before publication:
    1. The authors used lag of 5 days for temperature and 8 days for RH in the statistical model.
Explanations on how these lag durations were chosen is necessary. In addition, the selection of lag
period could influence the final estimates. Sensitivity analyses using different lags are needed.
    2. Line 94-96, it is good to perform these sensitivity analyses, but please display model statistics to
support this statement.
    3. In the description of the GAM, it is unclear which type of smoothing basis was used (i.e., bs=? in the
s(.))?
    4. There are still several typos in the text (e.g., line 49, “tete”), please check again in the revision.

Score Card
Presentation
                    Is the article written in clear and proper English? (30%)                                           ● 4/5

                                                                                                                        ●
    4.0
     /5             Is the data presented in the most useful manner? (40%)                                                4/5
                    Does the paper cite relevant and related articles appropriately? (30%)                              ● 4/5
Context
Does the title suitably represent the article? (25%) ●
4/5
●
4.5
/5 Does the abstract correctly embody the content of the article? (25%) 5/5
Does the introduction give appropriate context? (25%) ●
4/5
Is the objective of the experiment clearly defined? (25%) ●
5/5
Analysis
Does the discussion adequately interpret the results presented? (40%) ●
4/5
●
4.4
/5 Is the conclusion consistent with the results and discussion? (40%) 5/5
●
Are the limitations of the experiment as well as the contributions of the
experiment clearly outlined? (20%) 4/5doi:10.1017/exp.2021.4.pr2
Review 2: Weather variability and COVID-19 transmission rates: a time series analysis based on
effective reproductive number
Reviewer: Dr. El-Sayed Atlam
Date of review: 02 February 2021
© The Author(s), 2021. Published by Cambridge University Press. This is an Open Access article, distributed under the terms of
the Creative Commons Attribution licence (http://creativecommons.org/licenses/by/4.0/), which permits unrestricted re-use,
distribution and reproduction, provided the original article is properly cited.
Conflict of interest statement. The paper has no Conflicts of Interest
Comments to the Author: • The manuscript can be checked by native English speaker
• The main contribution and originality should be explained in more detail, is it the use of Bayesian
Estimation? or the found associations?
• Discussion of related work in COVID-19 should be expanded with more recent work, this will better
situate this paper in the context of the journal
• This paper has quite a few issues to check and perhaps to correct. But one major issue is to have and
to support reproducibility of this work, to have comprehensive evaluation and applications carried out,
from this work here.
• The wider interpretation of the results can be added for the better understanding of the analysis.
• A comparison with other methods should be explained with more detail to show the effectiveness of
using the new approach== for example with the following two references:
1- Association between Weather Data and COVID-19 Pandemic Predicting Mortality Rate: Machine
Learning Approaches, Zohair Malki, El-Sayed Atlama, Aboul Ella Hassanien, Guesh Dagnew, Mostafa
A. Elhosseini and Ibrahim Gad, Journal of Chaos, Solitons &Fractals, Vol. 138,110137,2020.
2- ARIMA Models for Predicting the End of COVID-19 Pandemic and the Risk of a Second Rebound,
Zohair Malki, El-Sayed Atlam, Ashraf Ewis, Guesh Dagnew, Ahmad Reda Alzighaibi, ELmarhomy
Ghada, Mostaf A. Elhosseini, Aboul Ella Hassanien, Ibrahim Gad., May 27,2020, Journal of Neural
Computing and Applications, May 272020-Accepted Oct.8th,2020.
oMany references are old and recent references should be appended for good comparison to related
works.
Score Card
Presentation
Is the article written in clear and proper English? (30%) ● 3/5
●
3.0
/5 Is the data presented in the most useful manner? (40%) 3/5
Does the paper cite relevant and related articles appropriately? (30%) ● 3/5
Context
Does the title suitably represent the article? (25%) ● 3/5
●
2.8
/5 Does the abstract correctly embody the content of the article? (25%) 2/5
Does the introduction give appropriate context? (25%) ● 3/5
Is the objective of the experiment clearly defined? (25%) ● 3/5Analysis
Does the discussion adequately interpret the results presented? (40%) ●
4/5
●
3.6
/5 Is the conclusion consistent with the results and discussion? (40%) 3/5
●
Are the limitations of the experiment as well as the contributions of the
experiment clearly outlined? (20%) 4/5You can also read