Climatology of surface baroclinic zones in the coast of Brazil
←
→
Page content transcription
If your browser does not render page correctly, please read the page content below
Atmósfera 32(2), 129-141 (2019)
doi: 10.20937/ATM.2019.32.02.04

               Climatology of surface baroclinic zones in the coast of Brazil

                Gustavo Carlos Juan ESCOBAR1*, Michelle Simôes REBOITA2 and Amanda SOUZA2

1
  Centro de Previsão de Tempo e Estudos Climáticos (CPTEC), Instituto Nacional de Pesquisas Espaciais (INPE),
  Rodovia Dutra, km 39 Cachoeira Paulista, SP, 12630-000, Brazil.
2
  Instituto de Recursos Naturais, Universidade Federal de Itajubá, Av. BPS, 1303, Itajubá, Minas Gerais, MG, 37500-
  903, Brazil.
* Corresponding author: gustavo.escobar@inpe.br

                                     Received: June 29, 2018; accepted: February 26, 2019

                                                               RESUMEN
     Este trabajo presenta las diferencias entre frentes fríos clásicos, frentes subtropicales y vaguadas baroclínicas
     mediante el uso de cartas sinópticas, así como una climatología de estos sistemas en la costa este de Brasil. En
     lo que se refiere a la estacionalidad de los sistemas analizados, los frentes fríos clásicos son más frecuentes en
     invierno, seguido por la primavera, mientras que los frentes subtropicales ocurren preferentemente en prima-
     vera y las vaguadas baroclínicas en primavera y verano. En el sudeste de Brasil, estos tres tipos de sistemas
     baroclínicos son responsables del 40% (60%) de la precipitación total durante la estación lluviosa (seca).

                                                              ABSTRACT
     This study presents the main differences between classical cold fronts, subtropical fronts and baroclinic
     troughs, as well as a climatology of these systems along the coast of Brazil. Regarding the seasonality of
     these systems, classical cold fronts are more frequent in winter followed by spring, subtropical fronts in
     spring, and baroclinic troughs in spring and summer. In southeastern Brazil, these three kinds of systems are
     responsible for about 40% (60%) of the total precipitation during the rainy (dry) season.

     Keywords: Classical cold fronts, subtropical fronts, baroclinic troughs.

1. Introduction                                                          by systems with a sharp wind shift and a narrow
Surface baroclinic zones are the most important                          line of cumulonimbus convection at the surface
meteorological systems that modify the weather in                        front (Browning and Harrold, 1970; Hobbs et al.,
the extratropical and subtropical latitudes of South                     1980). Moreover, the discontinuities in the air
America. Cold fronts occur throughout the year over                      temperature are simultaneous with the wind shift
the extratropical zones of the continent, being more                     and coincident with the pressure trough (Schultz,
frequent during the winter, when the polar air mass                      2005). Browning and Monk (1982) also mention
also reaches these latitudes.                                            that the strong vertical motion at the surface front
    The term front refers to the interface between                       occurs in association with a broader region of up-
air masses of different thermal characteristics near                     gliding warm moist air above a wedge of cold air
the surface (Bjerknes and Solberg, 1922; Taljaard,                       behind the front. As polar cold fronts have all these
1972). There are four kinds of fronts: cold, warm, oc-                   features, they are frequently called classical cold
cluded and stationary. Cold fronts are characterized                     fronts (Bjerknes, 1919).

                           © 2019 Universidad Nacional Autónoma de México, Centro de Ciencias de la Atmósfera.
                 This is an open access article under the CC BY-NC License (http://creativecommons.org/licenses/by-nc/4.0/).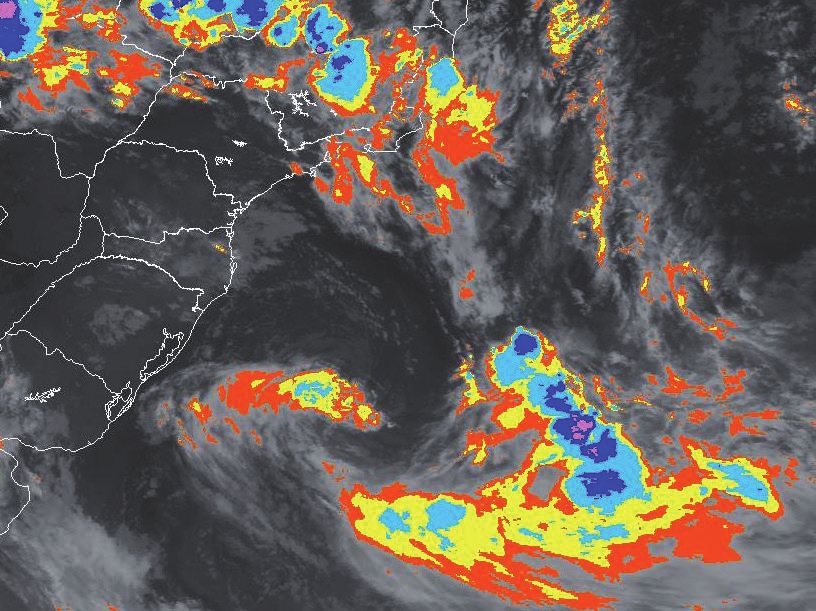
130                                            G. C. J. Escobar et al.

    Considering South America and, more specifically            There is nothing in the atmospheric science lit-
Brazil, classical cold fronts that reach this country       erature that treats the issue of the different surface
lose their thermal contrast (weakening of the hori-         baroclinic zones (classical cold fronts, subtropical
zontal temperature gradient) as they move toward the        fronts and baroclinic troughs) over Brazil. The studies
southeast and northeast Brazilian regions in lower          of cold front climatology in South America do not dis-
latitudes. Therefore, these fronts lose their character-    tinguish these kinds of systems and include all of them
istic of classical cold fronts. Kousky (1979) was the       in the same dataset to compute statistics (Andrade,
first researcher to call these fronts that weaken near      2005, 2017; Cavalcanti and Kousky, 2009; Silva et
the east coast of Brazil, subtropical fronts. After the     al., 2014; Foss et al., 2017). Therefore, a climatolo-
pioneering study of Kousky, the theme subtropical           gy of each kind of system would be very useful for
fronts remained “asleep” in the literature.                 Brazilian weather forecasters since it would indicate
    Another surface baroclinic zone, which in general       the seasonality and preferential regions of these ba-
has a weak horizontal temperature gradient, but that        roclinic systems. In this context, the purpose of this
can produce heavy rains along the east coast of the         study is to establish a climatology of the three types
south and southeast regions of Brazil, is the baroclinic    of surface baroclinic zones along the coast of Brazil.
trough. The main difference of these systems regard-        For this reason, we applied the criteria (described
ing the classical cold fronts is that in the troughs the    below) recently developed by the weather forecasters
cloudiness and the area of precipitation is located         from the Brazilian Center for Weather Forecast and
ahead of the system (Sanders, 2005), while in clas-         Climate Studies, National Institute for Space Research
sical cold fronts, the cloudiness and the precipitation     (CPTEC-INPE). Then we performed a new analysis of
occur on the colder side of the wind shift.                 CPTEC-INPE synoptic charts (which are constructed
    Sanders (2005) highlighted that in synoptic             with Global Forecast System [GFS] analysis since
charts of operational meteorological centers, several       2010) to properly classify the classical cold fronts,
atmospheric systems are erroneously identified. For         subtropical fronts and baroclinic troughs.
example, classical cold fronts are drawn in regions
without strong horizontal temperature gradients             2. Data
and, sometimes, there are extreme examples in               Classical cold fronts, subtropical fronts and baroclin-
which these systems are represented in regions              ic troughs were identified in eight cities along the
with a nocturnal temperature rise. Many of the              coast of Brazil: Porto Alegre (Rio Grande do Sul, RS),
cold fronts drawn on surface synoptic charts of             São Paulo (São Paulo, SP), Rio de Janeiro (Rio de
Brazil’s operational meteorological centers are also        Janeiro, RJ), Vitória (Espirito Santo, ES), Caravelas,
erroneously identified because they do not show             Porto Seguro, Ilhéus, and Salvador (Bahia, BA). For
a significant horizontal temperature gradient. In           this purpose, the surface and upper synoptic charts at
several cases, these systems should be identified as        00:00 UTC, 06:00 UTC, 12:00 UTC and 18:00 UTC,
baroclinic troughs instead of cold fronts. Bjerknes         between 2010 and 2016, from the CPTEC-INPE were
(1919) understood that in the classical cold fronts,        used. Cloudiness associated with the three different
the wind shift must be accompanied by a significant         kinds of systems was identified through the bright-
horizontal temperature gradient. This means, for            ness temperature (K) from GOES (10, 12, and 13)
example, that without the significant horizontal            geostationary satellites (data from the Satellite and
temperature gradient the wind shift from the north          Environmental System Division [CPTEC], INPE).
to south quadrant in the Southern Hemisphere does           Furthermore, daily precipitation data from São Pau-
not represent a classical cold front. The main prob-        lo city (23.6º S, 46.6 ºW) provided by the National
lem of all weather forecasters around the world is          Meteorological Institute, Brazil (INMET) were used.
to define what is a significant horizontal tempera-
ture gradient in surface maps, especially in Brazil,
where approximately 70% of the country is located           3. Methodology
in subtropical and tropical regions. Sanders (2005)         The magnitude of the horizontal temperature
mentions that this definition is arbitrary.                 gradients associated with baroclinic zones may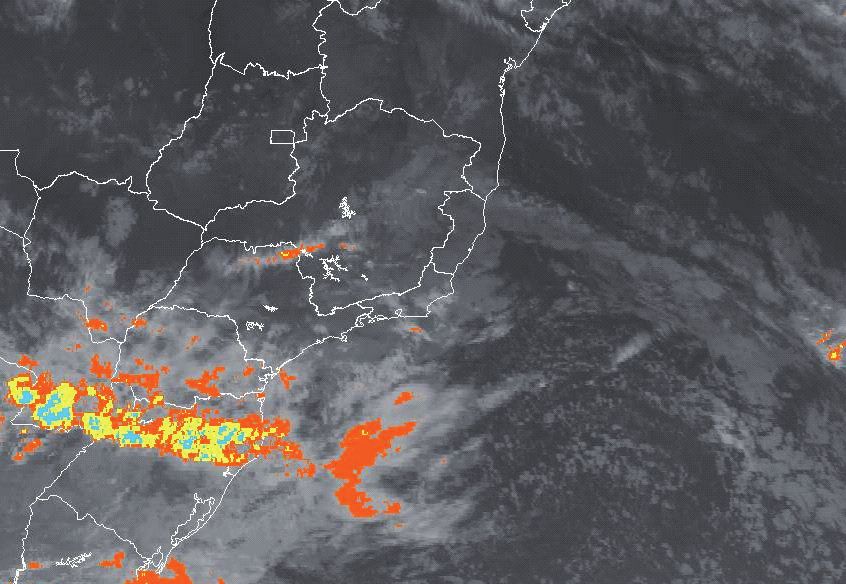
Climatology of surface baoclinic zones in the coast of Brazil                         131

vary by region, season and meteorological                     b. A moderate or strong horizontal dew point tem-
events. Therefore, this variable is not the only                 perature gradient at surface.
that should be analyzed for the identification of             c. A polar jet stream (250 hPa) associated with the
the different kinds of baroclinic zones. Weath-                  surface cold front (sometimes the subtropical jet
er forecasters must also analyze the horizontal                  stream can appear coupled with the polar jet)
pressure gradient, the direction and intensity                   (Fig. 1b).
of the wind, the air humidity, the presence of                d. An abrupt wind shift in the cyclonic sense
the polar jet and the cloud cover. Thus, the use                 (Fig. 1a).
of automated analyses is not adequate (given that             e. Cloudiness and precipitation behind the cold front
they are very hard to implement computationally                  (Fig. 1c).
when there is great number of criteria) to distin-
guish the different types of baroclinic systems. In           3.2 Subtropical fronts
this way, we highlight the necessity of employing             In synoptic charts, a subtropical front presents the
the knowledge and experience of the weather                   following features:
forecasters to identify the different baroclinic
systems. Cold fronts are always associated with               a. A weak horizontal temperature gradient at sur-
a more intense horizontal temperature gradient                   face or weak horizontal 1000-500 hPa thickness
than subtropical ones and baroclinic troughs. Ac-                gradient (Fig. 2). In other words, the distance
cording to the practical experience of the weather               between the isolines is higher than that shown in
forecasters from the CPTEC-INPE, cold fronts                     Figure 1a.
have a horizontal temperature gradient defined as             b. Weak or nonexistent horizontal dew point tem-
at least 3 ºC (100 km–1). Moderate or strong gradi-              perature gradient at surface (Fig. 2).
ents are defined as at least 5 ºC (100 km–1). On the          c. Gradual wind shift in the cyclonic sense (Fig. 2).
other hand, the subtropical fronts and the baroclinic         d. Subtropical jet stream (250 hPa) or polar jet cou-
troughs show weak horizontal temperature gradient,               pled with subtropical jet, but far from the front at
defined as at least 2 ºC (100 km–1). We highlight                surface (Fig. 3a).
again that these values may vary according to the             e. Cloudiness and precipitation behind of the subtrop-
region of occurrence, season and baroclinic system.              ical front (Fig. 3b) similar to a cold front (Fig. 1c).
    In the present study, we used the criteria devel-
oped by the weather forecasters from CPTEC-INPE               3.3 Baroclinic troughs
(presented in the next paragraphs) to identify classical      A baroclinic trough has the following features in the
cold fronts, subtropical fronts and baroclinic troughs.       synoptic charts:
In the following section some synoptic charts are
shown to illustrate the features of the three different       a. Weak horizontal temperature gradient at surface
systems. These charts are constructed with GFS anal-             or weak horizontal 1000-500 hPa thickness gra-
ysis and surface data from synoptic weather stations.            dient (Fig. 4).
Moreover, the charts show the synoptic systems                b. Usually, they are the cold fronts of extratropical
drawn by the meteorologists.                                     cyclones with a weak baroclinicity represented
                                                                 throughout a weak horizontal 1000-500 hPa
3.1 Classical cold fronts                                        thickness gradient (Fig. 4).
A classical cold front is identified in the synoptic          c. Strong horizontal gradient of humidity and/or
charts when there are:                                           total precipitable water; dew point temperature,
                                                                 specific humidity and equivalent potential tem-
a. A moderate or strong horizontal temperature                   perature.
   gradient at surface, that in the analysis region           d. Gradual wind shift in the cyclonic sense.
   can be considered greater than 3 ºC 100 km–1, or           e. Subtropical jet stream associated with the baro-
   a significant horizontal 1000-500 hPa thickness               clinic trough at surface (Fig. 5a). The polar jet
   gradient (Fig. 1a).                                           stream is not associated with this system.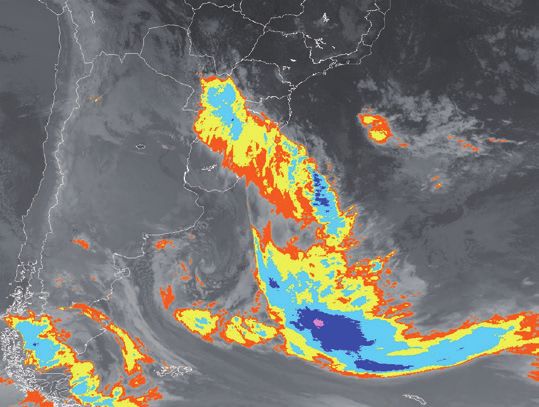
132 G. C. J. Escobar et al.
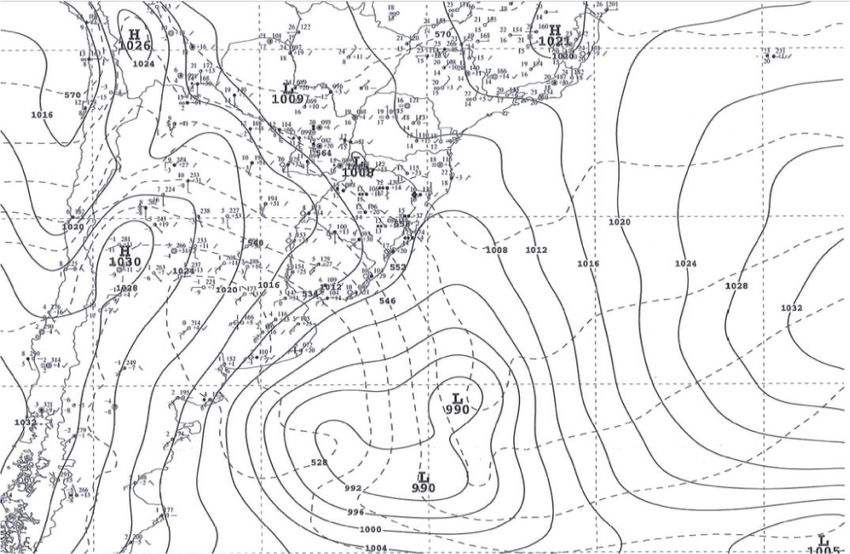
(a) 12/07/2010 12 Z
Strong
horizontal
temperature 1020
gradient 1008 1012
1024
1016 1028
1032
H
H
992 L
996
1004 1000
Fig. 1. Synoptic fields at 12:00 UTC on July 12,
Legend Legend 2010 showing the features of a classical cold front.
L low pressure system
Subtropical jet (a) Surface synoptic chart showing sea-level pres-
H high pressure system
North branch of polar jet Mean sea level pressure sure (hPa, black line), thickness between 1000-500
South branch of polar jet Thickness 500/1000 hPa hPa (dashed lines), the fronts position (cold front
(b) (c) in blue, warm front in red and occluded front in
purple) and surface data from synoptic weather
Clouds
stations plotted in conventional model. (b) Synop-
behind tic chart at 250 hPa showing geopotential height in
cold front tens of meters (white lines), streamlines (light blue
Polar L lines), isotachs (kts, green shaded), upper level
jet
jets stream position and upper-data from synoptic
weather stations plotted in conventional model.
–80 –70 –60 –50 –40 –30
(c) Brightness temperature (oC) from GOES-13
70 90 110 130 150 170 ms–1 Temp. Celsius (data from the CPTEC, INPE).
19/05/2013 00 Z
Zoom
1021
1024
Legend
H high pressure system
Mean sea level pressure
Thickness 500/1000 hPa
H
1027
Fig. 2. Synoptic chart at 00:00 UTC on May 19, 2013 showing the features of a typical subtropical front. Sea level
pressure (hPa) is represented with continuous black lines and 1000-500 hPa thickness (black dashed lines). Synoptic
symbols plotted in conventional model are also shown in the figure. The zoom emphasizes that the values in the syn-
optic chart have weak dew point temperature gradient (see orange boxes, for example).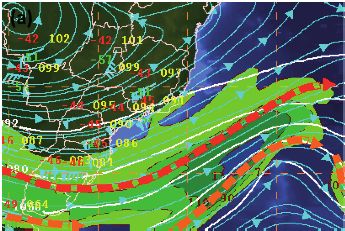
Climatology of surface baoclinic zones in the coast of Brazil                                        133

(a)

                                                                Legend
                                                                         Subtropical jet
                                                                         North branch of polar jet
                                                                         South branch of polar jet
        70     90    110    130    150    170   ms–1                                                   Fig. 3. Synoptic fields at 00:00 Z on May 19,
                                                                                                       2013 showing the features of a typical subtropical
(b)
                                                                                                       front. (a) Synoptic chart at 250 hPa showing the
                                                                                                       geopotential height in tens of meters (white lines),
                                    Clo                                                                streamlines (light blue lines), isotachs (kts; green
                                  sub uds b                                                            shaded), upper level jets stream position with
                                     trop ehin
                                         ica
                                             l fro d                                                   the subtropical jet indicated by the red color and
                                                  nt
                                                                                                       the and upper-level data from synoptic weather
                                                                                                       stations plotted in conventional model. (b) Bright-
                                                                                                       ness temperature (oC) from GOES-13 (data from
  –80        –70    –60    –50     –40    –30   Temp. Celsius                                          CPTEC, INPE).

                                                                                                              05/03/2016 00 Z

                                                                                             5760

                                                                                      1004

                                                                                                                    1016
                                                                5640                    L

                                                                                                                           1020

                                                                                             1008
                                                                                                                             1024

                                                                                                                              1028
                                                                                                                    5580

                                                                                                     Legend
                                                                                                         L    low pressuresystem
                                                                                                              Mean sea level pressure
                                                                                                              Thickness 500/1000 hPa

                                         Fig. 4. Synoptic chart at 00:00 UTC on March 5, 2016. Sea level
                                         pressure (hPa) is represented with continuous black lines and 1000-
                                         500hPa thickness in black dashed lines. Synop symbols plotted in
                                         conventional model are also shown in the figure.
134 G. C. J. Escobar et al.
(a)
70 90 110 130 150 170 ms–1
Legend
Subtropical jet
North branch of polar jet
South branch of polar jet
(b)
Clouds
ahead the
system
–80 –70 –60 –50 –40 –30 Temp. Celsius
Fig. 5. Synoptic fields at 00:00 UTC on March 5, 2016. (a) Synoptic
chart at 250 hPa showing the geopotential height in tens of meters (white
lines), streamlines (light blue lines), upper level jets stream position and
upper data from synoptic weather stations plotted in conventional model.
(b) Brightness temperature (oC) from GOES-13 (from CPTEC, INPE).
f. Cloudiness and precipitation occur ahead of troughs it occurs on the warm side of these systems.
the trough (Fig. 5b), in the warmer side of the As mentioned in Sanders (2005), most of the weather
system. forecasters confuse baroclinic troughs with classical
g. In many cases, baroclinic troughs are associated cold fronts because in both there are cloudiness
with South Atlantic Convergence Zone (SACZ) bands. Table I summarizes the principal differences
events (Carvalho et al., 2004). between the three types of surface baroclinic zones.
In summary, the main differences between classi- 3.4 Methods
cal cold fronts and baroclinic troughs over the South- After the identification of the different baroclinic
ern Hemisphere can be observed in Figure 6 (adapted systems with the criteria presented, the total number
from Sanders, 2005). Classical cold fronts are as- of classical cold fronts, subtropical fronts and baro-
sociated with more intense horizontal temperature clinic troughs passing by the eight cities along the
gradient over their cold side than baroclinic troughs. Brazilian coast from 2010 to 2016 were computed.
Moreover, clouds and precipitation also occur on the Furthermore, the monthly and seasonal averages
cold side of the frontal systems while in baroclinic (summer from December to February; autumn fromClimatology of surface baoclinic zones in the coast of Brazil 135
March to May; winter from June to August, and
(a) Real cold front (b) Baroclinic trough spring from September to November) of these sys-
tems were determined.
From the eight studied cities, three (São Paulo,
Rio de Janeiro and Vitória) have well defined dry
(from May to September) and wet (from October to
April) seasons (Kousky, 1988; Reboita et al., 2010;
Marengo et al., 2012). Hence, for these cities we also
computed the total number of systems for dry and
wet periods from 2010 to 2016.
In order to estimate the percentage of precipitation
associated with each kind of system in the region with
a well-defined dry and wet period, São Paulo was
Legend
the city chosen for this analysis. For this reason, the
Surface isotherms
Wind direction in surface
same methodology by Silva et al. (2014), de Jesus et
Cold front al. (2016) and Andrade (2017) was applied, i.e., the
Baroclinic trough
Area with clouds and precipitation precipitation from a classical cold front is one that
occurs in the period between a day before (pre-frontal
Fig. 6. (a) Schematic sketches of a real cold front and (b)
rain) and a day after (post-frontal rain) the passage
a baroclinic trough for the Southern Hemisphere. Adapted
of the cold front. The same method was applied for
from Sanders (2005).
the precipitation associated with subtropical fronts
and baroclinic troughs.
Table I. Main properties associated with the three analyzed surface baroclinic zones over South America and the South
Atlantic Ocean. The last two lines of the table include the results obtained in this work.
Properties Classical cold front Subtropical front Baroclinic trough
Horizontal temperature Located ahead of Located ahead of Located ahead of
gradient at surface an intense gradient a weak gradient a weak gradient
Horizontal 1000-500 hPa Located ahead of an Located ahead of a Located ahead of a
thickness gradient intense gradient weak gradient weak gradient
Horizontal dew point
Located ahead of an Located ahead of a Located ahead of a strong
temperature gradient at
intense gradient weak gradient or moderate gradient
surface
Wind Abrupt in the cyclonic Gradual in the Gradual in the
shift sense cyclonic sense cyclonic sense
Subtropical jet or polar jet
Upper level Polar jet or subtropical coupled with subtropical jet, Subtropical
jet stream jet coupled with polar jet but far from the front jet
in surface
Cloudiness and Behind of the Behind of the Ahead of
precipitation frontal system frontal system the system
Preferential latitude South of 20º S Between 25º-15º S Between 25º-15º S
Most frequent period
Winter Spring Spring/summer
season of the year136 G. C. J. Escobar et al.
4. Results studied (Fig. 8a, d). This result is associated with the
4.1 Mean annual frequency position of the polar jet during the year. In the austral
The annual mean and the total number of classical winter (summer), this jet reaches the most northerly
cold fronts, subtropical fronts and baroclinic troughs (southerly) position and, consequently, the classical
for each city are shown in Figure 7. The frequency cold fronts follow it. Due to this seasonal pattern,
of classical cold fronts decreases from the south to cold fronts reach more frequently Brazil in winter.
the northeast coast of Brazil, while the frequency The findings here agree partly with other works
of subtropical fronts increases in this direction. On about cold fronts in Brazil, such as Cavalcanti and
the other hand, baroclinic troughs are more frequent Kousky (2009) and Foss et al. (2017). These works,
along southeastern Brazil (20o-15o S). The highest in general, used an automatic method based on the
annual mean of classical cold fronts is registered in change of the wind direction from north to south
Porto Alegre (48 systems/year), of subtropical fronts quadrant to identify cold fronts. This criterion togeth-
in Vitória (~6 systems/year) and of baroclinic troughs er with changes in air temperature and pressure are
is São Paulo and Rio de Janeiro (11 systems/year). not enough to classify cold fronts as classical ones.
Other systems can be included in the statistics, like
4.2 Monthly and seasonal frequency a trough, which is also associated with change in the
Figure 8 shows the monthly and seasonal frequency wind direction, but it does not have a strong horizon-
of classical cold fronts, subtropical fronts and ba- tal temperature gradient at surface. For this reason,
roclinic troughs for each city. Cold fronts are more those works show higher frequency of cold fronts in
frequent in winter followed by spring in all the cities spring in southeastern Brazil. We emphasize that to
Porto Alegre
2/5/2
(0.3/0.7/0.3) São Paulo
Rio de Janeiro
EQ
2/6/3 Vitoria
(0.3/0.9/0.4)
Caravelas
8/13/13 Porto Seguro
(1.1/1.9/1.9) Ilhéus
Salvador
Brazil 16/33/14
(2.3/4.7/2)
15S
69/40/45 Legend
(9.9/5.7/6.4)
In the color boxes:
Total number of systems
176/24/78 Annual average of systems
(25.1/3.4/11.1)
Order:
30S 176/24/78 Cold f. / subtropical f. / troughs
(25.1/3.4/11.1)
337/2/40
(48.1/0.3/5.7)
75W 60W 45W 30W 15W
Fig. 7. Annual mean and total of classical cold fronts, subtropical fronts and baroclinic troughs by city
in the period 2010-2016. The initial part of the arrows indicates the cities location. The frequency of
the systems is shown in color boxes. The first line in each box indicates the total number of systems
while the second one, the annual mean.Climatology of surface baoclinic zones in the coast of Brazil 137
guarantee the presence of a classical cold front it is from the south of the continent. Consequently, by
necessary to analyze the synoptic charts. conservation of absolute vorticity, the upper level
Regarding subtropical fronts, these systems are trough that is ahead of the ridge also intensifies and
more frequent in spring, except in Porto Alegre, amplifies over the Atlantic Ocean (Kousky and Gan,
where this kind of front essentially does not occur 1981). During this atmospheric configuration, some
(Fig. 8b, e). The seasonality of subtropical fronts may classical cold fronts can advance to lower latitudes,
be related with the presence of the Bolivian High mainly over the ocean, becoming subtropical fronts.
during spring. This high has an associated ridge, Baroclinic troughs occur preferentially in
which intensifies and amplifies towards the South spring and summer and are less frequent in winter
Atlantic Ocean due to the strong pre-frontal warm (Fig. 8c, f). Most of these surface systems are as-
advection caused by the frontal systems coming sociated with the displacement of a trough in the
(a) Classical cold fronts 15 (d) Classical cold fronts
6
5
Average Number
Average Number
4 10
3
2 5
1
0 0
J F M A M J J A S O N D S A W S
(b) Subtropical fronts (e) Subtropical fronts
1.5 3
2.5
Average Number
Average Number
1 2
1.5
0.5 1
0.5
0 0
J F M A M J J A S O N D S A W S
(c) Baroclinic troughs (f) Baroclinic troughs
2.5 5
Average Number
2 4
Average Number
1.5 3
1 2
0.5 1
0 0
J F M A M J J A S O N D
S A W S
Porto Alegre
São Paulo
Rio de Janeiro
Vitória
Caraelas
Porto Seguro
IIhéus
Salvador
Fig. 8. Monthly and seasonal mean (2010-2016) of classical cold fronts, subtropical fronts and baroclinic troughs in
the eight studied cities.138 G. C. J. Escobar et al.
middle troposphere that moves mainly from west to east of Brazil: 104 systems in São Paulo, 77 in Rio
east. In general, the surface troughs are coupled with de Janeiro and 53 in Vitória (Fig. 9a). Indeed, the dry
the subtropical jet stream in upper levels that, when period occurs concomitantly with the austral winter
interacting with a humid and warm air mass, organize and it contributes to an environment favorable to the
a band of cloudiness. In this situation, the latent heat cold fronts occurrence. The frequency of subtropical
released by condensation can contribute to develop fronts is slightly higher during the dry season than
a low-pressure system in the surface, i.e., a cycloge- in the rainy season (Fig. 9b); this small difference
netic process (Evans and Braun, 2012; Gozzo et al., can be associated with the influence of September,
2014). Most of these systems are weak extratropical inside the dry season, and October, inside the rainy
cyclones, but in some cases, they can be subtropical season, which are months with great frequency of
cyclones (which are more frequent during the rainy subtropical fronts (Fig. 8b). During the dry season,
season of Brazil [Gozzo et al., 2014]). the number of subtropical fronts detected was 15 in
São Paulo, 18 in Rio de Janeiro and 21 in Vitória
4.3 Dry and rainy season in southeastern Brazil (Fig. 9b). Baroclinic troughs show an opposite be-
Since Brazil has a large territory, it experiences dif- havior to classical cold fronts, meaning that these
ferent climate regimes (Reboita et al., 2010). In the systems are more frequent during the rainy season.
southeastern region, the most populated of the coun- From 2010 to 2016, during the rainy season, 61,
try, a rainy season from October to April and a dry 47, and 43 baroclinic troughs were observed in
season from May to September (Kousky, 1988; Re- São Paulo, Rio de Janeiro and Vitória, respectively
boita et al., 2010; Marengo et al., 2012) predominate. (Fig. 9c). According to the CPTEC-INPE forecasters
Due to this feature, we also identified the frequency experience, the number of troughs during the rainy
of baroclinic zones in the dry and wet periods (2010- season is large and they are associated with the oc-
2016) in São Paulo, Rio de Janeiro and Vitória (Fig. currence of the SACZ.
9), which are cities located in southeastern Brazil as The percentage of precipitation associated with
shown in Figure 7. each of the three systems in relation to the total pre-
The highest number of classical cold fronts occur cipitation of the rainy and dry seasons was computed
during the dry season for all three cities in the south- for São Paulo city (Fig. 10). According to Figure 9,
(a) Classical cold fronts (b) Subtropical fronts
120 120
100 100
80 80
60 60
40 40
Total number of systems
20 20
0 0
São Paulo Rio de Janeiro Vitória São Paulo Rio de Janeiro Vitória
(c) Baroclinic troughs
120
100
80 Rainy season
60 Dry season
40
20
0
São Paulo Rio de Janeiro Vitória
Fig. 9. Total number (2010-2016) of classical cold fronts, subtropical fronts and baroclinic
troughs in the rainy (October-April) and dry (May-September) seasons from 2010 to 2016, in
three cities in southeastern Brazil.Climatology of surface baoclinic zones in the coast of Brazil 139
during the rainy season in São Paulo there are more agrees with other studies such as the one by Silva
cold fronts and baroclinic troughs than subtropical et al. (2014), who established a climatology of cold
fronts. This result impacts directly on precipitation, fronts for a city in southeastern Brazil using the
since these two baroclinic zones amount to 36.2% changes in wind direction to identify the systems.
of precipitation. The contribution of subtropical As mentioned before, this criterion does not allow
fronts to precipitation during the rainy season is only the separation of subtropical fronts and baroclinic
1.6% (Fig. 10). During the dry season, the number troughs from classical cold fronts. For this reason,
of classical cold fronts in São Paulo is higher than the total precipitation associated with cold fronts in
the other two baroclinic systems (Fig. 9). However, those studies is similar to the sum of precipitation
precipitation in this period is associated mainly with provided here by classical cold fronts, subtropical
baroclinic troughs, 45.6% of the total (Fig. 10). A fronts and baroclinic troughs.
possible explanation of this behavior can be related
to the combination of baroclinic troughs with higher
temperatures observed over the southeastern region 5. Conclusions
of Brazil during the end of the dry season (August A climatology of the principal surface baroclinic
and September). In this time of the year, convection zones (classical cold fronts, subtropical fronts and
becomes more frequent over São Paulo city and this baroclinic troughs) along the coast of Brazil was
factor can be responsible for more rain than that pro- established through the application of criteria based
duced by cold fronts during the beginning of the dry on traditional synoptic charts.
season (May, June and July). At the beginning of the The main difference between the three analyzed
dry season, air masses are very dry in the southeastern surface baroclinic zones is related to the horizontal
region of Brazil, and the transients cannot produce temperature gradient. Classical cold fronts show a
significant volumes of rain. In Figure 10, the “other moderate or strong horizontal temperature gradi-
systems” classification refers to the instability pro- ent in relation to subtropical fronts and baroclinic
duced by the combination of high temperatures and troughs. We highlighted that it is very hard to define
the presence of a humid air mass and by the passage thresholds for the horizontal temperature gradient
of cyclonic disturbances in the middle troposphere. associated with different systems, since it depends
In a more global analysis, during the rainy season on the region of occurrence, the season and meteoro-
almost 40% of the precipitation is associated with logical event. For this reason, to classify baroclinic
the three baroclinic systems while in the dry season systems other features need to be analyzed. For
this number increases to 60% (Fig. 10). This result example, cloudiness occurs ahead of the baroclinic
troughs, while it occurs behind in classical cold
fronts and subtropical fronts.
Percentage of precipitation - São Paulo Classical cold fronts are more frequent in winter
70
followed by spring in all the studied cities, while
Rainy season
60
Dry season
subtropical fronts occur preferentially in spring and
50 in cities located along the southeast of Brazil. On the
Percentage (%)
40 other hand, baroclinic troughs are more frequent in
30
spring and summer and in the south and southeast
regions of Brazil.
20
In southeastern Brazil, classical cold fronts and
10
subtropical fronts are more frequent during the dry
0
Cold Subtropical Baroclinic Other
season, while baroclinic troughs occur more often
fronts fronts trough systems during the rainy period; however, the latter have also
Fig. 10. Percentage of precipitation (%) associated with a great contribution to total precipitation at the end
classical cold fronts, subtropical fronts, baroclinic troughs of the dry season. In São Paulo city, during the dry
and other systems during the dry and rainy seasons (2010- season baroclinic troughs justify 45.6% of the total
2016) in São Paulo city. precipitation while in the rainy season this value is140 G. C. J. Escobar et al.
16.6%. Considering the three surface baroclinic zones Soc. 108, 435-452. DOI: 10.1002/qj.49710845609
together, baroclinic troughs are responsible for about Carvalho L.M.V, Jones C. and Liebmann B., 2004. The
40% (60%) of the total precipitation during the rainy South Atlantic convergence zone: Intensity, form, per-
(dry) season. sistence, and relationships with intraseasonal to interan-
Finally, in order to improve the knowledge and nual activity and extreme rainfall. J. Climate 17, 88-108.
criteria for identification of the different baroclinic DOI: 10.1175/1520-0442(2004)0172.0.
zones, a statistical analysis of the magnitude of hori- CO;2
zontal gradients in different meteorological variables Cavalcanti I.F.A. and Kousky E.V., 2009. Cold fronts
should be carried out. on Brazil. In: Weather and climate in Brazil, cap. 9
(Cavalcanti I.F.A., Ferreira N.J., da Silva M.G.A.J.
and Dias M.A.F.S., Eds.). Oficina de Textos, São
Acknowledgments Paulo, 135-146.
The authors thank the CPTEC/INPE of Brazil for De Jesus E.M., da Rocha R.P., Reboita M.S., Llopart M.,
the synoptic charts and satellite images, the INMET Dutra L.M.M. and Remedio A.R.C., 2016. Contribu-
for precipitation data and the Conselho Nacional de tion of cold fronts to seasonal rainfall in simulations
Desenvolvimento Científico e Tecnológico (CNPq) over the southern La Plata Basin. Climate Res. 68,
for financial support (process 424157/2016-0). 243-255. DOI: 10.3354/cr01358
Evans J.L. and Braun A., 2012. A climatology of sub-
tropical cyclones in the South Atlantic. J. Climate 25,
References 7328-7340.
Andrade K.M., 2005. Climatologia e comportamento dos DOI: 10.1175/jcli-d-11-00212.1
sistemas frontais sobre a América do Sul. Programa Foss M., Chou S.C. and Seluchi M.E., 2017. Interaction of
de Pós-graduação em Meteorologia, Instituto Nacio- cold fronts with the Brazilian plateau: A climatological
nal de Pesquisas Espaciais, Dissertação de Mestrado. analysis. Int. J. Climatol. 37 9, 3644-3659.
Available at: http://mtc-m16b.sid.inpe.br/col/sid.inpe. DOI: 10.1002/joc.4945>
br/jeferson/2005/06.15.17.12/doc/publicacao.pdf. Gozzo L.F., da Rocha R.P., Reboita M.S. and Sugahara
Andrade K.M., 2017. O Papel das teleconexões e de S., 2014. Subtropical cyclones over the southwestern
fatores regionais que influenciam a ocorrência de pre- South Atlantic: Climatological aspects and case study.
cipitação extrema associada a sistemas frontais sobre J. Climate 27, 8543-8562.
o sudeste do Brasil. PhD. Programa de Pós-graduação DOI: 10.1175/jcli-d-14-00149.1
em Meteorologia, Instituto Nacional de Pesquisas Hobbs P.V., Mateika T.J., Herzegh P.H., Locatelli J.D. and
Espaciais, Dissertação de Doutorado. Available at: Houze Jr. R.A., 1980. The mesoscale and microscale
http://mtc-m21b.sid.inpe.br/col/sid.inpe.br/mtc- structure and organization of clouds and precipitation
m21b/2017/10.30.11.59/doc/publicacao.pdf. in midlatitude cyclones. I. A case study of a cold front.
Bjerknes J., 1919. On the structure of moving cyclones. J. Atmos. Sci. 37, 568-596.
Geofysiske Publikasjoner 1, 2, 1-8. DOI: 10.1175/1520-0469(1980)0372.0
CO;2 Kousky V.E., 1979. Frontal influences on northeast Brazil.
Bjerknes J. and Solberg H., 1922. Life cycle of cyclones Mon. Weather Rev. 107, 1140-1153.
and the polar front theory of atmospheric circulation. DOI: 10.1175/1520-0493(1979)1072.0.CO;2
DOI: 10.1175/1520-0493(1922)502.0.CO;2 clonic vortices in the tropical South Atlantic. Tellus 36,
Browning K.A. and Harrold T.W., 1970. Air motion and 538-551. DOI: 10.1111/j.2153-3490.1981.tb01780.x
precipitation growth at a cold front. Q. J. Roy. Meteor. Kousky V.E., 1988. Pentad outgoing longwave radiation
Soc. 96, 369-389. DOI: 10.1002/qj.49709640923 climatology for the South American sector. Revista
Browning K.A. and Monk G.A., 1982. A simple model for Brasileira de Meteorologia 3, 217-231.
the synoptic analysis of cold fronts. Q. J. Roy. Meteor. DOI: 10.1.1.469.5776&rep=rep1Climatology of surface baoclinic zones in the coast of Brazil 141 Marengo J.A., Liebman B., Grimm A.M., Misra V., Silva Schultz D.M., 2005. A review of cold fronts with prefron- Dias P.L., Cavalcanti I.F.A. and Alves L.M., 2012. tal troughs and wind shifts. Mon. Weather Rev. 133, Recent developments on the South American monsoon 2449-2472. DOI: 10.1175/mwr2987.1 system. Int. J. Climatol. 32, 1, 1-21. Silva L.J., Reboita M.S. and da Rocha R.P., 2014. Relação DOI: 10.1002/joc.2254 da passagem de frentes frias na região sul de Minas Reboita M.S., Gan M.A., da Rocha R.P. and Ambrizzi T., Gerais (RSMG) com a precipitação e eventos de geada. 2010. Regimes de Precipitação na América do Sul: Revista Brasileira de Climatologia 10, 229-246. Uma Revisão Bibliográfica. Revista Brasileira de DOI: 10.5380/abclima.v14il.36314 Meteorologia 25, 193-212. Taljaard J.J., 1972. Synoptic meteorology of the Southern DOI: 10.1590/s0102-77862010000200004 Hemisphere. In: Meteorology of the Southern Hemi- Sanders F., 2005. Real Front or Baroclinic Trough? Weath- sphere (Newton C.W., Ed.). American Meteorological er and Forecasting, 20, 647-651. Society, 139-213 (Meteorological Monographs, 13). DOI: 10.1175/waf-d-10-05018.1
You can also read