RECENT STUDY ON TIO2 BASED SELF-CLEANING COATING - IOPSCIENCE
←
→
Page content transcription
If your browser does not render page correctly, please read the page content below

IOP Conference Series: Materials Science and Engineering

PAPER • OPEN ACCESS

Recent study on TiO2 based Self-Cleaning Coating
To cite this article: Rizgyandhaka Artha Prawira and Dessy Ariyanti 2021 IOP Conf. Ser.: Mater. Sci. Eng. 1053 012061

View the article online for updates and enhancements.

                               This content was downloaded from IP address 46.4.80.155 on 31/05/2021 at 08:33
International Conference on Chemical and Material Engineering (ICCME 2020)                                               IOP Publishing
IOP Conf. Series: Materials Science and Engineering              1053 (2021) 012061           doi:10.1088/1757-899X/1053/1/012061

   Recent study on TiO2 based Self-Cleaning Coating

                        Rizgyandhaka Artha Prawira and Dessy Ariyanti*
                        Department of Chemical Engineering, Faculty of Engineering, Universitas
                        Diponegoro, Tembalang, Semarang, INDONESIA

                        *E-mail: dessy.ariyanti@che.undip.ac.id

                        Abstract. Coating is a way of protecting the surface of the materials as glass, metal, clay,
                        wood, a nd cementitious from pollutant, dust. self-cleaning coating can be achieved by
                        modifying the surface to have super-hydrophobic, super-hydrophilic, and photocatalytic
                        properties. This paper summarizes the recent studies on TiO2 based self-cleaning coating. The
                        scope of this article is in the mechanism and fabrication route of TiO2 based self-cleaning
                        coating, application technique such as spin coating, spray coating dip coating and chemical
                        vapour deposition (CVD) and characterization. Self-cleaning coating can be characterized
                        using many methods in order to determine their quality and feasibility. The characterization
                        of the surface applied by self-cleaning coating can be in the form of numerical data and
                        morphological images such as X-ray diffraction (XRD), Scanning Electron Microscope
                        (SEM), Atomic Force Microscopy (AFM), contact angle, hardness, and scratch resistance are
                        also analysed and discussed.

   1. Introduction
   Coating is a way to protects materials by covering the surface of the object with another materials.
   The purpose of coating application may be decorative and functional. Most of the coating is used to
   protect surfaces from pollutant and dust [1]. There are various materials in this nature to be coated,
   such as glass, wood, metal, clay, and cementitious materials. By the rapid growth of the materials
   field and the avid production of multipurpose materials, self-cleaning coating is developed. Self-
   cleaning coating is defined as a coating that consists of compounds which either have a super-
   hydrophilic or super-hydrophobic property with the addition of photocatalytic effect. The former
   properties gives the self-cleaning effect by utilizing the action of water (rolling the droplet or sheeting
   water) to remove dirt or dust, while the latter activated its charges upon sunlight excitation that able
   to degrade the chemicals bonding of the dirt or dust absorbed by the water into smaller molecules [2].
       The compound that is often used as a photocatalyst in the self-cleaning layer is TiO2 . The
   photocatalytic properties of TiO2 results from the formation of photogeneration (hole and electron)
   charge carriers that occur in the absorption of ultraviolet (UV) in accordance with the band gap. The
   photogeneration hole in the valence band diffuses to the surface of TiO 2 and reacts with absorbed
   water molecules, forming hydroxyl radicals (·OH). Hydroxyl radicals and the photogeneration holes
   oxidize organic molecules on the surface of TiO2 . The electrons in the conduction band play a role in
   the reduction process, which reacts with molecular oxygen in the air to produce superoxide radical
   anions (O2 •−) [2].

              Content from this work may be used under the terms of the Creative Commons Attribution 3.0 licence. Any further distribution
              of this work must maintain attribution to the author(s) and the title of the work, journal citation and DOI.
Published under licence by IOP Publishing Ltd                          1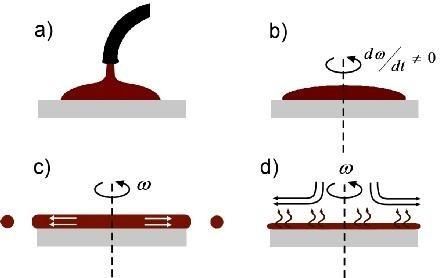
International Conference on Chemical and Material Engineering (ICCME 2020)                        IOP Publishing
IOP Conf. Series: Materials Science and Engineering   1053 (2021) 012061     doi:10.1088/1757-899X/1053/1/012061

       Coating, as mentioned previously is also expected to have hydrophilic and hydrophobic properties.
   On the surface of super hydrophilic material, the surface energy is high and sufficient to make the
   water spread or sheeted to the surface of the substrate or the contact angle of the water on the surface
   is very low [3]. In 1997, Wang et al. showed a super hydrophilic effect on glass slides coated with
   TiO2 thin films. The distribution of water is produced by the hydrophilic properties of anatase exposed
   to UV radiation and submicroscopic roughness from the coating respectively, although the effect of
   the spread of water was entirely due to photoinduced self-cleaning ability of TiO2 with the contact
   angle θ
International Conference on Chemical and Material Engineering (ICCME 2020) IOP Publishing
IOP Conf. Series: Materials Science and Engineering 1053 (2021) 012061 doi:10.1088/1757-899X/1053/1/012061
Hwang et al. (2003) have prepared organic-inorganic nanocomposite coatings on PC with simple
spray coating. A coating solution was prepared by inserting a nanosized TiO 2 sol into a polymer silica
sol. This nanocomposite layer also protects the PC from photo degradation under UV illumination
[12].
Table. 1. Various kinds of TiO2 -based coating recipes from various studies
Based The coated Results (Parameters) References
object Water Contact Angle Refractive
Index (RI)
Ce doped TiO2 Glass Sample HM-T20 with contact Sample [13]
nanopowder angle at water 118o and at n- HM-T60
through reflux hexadecane 57o with RI
method. value 1,53
TiO2 /reduced Glass GT 0,5:1 after keeping the N/A [14]
Graphene Oxide sample in ambient for 5 min,
(rGO) then water contact angle
reverts to ~34o from 480
TiO2 –SiO2 Polycarbonate With oleic acid under UV N/A [11]
mixtures substrates irradiation. A WCA 33° was
observed on the surface of the
TS-3 sample, after
deposition, it became 45°
TiO2 /poly Glass Nano-TiO2 was measured in N/A [15]
(dimethylsiloxane) the UV chamber for 60
(PDMS) seconds. All layers showed
nanocomposites hydrophobic characteristics
with an angle above 80°.
TiO2 – CCDP Glass PEG-TiO2 irradiated UV for N/A [16]
5 hours yield contact angles
11°, 12° and 11° for CCDP
content of 15, 30 and 50 units,
respectively,
TiO2 Ordinary The decrease was observed N/A [17]
Portland after UV irradiation for 6th
Cement (OPC) hours with autoclave curing.
pastes
Kesmez, (2020) investigated TiO2 nanoparticles doped by Ce were made by the reflux method
added to the obtained hybrid polymer network, it is dispersed solvent at varying rate. The obtained
transparent coating solution is applied to the glass surface [13]. Meanwhile, Kavitha, et al (2020)
combined TiO2 and reduced graphene oxide (rGO) by vacuum-assisted filtration and transfer method
for self-cleaning application on glass. The presence of rGO in the hybrids can reduce the TiO 2 band
gap and thereby increase visible light photo response. However amount of the loading rGO must be
controlled in the TiO2 /rGO hybrid to resist catalytic property as well as hydrophilic [14]. The other
research conducted by Adachi, et al (2018) studied a TiO2 /SiO2 coating on polycarbonate using a dip
coating technique [11]. Tavares, et al (2014) was synthesized TiO2 /poly (dimethyl siloxane) (PDMS)
nanocomposites for further application in spraying to obtain thin films with photocatalytic properties
and self-cleaning on glass [15]. Another research has also been conducted by Kim, et al (2016) which
explored catechol conjugated polymers coated to the glass film by chemical route, and then the TiO2
3International Conference on Chemical and Material Engineering (ICCME 2020) IOP Publishing IOP Conf. Series: Materials Science and Engineering 1053 (2021) 012061 doi:10.1088/1757-899X/1053/1/012061 nanoparticles are immobilized on the surface of the polymer-coated glass film for make hydrophilic surfaces with photocatalytic activity and self-cleaning properties by changing the number of catechol parts (2-chloro-3,4-dihydroxyacetophenone), CCDP and TiO2 nanoparticles [16]. The TiO2 layer can also be deposited on materials containing cement, as was done by Constantino, et al (2020). In their research, TiO2 for self-cleaning of cementitious materials is developed, where they used Ordinary Portland Cement (OPC) [17]. The details TiO2 -based coating recipes from various studies are summarized in Table 1. The measured parameter compared in each study is water contact angle (WCA). 3. Self-Cleaning Coating Application Self-cleaning coating can be applied by using various methods, such as spin coating, dip coating, spray coating, and chemical vapor deposition. 3.1. Sol- Gel Process In general, the sol-gel process involves the transition of a liquid system from a liquid "sol" (mostly colloid) to a solid "gel" phase. Long-lasting thin films with various properties can be stored on the substrate by spin-coating or dip coating. When "sol" is inserted into the mold, "wet gel" will form. With further drying and heat treatment, the "gel" is converted into a dense material. If the liquid in the wet "gel" is extracted under supercritical conditions, a very fragile and very low-density material called "air gel" is obtained. Because the viscosity of the "sol" is adjusted to within the range of viscosity given, the fiber can be pulled from the "sol". Ultrafine and uniforms powders are formed by precipitation, spray pyrolysis, or emulsion techniques [18]. The application of sol-gel in nanotechnology is the same as mentioned above but in the nanoscale. Sophisticated devices in telecommunications, biology, and micro machinery, require new protective nanocoating and thin films. Thin films (typically
International Conference on Chemical and Material Engineering (ICCME 2020)                        IOP Publishing
IOP Conf. Series: Materials Science and Engineering   1053 (2021) 012061     doi:10.1088/1757-899X/1053/1/012061

   According to Fig. 1, there are four stages to the spin coating process, that is dispense, substrate
   acceleration, a stage of substrate spinning at a constant rate and fluid viscous forces dominate fluid
   thinning behaviour and a stage of substrate spinning at a constant rate and solvent evaporation
   dominates the coating thinning behavior. The first stage is dispense. A typical spin process consists
   of a dispense step wherein the liquid resin is deposited onto the surface of the substrate (Figure 1 (a)).
   Two methods of expenditure are static dispense, and dynamic dispense. Static dispense only stores
   small puddle of fluid on or near the center of the substrate. Dynamic dispense is the process of
   removing while the substrate rotates at a low speed. Speeds of around 500 rpm are generally used
   during this step of the process [20-21]. The second stage is substrate acceleration. This stage
   characterized by the expulsion of aggressive fluid from the surface of the water by rotational
   movements (Figure 1 (b)) [19-22]. . The general rotation speed for this stage ranges from 1500-6000
   rpm, depending on the properties of the fluid and the substrate. This step can take anywhere from 10
   seconds to several minutes. The third stage is spinning the substrate with constant rate and fluid
   viscous force dominates the fluid depletion behavior This stage is characterized by gradual fluid
   depletion. Fluid depletion is generally quite uniform (Figure 1 (c)), although with solutions containing
   volatile solvents, it is often possible to see interference colors "spin", and doing so progressively more
   slowly because the thickness of the coatings decreases [23]. The fourth stage is spinning the substrate
   at a constant rate and evaporation of the solvent dominates the coating depletion behavior. When the
   previous stage advances, the thickness of the liquid reaches the point where the viscosity effect yield
   only in rather small net fluid flow. At this point, evaporation of volatile solvent species will be the
   dominant process (Figure 1 (d)) that occurs in the layer [22-24].

   3.3. Dip Coating
   The dip coating process can be defined as the deposition of a water-based liquid phase coating
   solution to the surface of each substrate. In general, the target material is dissolved in a solution that
   is directly coated on the surface of the substrate, then a wet layer of sediment has been evaporated to
   obtain a dry film [25-27]. This approach involves soaking the substrate into the solution of the coating
   material, therefore ensuring that the substrate has been completely infiltrated and then leaving the
   solution tank. One of the most important aspects of the dip coating process is the thickness of the
   deposited film [28], which is the basis of various properties, chemical properties, and applications.
   Shokuhfar et al. (2012) have examined that automotive wind shields with nano SiO2 -TiO2 films can
   be coated with a dip sol-gel coating. The effect of annealing temperature was studied. In the dark
   (without UV irradiation), SiO2 -TiO2 films are annealed at 500 ℃ with an almost hydrophilic anatase
   phase with a contact angle of 45°, annealed at 700℃ with a relatively hydrophobic rutile phase with
   a contact angle of 65°. This change in contact angle is clearly caused by an increase in heat treatment
   temperature, thereby reducing photocatalytic activity [29].

   3.4. Spray Coating
   The spray coating process can be applied to any object with complex shapes, where colloidal soles
   are sprayed on the media. The spray coating process is faster, and less sol waste occurs. Segota et al.
   (2011) studied the synthesis of TiO2 thin films on glass substrates by the sol-gel coating method, the
   effects of surface roughness were studied. It was found that the roughness was higher with the addition
   of polyethylene glycol (PEG) [30].

   3.5. Chemical Vapour Deposition
   Chemical vapor deposition (CVD) is the process by which thin solid films are deposited on the
   substrate through chemical reactions from gas species. For structural component applications,
   deposits usually occur at temperatures around 1000 ° C. This is a reactive process that distinguishes
   the CVD process from the physical vapor deposition (PVD) process, such as the physical evaporation

                                                          5
International Conference on Chemical and Material Engineering (ICCME 2020) IOP Publishing
IOP Conf. Series: Materials Science and Engineering 1053 (2021) 012061 doi:10.1088/1757-899X/1053/1/012061
process, sputtering and sublimation processes [31]. Lee et al. (2011) deposited TiO2 nanoparticles on
glass bead with the CVD process. CVD-coated bead has a relatively uniform and regular surface.
Catalytic activity was investigated using TiO2 . The results showed that the coating time was less and
the amount of TiO2 deposited was controlled through the coating time [32].
4. TiO2 based Self-Cleaning Coating Characterization
Preparation of self-cleaning coating based on TiO2 , then characterized using several methods to
determine the quality and feasibility. There are various types of characterization methods that can be
performed, such as X-ray diffraction (XRD), Scanning Electron Microscope (SEM), Atomic Force
Microscopy (AFM), contact angle, hardness and scratch resistance.
4.1. X-Ray Diffraction
X-ray diffraction (XRD) consists of 3 stages of work, namely: production, diffraction, and
interpretation. At the production stage, electrons produced when the filament (cathode) is heated will
be accelerated due to the difference in voltage between the cathode and the target metal (anode) so
that collisions with the anode occur. The collision will produce X-ray radiation that will come out of
the X-ray tube and interact with the crystal structure of the material being tested. In the diffraction
stage, the X-ray radiation that produced will interact with the crystal structure of the material being
tested. The material to be analyzed for its crystal structure must be in the solid phase because the
atomic positions are arranged very regularly to form a crystal field. When X-rays are directed at the
crystal plane, a diffraction pattern will appear when the X-ray passes through the small gaps between
the crystal planes. The diffraction pattern resembles a dark and light pattern. Dark patterns are formed
when destructive interference occurs, whereas light patterns are formed when constructive
interference occurs from reflected X-ray waves that meet each other. Constructive disturbance occurs
according to the following Bragg's Law:
nλ = 2 d sin θ (1)
where θ is the diffraction angle, d is the distance between the crystal planes, λ is the X-ray wavelength,
n is the diffraction sequence (1,2,3, ...).
Analyzing the top of the graph, the crystal structure of a material can be determined. Characterization
using XRD aims to determine the crystal system. X-ray diffraction method can explain the lattice
parameters, type of structure, different arrangement of atoms in a crystal, crystal imperfections,
orientation, grain, and grain size [33]. Kavitha (2020) has researched that Figure 2 shows the XRD
pattern of Graphene Oxyde (rGO) / TiO2 films differently after hydrothermal treatment and transfer.
The XRD pattern of all samples has two characteristic diffractionn peaks, one at ~ 25 o with d-spacing
of 3.6 Å corresponding to (002) reflection from rGO and the other at ~ 10.5o with dspacing of 8.16 Å
corresponding to (001) reflection from rGO. This shows a partial reduction in rGO during
hydrothermal treatment. In GT 0.5:1, reflections from TiO2 crystallites are seen. Because (002)
reflections from rGO stand out in all samples which show reduction and reordering of graphene sheets
during hydrothermal reaction and filtration [14].
6International Conference on Chemical and Material Engineering (ICCME 2020) IOP Publishing
IOP Conf. Series: Materials Science and Engineering 1053 (2021) 012061 doi:10.1088/1757-899X/1053/1/012061
Figure 2. XRD pattern of rGO/TiO2 hybrid film. Marked peaks (black dots) represents TiO 2
[14].
4.2. Scanning Electron Microscope
Scanning Electron Microscopy (SEM) can be used to determine the surface morphology of materials.
Material characterization using SEM is used to see the surface topographic structure, grain size and
structural defects [34]. Kesmez (2020) has researched that the surface of the film layer with various
nano TiO2 content was examined by Scanning Electron Microscopy. No cracks or similar defects
were observed on the surface of the film image, and an optimal surface was obtained. Although the
amount of TiO2 in the inorganic part increases, the surface of all layers is smooth and uniform (Figure
3) [13].
Figure 3. SEM images of the coatings on polycarbonate surface: a. HM-T0, b. HM-T20, c. HM-
T60, d. Cross-section of HM-T20 [13].
7International Conference on Chemical and Material Engineering (ICCME 2020) IOP Publishing
IOP Conf. Series: Materials Science and Engineering 1053 (2021) 012061 doi:10.1088/1757-899X/1053/1/012061
Kavitha (2020) has researched that the surface of the film layer with various rGO (graphene oxide)/
TiO2 content was examined by SEM. Figure. 1.4 give information of SEM images of different
rGO/TiO2 films (a) GT 0.1:1 (b) GT 0.5:1 and (c) GT 1:0.1. In the surface of the film, TiO2
nanoparticles is observed like nodules. When the amount of GO is increased, the nodules merge
together to form continuous film with evenness on the surface as observed in Figure 4 (c) (GT 1:0.1)
[14].
Figure 4. SEM images of different rGO/TiO2 films (a) GT 0.1:1 (b) GT 0.5:1 and (c) GT 1:0.1 (scale
1 μm) [14].
4.3. Atomic Force Microscope
Atomic force microscopy (AFM) is a technique that is used to map the topography and to study the
properties of material on a nanoscale. AFM uses a probing tip at one end of a spring-like cantilever
to interact with the material (sample). The interaction between the tip and the sample gives attractive
or repulsive forces. These forces give information about the topography of the sample [35]. Kim
(2016) deposited TiO2 onto the C-PEG surface which was studied by measuring the thickness of the
coating using Atomic Force Microscope (AFM), as shown by the image in Figure 5. The average
thickness of the C-PEG coating was nearly 18,1 nm, then was increased to 44,3 nm after TiO2 were
deposited. Considering the increased 26 nm thickness, it is assumed that the TiO2 were successfully
deposited onto the composite as C-PEG / TiO2 . Additionally, the AFM image of C-PEG/TiO2 was
suggesting homogeneous shape and fairly uniform size that could maintain effective interaction
between PEG and TiO2 [16].
8International Conference on Chemical and Material Engineering (ICCME 2020) IOP Publishing
IOP Conf. Series: Materials Science and Engineering 1053 (2021) 012061 doi:10.1088/1757-899X/1053/1/012061
Figure 5. The AFM image of C-PEG and C-PEG/TiO2 (50 wt%) coated surface (CCDP 50 units
of C-PEG) [16].
4.4. Contact Angle
The deposition of coating on solids produces new interfaces between different materials and involves
considerations of wetting, dispersing, interface evolution, and adhesion. The wettability of a solid by
a liquid is characterized in terms of the contact angle made by the liquid in that solid. The contact
angle, θ is obtained from the balance of the interface tension (Figure 6) and is defined from the Young
equation, according to it
σ sv = σ lv .cosθ + σ ls (1.2)
where σ sv , and σ sv and σ ls are are the interface tensions at the boundary between vapor (v), solid (s)
and liquid (l). Here, it represents the force required to stretch the interface to the distance of the unit
(or, equivalent, the energy needed to make the surface area of the unit from the given interface,
provided, in the case of σsv, mechanical distortion and strain can be ignored). The conditions θ 90 ° indicate nonwetting, with limits θ = 0 and θ =
180° defining complete wetting and total wetting, respectively [36].
Figure 6. Interfacial tensions on a solid substrate [36].
For rough surfaces, Wenzel (1936) introduced the following relationship [37]:
cos θw 5 r cos θγ (1.2)
where r is the surface roughness parameter; r is defined as a rough area / smooth area. The Wenzel
relationship shows that if the intrinsic contact angle for liquids on a solid surface is below 90°
(hydrophilic), then this additional roughening’ of the surface will reduce the effective contact angle.
9International Conference on Chemical and Material Engineering (ICCME 2020) IOP Publishing
IOP Conf. Series: Materials Science and Engineering 1053 (2021) 012061 doi:10.1088/1757-899X/1053/1/012061
Kim (2016) has researched that in Figure 7 shows the sample water contact angle for CCDP content
of 15, 30 and 50 units, respectively. Bare glass film shows a contact angle of 72°. When CCDP content
in C-PEG the contact angle increases to 57°, 58° and 65°, respectively, which shows an increase in
hydrophobicity. When the same amount of TiO2 nanoparticles was immobilized on the surface of a
C-PEG coated glass film, the contact angle changed to 42°, 39° and 26°. These results indicate the
success of immobilization of TiO2 nanoparticles which become hydrophilic on the C-PEG coated
glass surface. UV irradiation for 5 hours results in contact angle of 11°, 12° and 11°, indicating that
the surface becomes more hydrophilic. A more hydrophilic surface may be caused by the
decomposition of organic species adsorbed on C-PEG/TiO2 through conventional photocatalytic
oxidation processes [16].
Figure 7. The water static contact angle optical images of C-PEG, C-PEG /TiO2 (50 wt%),
coated surface in response to UV irradiation [16].
4.5. Hardness and Scratch Resistance
Hardness is defined as the ability of a material to resist penetration or abrasion by other materials.
Hardness can be evaluated by dividing it into three main types: rebound hardness, indentation and
scratch. Rebound hardness is evaluated by measuring the reflection of a hammer dropped from a fixed
height to the material. The indentation is evaluated according to the indent dimension left by the
indenter. In engineering field is the most common Vickers, Brinnel, and Rockwell test. Scratch
hardness is often assessed in the case of film surfaces or as a comparison method. Hardness can be
evaluated based on three different scales: macro, micro and nano scale. Specimens tested on a macro
scale typically experience test loads higher than 10 N and this scale also includes the Vickers, Brinnel,
and Rockwell tests mentioned above [38]. According to the Table 2. Kesmez (2020) has researched
that the values of pencil and Newton hardness on HM-T0 surfaces that didn’t contain Nano TiO2 were
each determined as 6 H and 2.4 N. The hardness value obtained increases with reduced organic film
content, and, in words others, it was determined that the hardness value of Pencils and Newton
increased respectively to > 9H and 4.0 N, with an increase in inorganic parts (TiO2 nanoparticles) in
the film [13].
10International Conference on Chemical and Material Engineering (ICCME 2020) IOP Publishing
IOP Conf. Series: Materials Science and Engineering 1053 (2021) 012061 doi:10.1088/1757-899X/1053/1/012061
Table 2. The results of mechanical tests of the obtained samples.
Sample Hardness
Pencil Hardness Scratch Resistance
HM-T0 6H 2,4 N
HM-T10 8H 2,8 N
HM-T20 9H 3,4 N
HM-T40 >9H 3,6 N
HM-T60 >9H 4,0 N
[13]
5. Future Development TiO 2 based Self-Cleaning Coating
TiO2 based self-cleaning coating is very potential for further development as it can be one of
alternatives approach to prevent the pollution accumulation on daily used materials or structures
which cause technical and economical problem. Many researches have been conducted related to the
materials combination and also application technique to bring out the optimum coating that can gives
maximum advantages. The combination of TiO2 and graphene oxide seems to have an extensive
development as the addition of graphene to the TiO2 film results transparent and high conductivity
yields a promising increase in photocatalytic activity in visible light excitation. Thus, can extend the
potential of TiO2 based self-cleaning coating in various indoor applications. As graphene is
conductive material, the electroconductivity of TiO2 based self-cleaning with a graphene will add
additional function through its antifouling effect against particulate contaminants.
References
[1] Afandi Y, Arief I and Amiadji. 2015. Jurnal Teknik ITS. (4): 23019271.
[2] Nakata K and Fujishima A. 2012. J. Photochem. Photobiol. 13: 169-89.
[3] Wahyuni N. Pelapis Superhidrofibik dan Uji Kemampuan Self Cleaning pada Batu Andesit.
2016. Skripsi. Surabaya: Universitas Airlangga.
[4] Wang R, Hashimoto K, Fujishima A, Chikuni M, Kojima E, Kitamura A, Shimohigoshi M and
Watanabe T. 1997. Nature. 388(6641): 431-2.
[5] Fujishima A and Honda K. 1972. Nature. 238: 3738.
[6] Irawati A. 2016. Pengaruh Temperatur Perlakuan Panas pada Lapisan Hydrophobic Komposit
PDMS/SiO2 dengan Fasa Silika Kristobalt. Skripsi. Surabaya: Institut Teknologi Sepuluh
Nopember.
[7] Barthlott W, Neinhuis C. 1997. Ann. Bot. 79: 667-77.
[8] Helsch G, Krzyzak M, Heide G and Frischat GH. 2006. Glass Technol. Eur. J. Glass Sci.
Technol. 47: 153-6.
[9] Ariyanti D, Dong JZ, Dong JY and Gao W. 2016. Bulletin of Chemical Re-action Engineering
& Catalysis. 11(1): 40-7.
[10] Gunnarsson SG. 2012. Self Cleaning Paint: Introduction of Photocatalytic Particles into a
Paint System. Technical University of Denmark: Kgs. Lyngby.
[11] Adachi T, Latthe SS, Gosavi SW, Roy N, Suzuki N, Ikari H, Kato, K, Katsumata K, Nakata K,
Furudate M, Inoue T, Kondo T, Yuasa M, Fujishima A and Terashima C. 2018. Applied
Surface Science. 458: 917-23.
[12] Hwang DK, Moon JH, Shul YG, Jung KT, Kim DH and Lee DW. 2003. J. Sol Gel Sci. Technol.
26: 783–7.
[13] Kesmez O. 2020. Journal of Molecular Structure. 1205.
[14] Kavitha MK, Rolland L, Johnson L, John H and Jayaraj MK. 2020. Materials Science in
Semiconductor Processing. 113: 105-11.
[15] Tavares MTS, Santos ASF, Santos IMG, Silva MRS, Bomio MRD, Longo E, Paskocimas CA,
11International Conference on Chemical and Material Engineering (ICCME 2020) IOP Publishing
IOP Conf. Series: Materials Science and Engineering 1053 (2021) 012061 doi:10.1088/1757-899X/1053/1/012061
and Motta FV. 2014. Surface & Coatings Technology. 239: 16-19.
[16] Kim SM, In I and Park SY. 2016. Surface & Coatings Technology. 294: 75-82.
[17] Constantino JCP, Garcia DCS, Palhares HG, Houmard M and Figueiredo RB. 2020.
Construction and Building Materials. 250.
[18] Sajjadi SP. 2005. Journal of Polymer Engineering and Technology. 13: 38-41.
[19] Mitzi DB, Kosbar LL, Murray CE, Copel M and Atzali A. 2004. Nature. 428: 299-303.
[20] Hellstrom SL. 2007. Basic Model of Spin Coating. Standford University: Coursework for
physics 210.
[21] Middleman S and Hochberg AK. 1993. Process Engineering Analysis in Semiconductor
Devices Fabrication. McGraw Hill; p. 313.
[22] Meyerhofer D. 1978. J. Appl. Phys. 49: 3993.
[23] Hanaor D, Trianni G and Sorrell C. 2011. Surf. Coat. Tech. 205(12): 855-74.
[24] Peeters T and Remoortere BV. 2008. J. Appl. Sci. 46: 685-96.
[25] Ceratti DR, Louis B, Paquez X, Faustini M and Grosso D. 2015. Adv Mater. 27(34): 4958–62.
[26] Gaulding EA, Diroll BT, Goodwin ED, Vrtis ZJ, Kagan CR and Murray CB. 2015. Adv Mater.
27(18): 2846–51.
[27] Dey M, Doumenc F and Guerrier B. 2016. Eur Phys J E. 39(2): 19.
[28] Lii DF, Huang JL, Tsui LJ and Lee SM. 2002. Surf Coat Technol. 150(2-3): 269–76.
[29] Shokuhfar A, Alzamani M, Eghdam E, Karimi M, and Mastali S. 2012. Nanosci. Nanotechnol.
2(1): 16-21.
[30] Segota S, Curkovic L, Ljubas D, Svetlic V and Houra IF. 2011. Ceram. Int. 37: 1153-60.
[31] Xu Y and Xiu TY. 2010. Engineering Materials and Processes.
[32] Lee H, Song MY, Jurng J and Park YK. 2011. Powder Technol. 214: 64-68.
[33] Smallman R and Bishop R. 1999. Modern Physics Metallurgy and Materials Engineering.
Oxford: Butterworth-Heinernann.
[34] Smallman RE, Bishop R.J. 2000. Modern physical metallurgy and materials engineering. New
York: Hill International Book Company.
[35] Meyer E 1992. Progress in surface science. 41(1): 3–49.
[36] Asthana R and Sobzack N. 2000. JOM-e. 52(1).
[37] Wenzel RN. 1936. Ind. Eng. Chem. 28: 988-94.
[38] Williams JA. 1996. Tribology. 29(8): 675-94.
12You can also read