Monitoring for invasive Cabomba caroliniana eDNA in two Darwin River billabongs following eradication attempts - Report
←
→
Page content transcription
If your browser does not render page correctly, please read the page content below
Monitoring for invasive Cabomba caroliniana
eDNA in two Darwin River billabongs following
                         eradication attempts

                                                       Report

                  by Richard C. Edmunds, Cecilia Villacorta-Rath,
                      Christopher J. Collins and Damien Burrows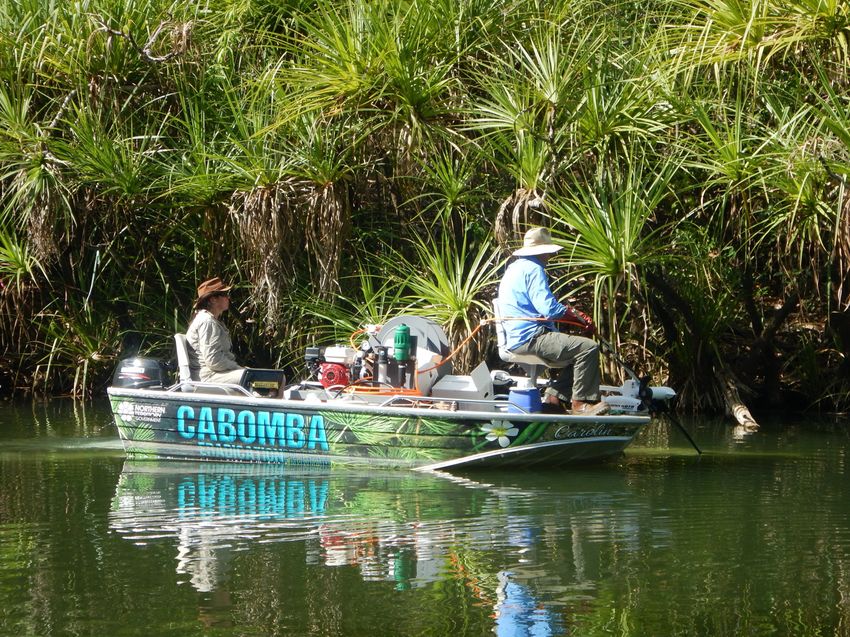
© James Cook University, 2019
Monitoring for invasive Cabomba caroliniana eDNA in two Darwin River billabongs following
eradication attempts is licensed by James Cook University for use under a Creative Commons Attribution 4.0
Australia licence. For licence conditions see creativecommons.org/licenses/by/4.0
This report should be cited as:
Edmunds, R.C., Villacorta-Rath, C., Collins, C.J.*, and Burrows, D. 2019. Monitoring for invasive Cabomba
caroliniana eDNA in two Darwin River billabongs following eradication attempts. Report 19/25, Centre for Tropical
Water and Aquatic Ecosystem Research (TropWATER), James Cook University, Townsville.
*Weed Management Branch, Department of Environment and Natural Resources, Northern Territory
Government.
Cover photographs:
Front cover: Cabomba eradication boat, Northern Territory Government (photo: Christopher J. Collins)
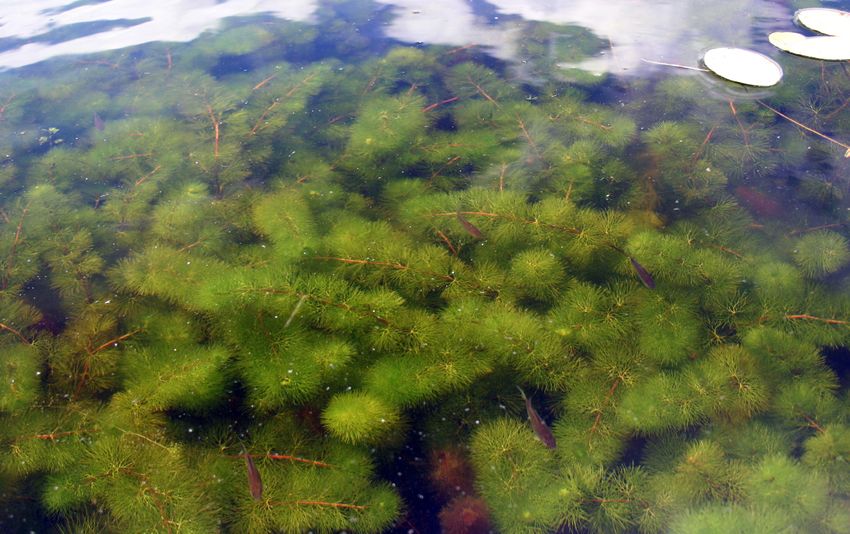
Back cover: Cabomba caroliniana infestation (photo: Leslie J. Mehrhoff)
This report is available for download from the Northern Australia Environmental Resources (NAER) Hub website
at nespnorthern.edu.au
The Hub is supported through funding from the Australian Government’s National Environmental Science
Program (NESP). The NESP NAER Hub is hosted by Charles Darwin University.
ISBN 978-1-925800-36-4
June, 2019
Printed by Uniprint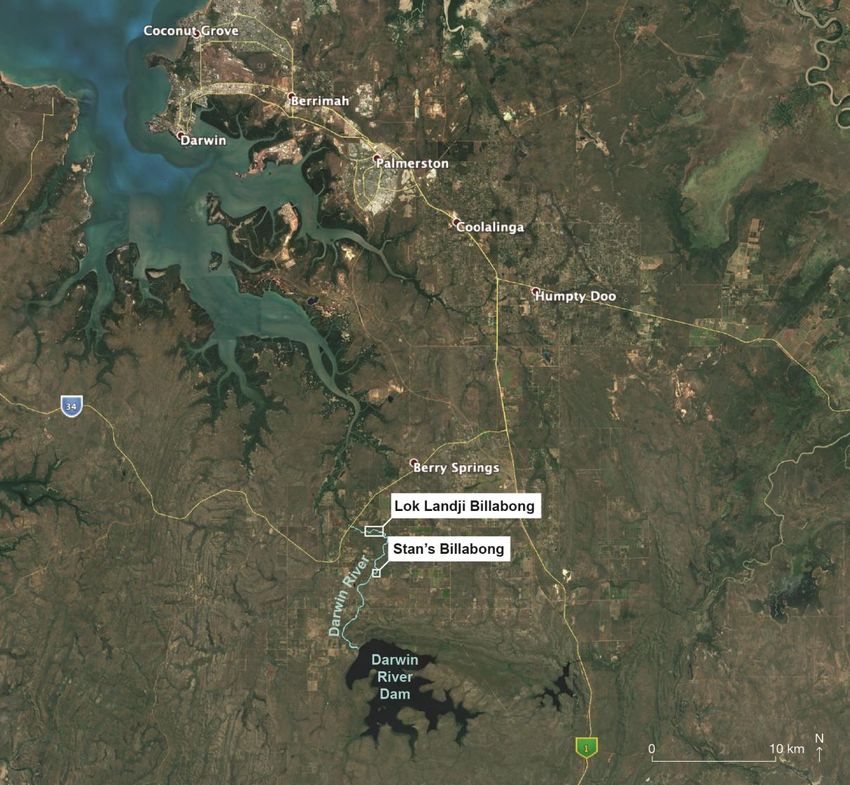
Contents
Acronyms.................................................................................................................................... iii

Abbreviations..............................................................................................................................iv

Acknowledgements .................................................................................................................... v

Executive summary .................................................................................................................... 1

1.    Introduction.......................................................................................................................... 2

2.    Methodology ........................................................................................................................ 3

     2.1     Field sites ..................................................................................................................... 3

     2.2     Sample collection ......................................................................................................... 3

     2.3     eDNA extraction ........................................................................................................... 6

     2.4     eDNA detection ............................................................................................................ 7

3.    Results................................................................................................................................. 9

4.    Discussion ......................................................................................................................... 11

5.    Recommendations and conclusions ................................................................................. 12

References ............................................................................................................................... 13

  Monitoring for invasive Cabomba caroliniana eDNA in two Darwin River billabongs following eradication attempts | i
List of tables
Table 1. Summary of C. caroliniana eDNA sample collection dates, ID, types, locations,
  and detections in two Darwin, NT billabongs. Coordinates provided for first six NBC
  samples refer to six sites within Lok Landji where near-bottom conglomerate samples
  were collected (see Figure 1). For samples with positive eDNA detections the number
  of positive assay replicates (n) and corresponding matK copy number are provided.
  *Sample type: S = Surface sample; B = Blank sample; NBC = Near-bottom
  conglomerate sub-sample. .................................................................................................... 6

List of figures
Figure 1. Location of Lok Landji and Stan's Billabongs on the Darwin River. .......................... 4

Figure 2. Maps of Lok Landji (A) and Stan’s (B) Billabongs wherein 30mL surface water
   samples were collected (green dots). Subsequent near-bottom conglomerate sample
   collection was conducted in Lok Landji Billabong (A) on same day at six locations in the
   western half of the billabong (red dots). Red boxes in panel A indicate sites within Lok
   Landji Billabong where surface water samples contained C. caroliniana eDNA. Note
   that Lok Landji near-bottom conglomerate sub-samples (n = 10) are not spatially
   discrete (see Section 2.2)...................................................................................................... 5

Figure 3. Average number of C. caroliniana eDNA copies (± SEM) recovered in final
   elution of extracted 30 mL water samples as determined by extrapolation from aDNA
   standard curve (Edmunds and Burrows, 2019). The bottom conglomerate sub-samples
   contained significantly more C. caroliniana eDNA than surface samples (*P=0.0095;
   see Section 3). Note that C. caroliniana eDNA detections in surface and near-bottom
   conglomerate sub-samples can and cannot be spatially resolved, respectively (see
   Section 2.2).......................................................................................................................... 10

 Monitoring for invasive Cabomba caroliniana eDNA in two Darwin River billabongs following eradication attempts | ii
Acronyms
NESP ............. National Environmental Science Program

DENR ............ Department of Environment and Natural Resources

Monitoring for invasive Cabomba caroliniana eDNA in two Darwin River billabongs following eradication attempts | iii
Abbreviations
aDNA ............. Artificial deoxyribonucleic acid

CI ................... Confidence interval

eDNA. ............ Environmental deoxyribonucleic acid

gDNA............. Genomic deoxyribonucleic acid

qPCR ............. Quantitative polyermerase chain reaction

Tm................... Melting temperature

Monitoring for invasive Cabomba caroliniana eDNA in two Darwin River billabongs following eradication attempts | iv
Acknowledgements
Screening of Lok Landji and Stan’s Billabongs for Cabomba caroliniana eDNA presence was
conducted as part of the Australian Government’s National Environmental Science Program
(NESP), Northern Australia Environmental Resources Hub Project 4.3: “The Northern
Australia eDNA Program – Revolutionising Aquatic Monitoring and Field Surveys in Tropical
Waters”.

We thank staff of the Weed Management Brach, Department of Environment and Natural
Resources, Northern Territory Government (Darwin NT) for their assistance with water
sample collections and equipment sterilisation.

Monitoring for invasive Cabomba caroliniana eDNA in two Darwin River billabongs following eradication attempts | v
Executive summary
Cabomba caroliniana (cabomba) is an introduced aquatic plant that has become established
in many parts of Australia. In the Northern Territory, two billabongs in the Darwin River (Lok
Landji and Stan) have been chemically treated as part of an eradication attempt. Follow-up
monitoring involved using drop-cameras for underwater visual surveys, benthic raking, and,
more recently, the application of eDNA monitoring. This report presents results from an
eDNA survey for cabomba in these two billabongs.

Using a previously validated eDNA assay (C.caroliniana_matK; Edmunds and Burrows,
2019) cabomba eDNA was detected in Lok Landji Billabong approximately 2 years after
chemical treatment while cabomba eDNA was not detected in Stan’s Billabong approximately
10 years after chemical treatment. Within Lok Landji Billabong surface water samples were
collected at 42 sites and 10 sub-samples were collected from a conglomerate sample
pumped from near the billabong bottom at six sites. Within Stan’s Billabong, five surface
water samples were collected from two discrete sites. Lok Landji surface samples from three
sites contained detectable levels of cabomba matK copies (70, 3, and 1), while near-bottom
conglomerate sub-samples contained significantly more cabomba matK copies (152.71 ±
22.86; average ± SEM). No cabomba eDNA was detected in Stan’s Billabong surface
samples nor in any field (n = 3) or extraction (n = 5) blanks. Bidirectional Sanger sequencing
confirmed that all three surface sample detections and all five representative near-bottom
conglomerate sample detections were positive for cabomba.

In light of the potential for legacy DNA to be harboured in Lok Landji sediment following
eradication (i.e., eDNA reservoir) the detected cabomba eDNA may or may not have
originated from living plants. As such, Lok Landji Billabong should continue to be monitored
concurrently using drop-cameras, benthic raking, and eDNA to ensure that living plants, if
present, are discovered as soon as possible.

   Monitoring for invasive Cabomba caroliniana eDNA in two Darwin River billabongs following eradication attempts | 1
1. Introduction
Cabomba caroliniana (cabomba) is an introduced aquatic plant from the Americas and has
become established in many parts of Australia (Northern Territory, Queensland, Victoria). In
the Northern Territory it is only known to occur in the Darwin River. Cabomba management
in the NT (i.e., eradication attempts) has included chemical treatment of known populations
in the Darwin River with Agricrop Rubber Vine Spray Herbicide (800 g/L of 2,4-D n-butyl
ester active ingredient) from 2004 to 2015 and Shark® herbicide (240 g/L of carfentrazone-
ethyl active ingredient) from 2015 to 2018 (Cabomba Eradication Program Northern Territory,
2019). Follow-up monitoring is based on visual surveys using camera drops and benthic rake
samples but, more recently, eDNA sampling has been introduced to determine if any living
cabomba remains in the chemically-treated billabongs.

Lok Landji and Stan’s Billabongs, which are descrete sections of the Darwin River, were
chemically treated in cabomba eradication attempts in 2004 to 2018 and 2004 to 2006,
respectively (Cabomba Eradication Program Northern Territory, 2019). These locations have
been routinely monitored since chemical eradication attempts using benthic raking and drop-
cameras for visual assessments of billabong benthos. No live cabomba has been detected in
Lok Landji Billabong since January 2017 or Stan’s Billabong since November 2006 using
these visual assessment methods. As an extension to routine visual assessment methods
we applied eDNA sampling to determine if detectable levels of cabomba are present in either
billabong. More specifically, the following 30 mL water samples were collected to assess
cabomba eDNA presence: 1) Lok Landji surface samples (n = 42); 2) Lok Landji near-bottom
conglomerate sample encompassing six sites (n = 10 sub-samples); 3) Lok Landji blanks (n
= 3); 4) Stan’s surface samples (n = 5), and 5) Stan’s blanks (n = 2).

   Monitoring for invasive Cabomba caroliniana eDNA in two Darwin River billabongs following eradication attempts | 2
2. Methodology
2.1 Field sites
All field sampling sites were located in the Darwin River, which is located approximately 65
km south of Darwin City in the Top End of the Northern Territory, Australia. The Darwin River
has a tropical savanna climate with distinct wet and dry seasons and average maximum
temperatures of approx. 30˚C year round. The river itself stretches for a total of 16 km from
the Darwin River Dam wall, draining into Darwin Harbour. Lok Landji and Stan’s Billabong
are perennial water bodies located in the lower and mid reaches of the river.

Lok Landji is a 2.25 km long billabong with a variable width up to 40 m and depths to 10 m,
with average centre depth around 3–4 m. Input from springs during the dry season (≥ 200 L
per second) keeps the water fresh, clear and moving. The Lok Landji section of the river is
separated from the upper sections by shallow, rocky anabranches with low flow rates
following end of wet season.

Stan’s Billabong is in the mid section of the Darwin River and is about 50 m long and
relatively narrow at approx. 10–15 m wide and an average centre depth of 2 m. This
billabong has little-to-no input from spring water. As such, water in Stan’s Billabong tends to
stagnate towards the end of the dry season as tannins build up and effectively reduce light
penetration into the river.

2.2 Sample collection
Unfiltered water samples (30 mL) were collected from both the surface and near-bottom in
Lok Landji Billabong and from the surface only in Stan’s Billabong (Figure 1, Figure 2, Table
1). Surface samples were collected from 42 (n = 1 each) and 2 (n = 2 or 3) discrete sites
within Lok Landji and Stan’s Billabongs that ranged in depth from 1 to 5.5 m (green dots;
Figure 2A and Figure 2B), respectively. 30 mL surface samples were collected from the boat
at each site by submerging 50 mL LoBind® tube (Eppendorf Pty Ltd, Australia) just below
water surface, decanting down to 30 mL, adding 10 mL Longmire’s preservative (Longmire,
et al., 1992; Edmunds and Burrows, in review) with Verispensor® 2 liquid dispenser
(Eppendorf Pty Ltd, Australia), and inverting five times to mix. Lok Landji near-bottom
conglomerate sample contained approximately 5 L pumped from near the billabong bottom
into one container at six sites (red dots, Figure 2A). 30 mL sub-samples (n = 10) were then
collected from 30 L container by pouring 50 mL of conglomerate sample into a new 50 mL
LoBind® tube, decanting down to 30mL (off side of boat), adding 10mL Longmire’s
preservative with Verispensor® 2 liquid dispenser, and inverting five times to mix.

Gloves were changed between collection of each surface sample in Lok Landji and Stan’s
Billabongs given their spatial discretion; however, gloves were not changed between
collection of each sub-sample from near-bottom conglomerate given their lack of spatial
discretion. Lok Landji and Stan’s Billabongs surface sample field blanks (n = 1 each) were
collected by adding 30 mL DNA-free water to 10 mL Longmire’s and inverting five times to
mix prior to commencement of sample collection (i.e., handling and preservative blank). The
Lok Landji near-bottom conglomerate sample field blank (n = 1) was collected by pumping
approx. 5 L clean water through bleach sterilized sump into new 30 L container, pouring 50
mL clean water from sterilized container into new 50mL LoBind® tube, decanting down to 30

   Monitoring for invasive Cabomba caroliniana eDNA in two Darwin River billabongs following eradication attempts | 3
mL, adding 10 mL Longmire’s with Verispensor® 2 liquid dispenser, and inverting five time to
mix (i.e., sump, bucket, handling, and preservative blank).

All Longmire’s preserved samples from Lok Landji and Stan’s Billabongs (n = 58, 40 mL
each; Figure 1, Figure 2, Table 1) were stored in the dark at ambient temperature from
collection on 12 and 13 December, respectively, until arrival at James Cook University
(Townsville, Queensland Australia) on 22 February 2019. Samples remained at room
temperature throughout batch-wise eDNA extractions (24 March–18 May 2019).

Figure 1. Location of Lok Landji and Stan's Billabongs on the Darwin River.

   Monitoring for invasive Cabomba caroliniana eDNA in two Darwin River billabongs following eradication attempts | 4
Figure 2. Maps of Lok Landji (A) and Stan’s (B) Billabongs wherein 30mL surface water samples were collected
(green dots). Subsequent near-bottom conglomerate sample collection was conducted in Lok Landji Billabong (A)
on same day at six locations in the western half of the billabong (red dots). Red boxes in panel A indicate sites
within Lok Landji Billabong where surface water samples contained C. caroliniana eDNA. Note that Lok Landji
near-bottom conglomerate sub-samples (n = 10) are not spatially discrete (see Section 2.2).

   Monitoring for invasive Cabomba caroliniana eDNA in two Darwin River billabongs following eradication attempts | 5
2.3 eDNA extraction
Inherent eDNA was extracted from 40 mL unfiltered water samples using the PPLPP
workflow with 5 µL and 1 µL in-house glycogen added to initial and terminal precipitations,
respectively (Edmunds and Burrows, in review). In order to accommodate 40 mL samples
the PPLPP workflow was modified as follows: 1) half of each sample (20 mL) was transferred
into a new 50 mL LoBind® tube prior to initial isopropanol precipitation, 2) pellets derived
from the sample halves were resuspended in 300µL lysis buffer (50% of total), and 3)
resuspended sample halves were recombined into one 2 mL LoBind® tube (600µL lysis
buffer total).

Samples were processed across five extraction batches with final elution volume of 200 µL
for batches 1 and 2 or 100 µL for batches 3–5. Following extraction, 100 µL elution (i.e., 50%
or 100% of final elution for batches 1–2 or 3–5, respectively) was purified using DNeasy
PowerClean Pro Clean Up Kit (Qiagen Pty Ltd, Australia; Edmunds and Burrows, in review).
Each extraction batch (n = 5) included one extraction control (30 mL DNA-free water mixed
with 10 mL Longmire’s) that was processed and analyzed concurrently (i.e., same reagents,
equipment, inhibitor purification, and assay). Extraction batches 1–3 concurrently extracted
and analyzed field blanks 1–3 (Table 1).

Table 1. Summary of C. caroliniana eDNA sample collection dates, ID, types, locations, and detections in two
Darwin, NT billabongs. Coordinates provided for first six NBC samples refer to six sites within Lok Landji where
near-bottom conglomerate samples were collected (see Figure 2). For samples with positive eDNA detections the
number of positive assay replicates (n) and corresponding matK copy number are provided. *Sample type: S =
Surface sample; B = Blank sample; NBC = Near-bottom conglomerate sub-sample.

   Sample       Sample
                                   Latitude         Longitude        Location       eDNA detected
   ID           type*
   B3           B (S)              Car              Car              Stans          N
   STAN1        S                  -12.775063       130.985074       Stans          N
   STAN3        S                  -12.775063       130.985074       Stans          N
   STAN5        S                  -12.775063       130.985074       Stans          N
   STAN2        S                  -12.775556       130.98484        Stans          N
   STAN4        S                  -12.775556       130.98484        Stans          N
   B2           B (NBC)                                              Shed           N
   B1           B (S)                                                Shed           N
   325          S                  -12.746413       130.987671       Lok Landji     N
   322          S                  -12.746409       130.987393       Lok Landji     N
   349          S                  -12.746494       130.98703        Lok Landji     N
   313          S                  -12.746408       130.98657        Lok Landji     N
   257          S                  -12.746055       130.986104       Lok Landji     N
   215          S                  -12.745782       130.98574        Lok Landji     N
   133          S                  -12.745338       130.985269       Lok Landji     N
   102          S                  -12.745161       130.984808       Lok Landji     N
   97           S                  -12.745172       130.984348       Lok Landji     N
   65           S                  -12.744978       130.983883       Lok Landji     N
   61           S                  -12.744997       130.983521       Lok Landji     N
   49           S                  -12.744901       130.983332       Lok Landji     N

   Monitoring for invasive Cabomba caroliniana eDNA in two Darwin River billabongs following eradication attempts | 6
27 S -12.744722 130.983055 Lok Landji N 23 S -12.744721 130.982688 Lok Landji N 6 S -12.744633 130.982227 Lok Landji N 57 S -12.745001 130.981952 Lok Landji N 106 S -12.745275 130.981586 Lok Landji N 146 S -12.745455 130.981494 Lok Landji N 197 S -12.745732 130.981131 Lok Landji N 227 S -12.745912 130.981038 Lok Landji N 265 S -12.746185 130.980764 Lok Landji N 287 S -12.746367 130.980582 Lok Landji Y (n = 1; 70 copies) 342 S -12.746549 130.980399 Lok Landji N 388 S -12.746729 130.979943 Lok Landji N 430 S -12.746913 130.979941 Lok Landji N 408 S -12.746826 130.979664 Lok Landji N 441 S -12.747001 130.979575 Lok Landji N 405 S -12.746828 130.979388 Lok Landji N 422 S -12.74692 130.979205 Lok Landji N 378 S -12.74674 130.979019 Lok Landji N 335 S -12.74656 130.97865 Lok Landji N 271 S -12.746293 130.978463 Lok Landji N 250 S -12.746113 130.97837 Lok Landji Y (n = 1; 3 copies) 236 S -12.746024 130.978185 Lok Landji N 234 S -12.746022 130.978005 Lok Landji N 205 S -12.745856 130.977728 Lok Landji N 159 S -12.745577 130.977445 Lok Landji Y (n = 1; 1 copy) 157 S -12.745579 130.977261 Lok Landji N 138 S -12.74549 130.977076 Lok Landji N 153 S -12.745587 130.976901 Lok Landji N NBC1 NBC -12.744732 130.982136 Lok Landji Y (n = 1; 106 copies) NBC2 NBC -12.74558 130.977077 Lok Landji Y (n = 3; 81-236 copies) NBC3 NBC -12.745829 130.977638 Lok Landji Y (n = 4; 106-347 copies) NBC4 NBC -12.745913 130.980947 Lok Landji Y (n = 1; 138 copies) NBC5 NBC -12.746989 130.979929 Lok Landji Y (n = 2; 1-71 copies) NBC6 NBC -12.747067 130.979665 Lok Landji Y (n = 2; 124-347 copies) NBC7 NBC Lok Landji Y (n = 2; 127-163 copies) NBC8 NBC Lok Landji N NBC9 NBC Lok Landji N NBC10 NBC Lok Landji Y (n = 3; 91-300 copies) 2.4 eDNA detection Presence of cabomba eDNA was determined using a previously developed quantitative polymerase chain reaction (qPCR) assay (C.caroliniana_matK; Edmunds and Burrows, 2019). Each 10 or 20 µL reaction (n = 6 technical replicates per field sample) contained 5 or 10 µL PowerUP® Sybr Green Master Mix (Thermo Fisher Scientific Pty Ltd, Australia), 0.9 or Monitoring for invasive Cabomba caroliniana eDNA in two Darwin River billabongs following eradication attempts | 7
1.8 µL forward primer (900 nM final), 0.9 or 1.8 µL reverse primer (900 nM final), 3 or 6 µL
extracted eDNA (see above), and 0.2 or 0.4 µL DNA-free water. Room temperature master
mix (7 or 14 µL) was loaded into white 96-well plate (Life Technologies Inc., Australia) with
Multipette® Xstream electronic dispensing pipette (Eppendorf Pty Ltd, Australia) fitted with
500 µL CombiTip ® (Eppendorf Pty Ltd, Australia) in a UV-sterilized PCR cabinet (Esco Pty
Ltd, Australia) in a dedicated eDNA laboratory at James Cook University (Townsville,
Queensland Australia). Plates were sealed with optical adhesive film (Life Technologies
Australia Ltd Pty), briefly vortexed (10 sec), pulse spun (10 sec), loaded into an opened tray
of QuantStudio3™ Real-Time PCR System (Life Technologies Inc., Australia), and wiped
thoroughly with nonabrasive Kimwipe® to remove smudges or dust (i.e., ensure a complete
optical seal transparency) before closing QuantStudio3™ tray and commencing qPCR run.

All assays were run under the following cycling conditions: initial UDG incubation at 50˚C for
2 min then initial denaturation at 95˚C for 2 min followed by 45 cycles of 95˚C for 15 secs and
65˚C for 1 min (ramp rate = 2.7˚C/sec) before terminal dissociation curve generation (65˚C–
95˚C, ramp rate 0.15˚C/sec). QuantStudio™ Design and Analysis Software (version 1.4.2;
Life Technologies, Australia) was used to set threshold fluorescence (0.2), import
C.caroliniana_matk aDNA standard curve (Edmunds and Burrows, 2019), and export data to
Microsoft Excel.

Batch 1 samples were run once using 10 µL reactions (18% or 9% screened of Qiagen
purified or total elution, respectively). Batch 2 samples were run three times (twice using 10
µL and once using 20 µL reactions for 100% or 50% screened of Qiagen purified or total
elution, respectively). Batch 3 samples were run twice (once using 10 µL and once using 20
µL for 100% screened of Qiagen purified total elution). Batch 4 and 5 samples were each run
twice using 20 µL reactions (72% screened of Qiagen purified total elution).

Cabomba eDNA detections that exhibited ∆Tm within 99.7% confidence interval (CI) of gDNA
standards (see Edmunds and Burrows, 2019) were considered putatively positive and
representatives for each ∆Tm value were Sanger Sequenced bidirectionally for confirmation
(Trujillo-Gonzalez, et al., 2019).

   Monitoring for invasive Cabomba caroliniana eDNA in two Darwin River billabongs following eradication attempts | 8
3. Results
Across all Lok Landji surface samples (n = 42) cabomba eDNA was detected at three sites
(#287, #250, and #159) in low abundance (70, 3, and 1 copies), respectively, following ≥
50% elution screening (Figure 2A; Table 1). Across ten sub-samples of the Lok Landji near-
bottom conglomerate sample cabomba eDNA was detected in significantly higher
abundance, despite lower elution screening (9%), than was observed across surface sample
detections (152.71 ± 22.86 vs. 24.59 ± 22.85 copies; average ± SEM; Welch-corrected two-
tailed T-test: P=0.0095; Figure 3). Of note is that two bottom conglomerate sub-samples
(NBC8 and NBC9; Table 1) yielded no cabomba eDNA detections in the 9% elution
screened.

In terms of overall detection rate, bottom conglomerate sub-samples averaged 30% (18/60
assays) across 9% elution screened while surface samples averaged 0.543% (3/552 assays)
across ≥ 50% elution screened. On a sample-by-sample basis, detection rate ranged from
16.7% (1/6 assays) to 66.7% (4/6 assays) for bottom conglomerate sub-samples containing
eDNA (n = 8; Table 1) while detection rate was 5.6% (1/18 assays) for each surface sample
containing eDNA. (n = 3; Figure 2A).

No cabomba eDNA was detected in Stan’s Billabong surface water samples (Figure 2B;
Table 1). Similarly, no cabomba eDNA was detected in field and extraction blanks (n = 3 and
5), respectively.

Sanger sequences of representative putative positive detections (n = 8) exhibited ≥ 96.8%
pairwise identity with targeted cabomba matK gene region within chloroplast genome
(GenBank accession AF543729) thus confirming all detections as true positives. Of note is
that poor sequence quality due to limited template available for Lok Landji surface detections
at sites #250 and #159 (3 and 1 copies) the confirmation pairwise alignment to C. caroliniana
matK (GenBank accession AF543729) is based on 27 bp region (6% and 12%) with 100%
match, respectively.

   Monitoring for invasive Cabomba caroliniana eDNA in two Darwin River billabongs following eradication attempts | 9
C. caroliniana eDNA Detection in Lok Landji Billabong

                               200
 Yield (copies eluted ± SEM)

                                           *
                               150

                               100

                                50

                                 0
                                      Bottom                            Surface
                                     Sample collection location

Figure 3. Average number of C. caroliniana eDNA copies (± SEM) recovered in final elution of extracted 30 mL
water samples as determined by extrapolation from aDNA standard curve (Edmunds and Burrows, 2019). The
bottom conglomerate sub-samples contained significantly more C. caroliniana eDNA than surface samples
(*P=0.0095; see Section 3). Note that C. caroliniana eDNA detections in surface and near-bottom conglomerate
sub-samples can and cannot be spatially resolved, respectively (see Section 2.2).

        Monitoring for invasive Cabomba caroliniana eDNA in two Darwin River billabongs following eradication attempts | 10
4. Discussion This constitutes the first application of eDNA monitoring to invasive aquatic plants following chemical eradication treatments, to our knowledge; however, eDNA monitoring has been applied to the detection of invasive fish following eradication attempts (Banks, et al., 2016; Dunker, et al., 2016; Davison, et al., 2017; Davison, et al., 2019). No cabomba eDNA detections in Stan’s Billabong confirms the years of visual surveys and currently held notion that cabomba is no longer extant in this waterbody; however, eDNA detections in Lok Landji Billabong suggest that cabomba might still be present. In light of the knowledge gap regarding cabomba decay rate following chemical eradication treatment with Agricrop Rubber Vine Spray Herbicide or Shark® herbicide (Cabomba Eradication Program Northern Territory, 2019), especially under Northern Territory environmental conditions (e.g., temperature, UV, pH, microbial community), it is difficult to discern whether detected eDNA originated from living plants or legacy DNA present in the sediment surface layer (i.e., remnant DNA from recently decayed or still decaying plant material). The significant increase in cabomba eDNA copies obtained from Lok Landji bottom samples versus surface samples (Figure 3) does not help resolve this ambiguity in that more eDNA would be expected in bottom samples regardless of living plant or legacy DNA origin. Little is known about the longevity of eDNA detection following the chemical eradication of invasive species, with Dunker et al. (2016) providing the only demonstration to date of eDNA detectability following removal of all living individuals of target species. More specifically, eDNA of northern pike (Esox Lucius) was detected in four ponds stocked with fish carcasses (5,410–7,219 g/Ha-m) for approximately 230 days after eradication of all living individuals (Dunker, et al., 2016). As such, detected cabomba eDNA in Lok Landji Billabong approximately 750 days post-eradication could have plausibly originated from legacy DNA given larger pre-eradication biomass (10,000–15,000 g/Ha-m; Christopher Collins personal communication). Aquatic plants can require ≥ 300 days to fully decay in situ (Burkholder and Bornside, 1953) depending on environmental conditions and plant physiology (Jewell, W., 1971), with stem viability increased if under mounds of saturated substrate (e.g., billabong bottom following herbicide-mediated die-off; Dugdale, et al., 2013). Moreover, cabomba does not typically propagate through seed dispersal (Dugdale, et al., 2013); however, seed-based propagation has been observed in northern Australia (Schooler, et al., 2009). In light of this potential for cabomba seed presence within Lok Landji prior to chemical eradication, slow seed decay could provide an additional eDNA reservoir to slowing decaying stems (Burkholder and Bornside, 1953; Jewell, W., 1971) or lead to recolonization along with any small fragments that still contain leaf node (Schooler, et al., 2006; Jacobs and Macisaac, 2009). On the other hand, detected cabomba eDNA could have plausibly originated from living plants given that current surveillance techniques (e.g., benthic raking and drop-cameras) do not provide absolute confidence in living plant detection. Regardless of origin, positive detections in surface samples (Figure 2, Figure 3; Table 1) demonstrate the sensitivity and utility of eDNA for detection of living plants or legacy DNA present at bottom of targeted waterbody. Monitoring for invasive Cabomba caroliniana eDNA in two Darwin River billabongs following eradication attempts | 11
5. Recommendations and conclusions
Failure to detect cabomba eDNA in all other Lok Landji surface samples (n = 38; Table 1) or
in any of the Stan’s Billabong surface samples (n = 5; Table 1) cannot be interpreted as
conclusive evidence of cabomba absence from these billabongs (Roussel, et al., 2015).

To ensure earliest possible detection of cabomba recolonization within chemically treated
eradication zone(s), concurrent eDNA and visual monitoring should be undertaken regularly
until both approaches yield no detections. Future eDNA monitoring efforts should aim to
determine if detections originate from living plants or legacy DNA.

Preference should be given to spatially discrete near-bottom samples over spatially discrete
surface given the higher detection likelihood of eDNA shed from living plants (if present).
However, if logistical challenges prevent this (e.g., equipment decontamination between
sites), then 30 mL surface samples can be utilized. Of note is that surface samples require
screening a higher percentage of extraction elution (≥ 50%) than bottom samples (9%) to
ensure low-copy eDNA is detected if present and that this additional screening incurs higher
analytical costs.

  Monitoring for invasive Cabomba caroliniana eDNA in two Darwin River billabongs following eradication attempts | 12
References
Banks, J. C., Demetras, N. J., Hogg, I. D., Knox, M. A., & West, D. W. (2016). Monitoring
  brown trout (Salmo trutta) eradication in a wildlife sanctuary using environmental DNA.
  New Zealand Natural Sciences, 41: 1-13.

Burkholder, P. R., & Bornside, G. H. (1957). Decomposition of marsh grass by aerobic
  marine bacteria. Bulletin of the Torrey Botanical Club, 366-383.

Cabomba Eradication Program Northern Territory: History and Management (1996 to 2018).
  Technical Report Draft: June 2019.

Davison, P. I., Copp, G. H., Créach, V., Vilizzi, L., & Britton, J. R. (2017). Application of
  environmental DNA analysis to inform invasive fish eradication operations. The Science of
  Nature, 104(3-4), 35.

Davison, P. I., Falcou-Préfol, M., Copp, G. H., Davies, G. D., Vilizzi, L., & Créach, V. (2019).
  Is it absent or is it present? Detection of a non-native fish to inform management decisions
  using a new highly-sensitive eDNA protocol. Biological Invasions, 1-12.

Dugdale, T. M., Butler, K. L., Clements, D., & Hunt, T. D. (2013). Survival of cabomba
  (Cabomba caroliniana) during lake drawdown within mounds of stranded vegetation. Lake
  and reservoir management, 29(1), 61-67.

Dunker, K. J., Sepulveda, A. J., Massengill, R. L., Olsen, J. B., Russ, O. L., Wenburg, J. K.,
  & Antonovich, A. (2016). Potential of environmental DNA to evaluate Northern Pike (Esox
  lucius) eradication efforts: an experimental test and case study. PloS one, 11(9),
  e0162277.

Edmunds, R.C. and Burrows, D. (2019). Development of Cabomba caroliniana (fanwort)
  eDNA Assay: Centre for Tropical Water and Aquatic Ecosystem Research (TropWATER)
  Report 19/09, James Cook University, Townsville. Available at: nespnorthern.edu.au

Edmunds, R. and Burrows, D. (in review). Got glycogen?: Multi-species validation of
  glycogen-aided PPLPP workflow for eDNA extraction from preserved water samples.
  eDNA (19 June 2019).

Jacobs, M. J., & Macisaac, H. J. (2009). Modelling spread of the invasive macrophyte
  Cabomba caroliniana. Freshwater Biology, 54(2), 296-305.

Jewell, W. J. (1971). Aquatic weed decay: dissolved oxygen utilization and nitrogen and
  phosphorus regeneration. Journal (Water Pollution Control Federation), 1457-1467.

Longmire JL, Maltbie M, Baker RJ (1997) Use of ‘lysis buffer’ in DNA isolation and its
  implications for museum collections. Museum of Texas Tech University, 163, 1–3.

Roussel, J. M., Paillisson, J. M., Treguier, A., & Petit, E. (2015). The downside of eDNA as a
  survey tool in water bodies. Journal of Applied Ecology, 52(4), 823-826

Schooler, S., Julien, M., & Walsh, G. C. (2006). Predicting the response of Cabomba
  caroliniana populations to biological control agent damage. Australian Journal of
  Entomology, 45(4), 327-330.

  Monitoring for invasive Cabomba caroliniana eDNA in two Darwin River billabongs following eradication attempts | 13
Schooler, S., Cabrera-Walsh, W., Julien, M., 2009. Cabomba caroliniana gray
  (Cabombaceae), in: Muniappan, R., Reddy, G., Raman, A. (Eds.), Biological Control of
  Tropical Weeds Using Arthropods. Cambridge University Press, Cambridge, pp. 88–107.

Trujillo-González, A., Edmunds, R. C., Becker, J. A., & Hutson, K. S. (2019). Parasite
   detection in the ornamental fish trade using environmental DNA. Scientific reports, 9(1),
   5173.

  Monitoring for invasive Cabomba caroliniana eDNA in two Darwin River billabongs following eradication attempts | 14
www.nespnorthern.edu.au

This project is supported through funding from the Australian Government’s National Environmental Science Program.
You can also read