Drug Screening in Whole Blood Using the Agilent 6546 LC/Q-TOF and the LC Screener Tool with Automated Sample Preparation
←
→
Page content transcription
If your browser does not render page correctly, please read the page content below
Application Note
Forensics

                             Drug Screening in Whole Blood Using
                             the Agilent 6546 LC/Q-TOF and the
                             LC Screener Tool with Automated
                             Sample Preparation

Authors                      Abstract
Karen E. Yannell, PhD, and
Manuel Gomez
                             This application note describes a method for the routine screening of drugs and
Agilent Technologies, Inc.
                             their related metabolites in whole blood. An Agilent 6546 LC/Q-TOF was used with
                             the LC Screener Tool component of Agilent MassHunter Quantitative Analysis 10.1.
                             Automated sample preparation was performed with an Agilent Bravo automated
                             liquid handling platform. This method showcased the ability of the LC Screener Tool
                             to be applied for routine drug screening of forensic toxicology samples.
Introduction                                 However, Q-TOF data analysis, especially      Materials
                                             in data-independent mode, can be time
Mass spectrometers are gaining               consuming for routine testing. With a         Instrumentation and software
traction in forensic and toxicology labs     triple quadrupole method, a lot of time is
                                                                                           For sample preparation, an Agilent Bravo
for their high sensitivity, specificity,     spent on the method development. With
                                                                                           automated liquid handling platform
and ability to screen large numbers of       All Ions acquisition, the acquisition setup
                                                                                           (p/n G5563AA) with the on-deck vacuum
drugs simultaneously. Due to the nature      is very fast, but considerable time is
                                                                                           filtration station was used. The system
of the drug market, new entities are         typically spent on the data analysis. This
                                                                                           was operated with accompanying
emerging constantly, especially illicit      analysis burden is removed with a new
                                                                                           software, Agilent VWorks automation
drugs. Therefore, these labs need to         software tool in MassHunter Quantitative
                                                                                           control software. A Biotage 96-well
update their methods to have a more          Analysis 10.1, the LC Screener Tool.
                                                                                           plate nitrogen dryer was used to dry
comprehensive panel offering as the          The workflow is much more simplified:
                                                                                           sample extracts. An Agilent PlateLoc
market evolves. At some point, the           an analysis method with precursor and
                                                                                           thermal microplate sealer (p/n G5585BA)
number of analytes being tested is           fragment information is created from
                                                                                           was used to seal the plates and an
beyond the targeted capabilities of a        a personal compound database and
                                                                                           Eppendorf centrifuge 5804R, 15 amp,
triple quadrupole method and every time      library (PCDL) containing the analytes of
                                                                                           with a plate rotor, spun the plates. An
a new analyte is added to the method,        interest. Parameters like signal-to-noise,
                                                                                           Agilent 1290 Infinity II LC was used for
a revalidation is required. Furthermore,     mass accuracy, and adduct pattern are
                                                                                           liquid chromatography (LC) and the
the targeted nature of a triple quadrupole   then set for the analytes using a method
                                                                                           Agilent 6546 LC/Q-TOF was used with
method removes the possibility of            setup workflow. When data is analyzed,
                                                                                           Agilent MassHunter Acquisition 10.1
retrospective data analysis for emerging     the software extracts the information for
                                                                                           for data acquisition. The LC included
analytes, for instance a new designer        these analytes and applies the analysis
                                                                                           a high-speed pump (p/n G7120A), a
drug. Using an LC/Q-TOF avoids these         parameters to the extracted data. The LC
                                                                                           multisampler (p/n G7167B), and a
problems, as full-spectrum data in MS        Screener Tool displays all the pertinent
                                                                                           multicolumn thermostat (p/n G7116B).
mode is acquired, allowing the reanalysis    information for data review and allows
of the sample for new drugs without          the user to filter results in a manner that   For data analysis, MassHunter
the need to acquire data again. This         makes analyzing hundreds or even a            Quantitative Analysis 10.1 was used
is achieved with a data‑independent          thousand analytes fast and simple.            with the embedded LC Screener
acquisition mode such as All Ions,                                                         Tool. The method was built using the
                                             Described here is a method that analyzed
which collects signal for every ion and                                                    Agilent Forensic Toxicology PCDL
                                             over 150 drugs and their metabolites in
its fragment. Additionally, the 6546                                                       for TOF or Q-TOF LC/MS systems.
                                             whole blood. The workflow is described
LC/Q-TOF provides high-resolution data                                                     This spectral library contains nearly
                                             from sample preparation through
(R >30,000 at m/z 118) and isotopic                                                        4,000 analytes with expertly curated
                                             data reporting. The chromatography
fidelity at fast acquisition speeds. This                                                  spectra, but only a subset of analytes
                                             was fast and achieved excellent
leads to excellent chromatographic                                                         from this library was used for this
                                             separation in 10 minutes. Experiments
integration with superb identification                                                     study. If spectra needed to be added,
                                             were performed to test the sample
from the accurate mass and isotope                                                         MassHunter Qualitative Analysis 10.0
                                             preparation, reproducibility, sensitivity,
pattern. With this instrument’s high                                                       was used. A Hewlett-Packard Z4 G4
                                             carryover, and longevity of the method.
resolution, mass accuracy, and                                                             Workstation with 64 GB RAM was used
                                             Ten unknown samples from a crime lab
isotopic fidelity, analytes can be                                                         for the data acquisition and analysis.
                                             were also tested. All data analysis was
confidently identified without the need      performed with the LC Screener Tool to
of constant comparison to an analytical      demonstrate its routine and fast analysis
grade standard. All these Q-TOF              capabilities when analyzing Q-TOF data
characterizations are advantageous for       from forensic toxicology samples.
identifying drugs with confidence.

   2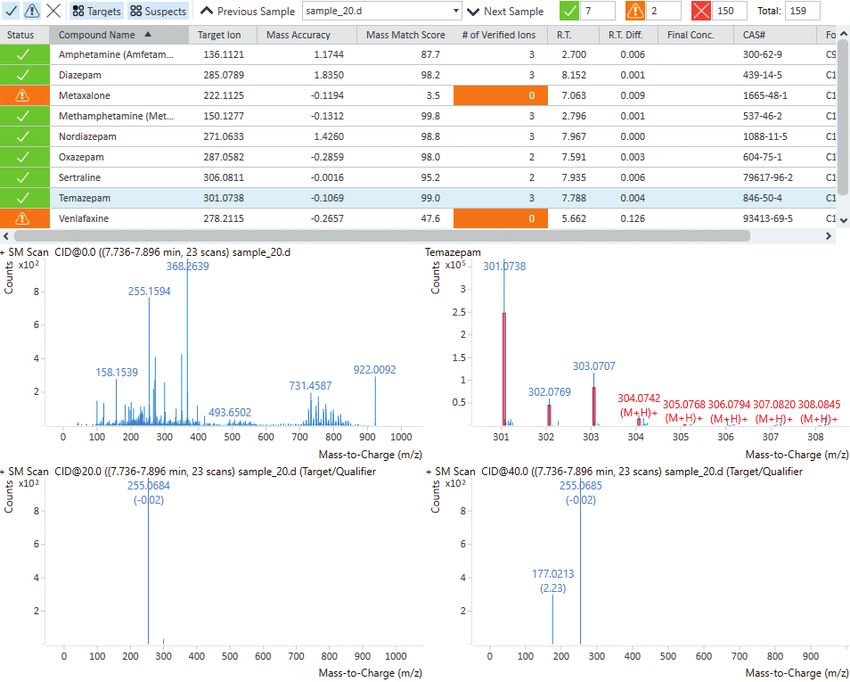
Consumables, chemicals, standards,            Methods                                                pregabalin, did not have a fragment
and samples                                                                                          detected reproducibly at the highest
Pooled and individual lots of blank           Sample preparation                                     concentration tested (25 ng/mL) due to
bovine whole blood were procured                                                                     matrix interference, so this was removed
                                              Analytical-grade standards were
from BioIVT. Analytical-grade chemical                                                               from analysis. The analysis reporting,
                                              diluted to the desired concentrations
standards were purchased from Agilent,                                                               therefore, was based on 153 analytes.
                                              in methanol:water (1:1). To prepare a
Cerilliant, and Cayman Chemical. A full       spiked blood sample at 1x concentration,               Whole blood samples were processed
list of the analytes tested can be found      a 20x standard mix was created and then                on the Bravo platform with a Captiva
in the Appendix. All organic solvents         diluted 20x in blank whole blood. For                  EMR—Lipid 96-well plate. The protocol
and modifiers were HPLC grade and             example, 50 µL of 500 ng/mL standard                   is described in Figure 1. VWorks, the
purchased from Agilent Technologies           in solvent was spiked into 950 µL blank                Bravo automation control software,
or Sigma-Aldrich. Agilent HPLC-grade          blood to create a 25 ng/mL standard                    used a custom program to complete all
methanol was used for the mobile              in whole blood. For most experiments,                  the Bravo liquid transfer and vacuum
phase (p/n 5190-6896). Ultrapure water        the working mixture was 160 analytes                   steps automatically. Some offline steps
was from a Milli-Q Integral system            spiked at 25 ng/mL in whole blood.                     were required (i.e., nitrogen dry down).
equipped with an LC-Pak Polisher and          During method development and                          Automation not only provides precision
a 0.22 μm point-of-use membrane               testing, six analytes were confirmed                   of measurement, but also allows labs to
filter cartridge (EMD Millipore, Billerica,   to have degraded and a new standard                    process a large number of samples with
MA, USA). Captiva EMR—Lipid 96-well           mix could not be acquired. One analyte,                minimal human involvement.
plates (p/n 5190-1001) with 1 mL
collection plates (p/n A696001000)
were used for sample preparation.                  100 µL whole blood—Captiva EMR—Lipid 96-well plate
Both standard and wide-bore 250 µL
pipette tips (standard p/n 19477-002,                 Bravo: 500 µL cold 95% ACN and 5% MeOH, mix
wide‑bore p/n 19477‑032) were used for
liquid transfer with the Bravo platform.
A shallow-well Agilent 96-well plate                          Bravo: vacuum at 90 and 300 psi

(p/n 5043-9310) was used to hold
the final sample, and the microplate                       Bravo: 200 µL 80% ACN and 20% water
was sealed using an Agilent PlateLoc
thermal microplate sealer with a peelable
aluminum seal (p/n 24210-001). This                           Bravo: vacuum at 90 and 300 psi

seal is pierceable and compatible with
the autosampler needle. An Agilent              Remove filter plate, Bravo: 100 µL 90% ACN and 10% DMSO
InfinityLab Poroshell 120 EC-C18
column (p/n 695775-902) was used for
                                                              Dry down: N2 at 40 °C (~2.5 hours)
separation. Reference ions, purine and
HP-921, were purchased from Agilent
(p/n G11969-85003). De‑identified                         Bravo: 100 µL 60% water and 40% MeOH
human whole blood samples were
provided by collaborators.
                                                               Vortex, sonicate, and centrifuge

                                                             Bravo: transfer 75 µL to a new plate

                                                                      Seal with PlateLoc

                                              Figure 1. Procedure for whole-blood drug extraction and matrix
                                              removal using the Agilent Captiva EMR—Lipid 96-well plates. The
                                              pipetting of solvents and vacuum steps was automated with the
                                              Bravo platform. Offline steps include drying down the extraction,
                                              sonicating, and centrifuging for reconstitution.

                                                                                                                                         3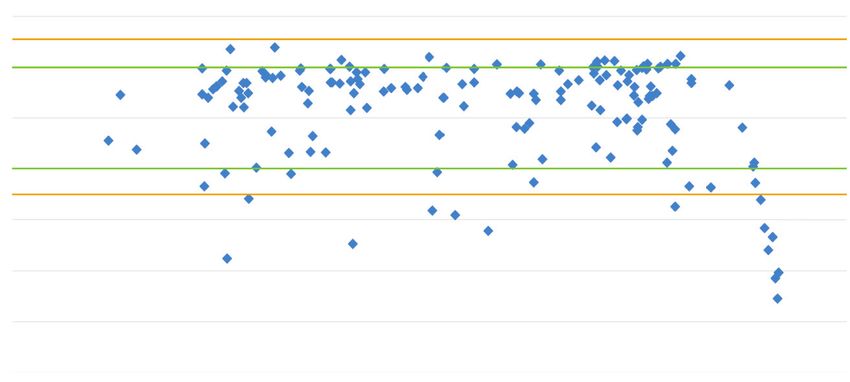
LC/Q-TOF acquisition                         Table 1. Conditions applied with the Agilent 1290 Infinity II LC.

After samples were processed,                           Parameter                                                    Value
they were immediately placed in               Analytical column               Agilent Poroshell 120 EC-C18, 2.1 × 100 mm, 2.7 µm, narrow bore
the Multisampler for analysis using           Column temperature              55 °C
the 1290 Infinity II LC (conditions in        Injection volume                1 µL
Table 1) and 6546 LC/Q‑TOF with               Autosampler temperature         7 °C
Jet Stream source (parameters in              Needle wash                     Standard wash, 10 s, 80% methanol, 20% water
Table 2). Data‑independent All Ions           Mobile phase A                  Water + 0.1% formic acid, 5 mM ammonium formate, 0.5 mM ammonium fluoride
acquisition in positive mode was              Mobile phase B                  Methanol + 0.1% formic acid, 5 mM ammonium formate, 0.5 mM ammonium fluoride
used. With this method, the Q-TOF             Flow rate                       0.5 mL/min
cycled through three different MS-only                                        Time (min)      %A      %B
scans at a rate of 8 Hz: one with 0 CE,                                       0               95      5
                                                                              0.5             92      8
one with 20 CE, and one with 40 CE.                                           1.2             89      11
Purine (m/z 121.050873) and HP-921            Flow rate gradient
                                                                              2               75      25
                                                                              6               55      45
(hexakis (1H,1H,3H‑tetrafluoropropoxy)                                        7.5             30      70
phosphazene, m/z 922.009798) were                                             8.5             2       98
                                                                              9.5             2       98
used as reference ions during the                                             9.51            95      5
analysis to achieve the best mass             Stop time                       10 min
accuracy. SureMass, a data file format        Post time                       1 min
derived from profile data, was enabled
and online data conversion was set as
                                             Table 2. Agilent Jet Stream source and 6546 LC/Q-TOF data acquisition parameters.
a postrun script. After an initial system
tune, the instrument was only calibrated              Parameter                                                    Value
periodically throughout the data              Sheath gas temperature        350 °C
acquisition (approximately once a week).      Sheath gas flow               11 L/min
LC solvents and reference ion solution        Gas temperature               275 °C
were refilled as required. No other           Gas flow                      8 L/min
maintenance was needed.                       Nebulizer                     35 psi

                                              Capillary voltage             4000 V
Data analysis
                                              MS tune                       m/z 750, SureMass optimization enabled
A data analysis method was created in
                                              MS mode                       Positive
MassHunter Quantitative Analysis 10.1
                                              Acquisition                   MS only with 0, 20, 40 CE segments
using a PCDL that contained spectra
                                              MS range                      m/z 40 to 1,000
and retention times for the analytes of
                                              Divert to MS                  0.5 to 9.2 min
interest. The PCDL import workflow
                                                                            m/z 121.050873 ([M+H]+ for purine) and m/z 922.009798 ([M+H]+ for HP-921) in 95%
created the method. The intuitive LC          Reference mass ions
                                                                            acetonitrile and 5% water
Workflow dialog box guided input of
the data analysis parameters. The
parameters set in the LC Workflow are        filters can be employed. For analytes                      Table 3.
what the LC Screener tool used to flag       where there is no tolerance for false
                                                                                                           Parameter                   Value
data. They can be set to be the same         negatives, looser parameters can be
                                                                                                           Mass Extraction             10 ppm (left and right)
for all the analytes in the method, or       used with the tradeoff that more review
                                                                                                           Retention Time              0.3 min (left and right)
for a subset, or a single analyte, which     for that analyte may be needed. The
                                                                                                           Retention Time Outlier      10%
allows flexibility and customization of      parameters used are listed in Table 3.
                                                                                                           Signal‑to‑Noise             3
the parameters for each analyte. This        The complete method was saved and
                                                                                                           Coelution Score             80
is beneficial when dealing with difficult    used for all data analysis. At any point,
                                                                                                           Mass Accuracy               5 ppm
analytes that pose potential to be false     to add a new analyte, the method can
negatives or false positives. For analytes                                                                 Number of Verified Ions     2
                                             be appended with new analytes from a
with the tendency to have false positives,   PCDL or created manually.
stricter thresholds or chromatographic

   4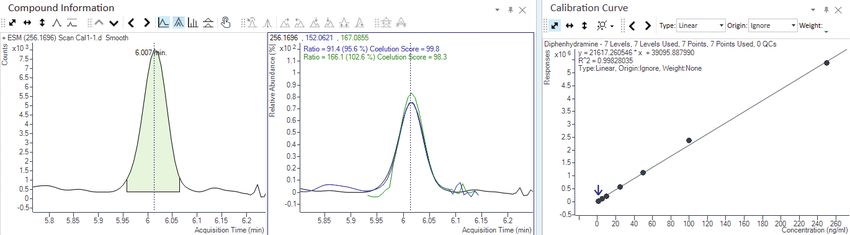
Experimental                                           Each sample was injected to assess                  66 analytes. If a peak was detected in
                                                       the limit of detection (LOD) and relative           the blank, the percent carryover was
A series of experiments was designed                   standard deviation (RSD) at the LOD.                calculated with this equation: carryover
to demonstrate matrix effects, analyte                 A longevity study was performed to                  blank area/10,000 ng/mL sample area.
recovery, reproducibility, robustness,                 assess the robustness of the method                 Since this concentration was so high,
linearity, carryover, and sample variability.          and instrument. A 10 ng/mL spiked blood             when analyte saturation was suspected,
Matrix effects were tested by comparing                sample was injected over 1,400 times on             the 13C isotope was used to calculate
the analyte signal from a post-sample                  the same column. It is worth noting that            the percent carryover. Finally, eight
preparation spiked blood sample to a                   this column had already endured nearly              individual blood samples were spiked
spiked solvent sample (n = 8). The matrix              1,500 injections of processed blood prior           with 25 ng/mL drugs and tested on the
effect calculation was:                                to beginning this study. Over the 11-day            method to assess reproducibility when
                                                       experiment, the only maintenance steps              the matrix varied. These were processed
[1 – (Area of postspike of matrix/Area of                                                                  and injected in replicates of six.
solvent spike)] × 100                                  that were taken were refilling mobile
                                                       phases and reference mass solution as
For recovery, a blank blood sample was                 needed, and a mass calibration twice.               Results and discussion
processed next to a spiked blood sample
(25 ng/mL, n = 8). After processing,                   Quantitative capabilities were tested               Chromatography
the blank sample was spiked to yield a                 with a subset of analytes. A calibration
                                                                                                           The chromatography showed good
25 ng/mL concentration. The calculation                curve ranging from 1–250 ng/mL was
                                                                                                           separation for all the analytes in whole
for percent recovery was:                              prepared in blood then analyzed with the
                                                                                                           blood in under 10 min (Figure 2). There
                                                       method (n = 3).
Area of prespike/Area of postspike × 100                                                                   are several isobaric analytes that require
                                                       To assess carryover, a 10,000 ng/mL                 chromatographic separation, and
Spiked bovine blood samples were                       sample was injected followed by blank               baseline separation was achieved for
prepared at various concentrations                     blood injections. This was done for                 these analytes in this method (Figure 3).
ranging from 0.5 to 25 ng/mL (n = 6).                  several mixtures containing a total of

     ×106

         3.4
         3.2
         3.0
         2.8
         2.7
         2.4
         2.2
         2.0
Counts

         1.8
         1.6
         1.4
         1.2
         1.0
         0.8
         0.6
         0.4
         0.2
          0
               0.5   1.0   1.5    2.0    2.5     3.0     3.5    4.0    4.5     5.0      5.5    6.0   6.5    7.0     7.5    8.0    8.5     9.0    9.5
                                                                      Acquisition time (min)

Figure 2. Chromatographic separation of 153 analytes at 25 ng/mL in whole blood over a 10 min gradient. Good separation and peak shape were achieved.

                                                                                                                                                        5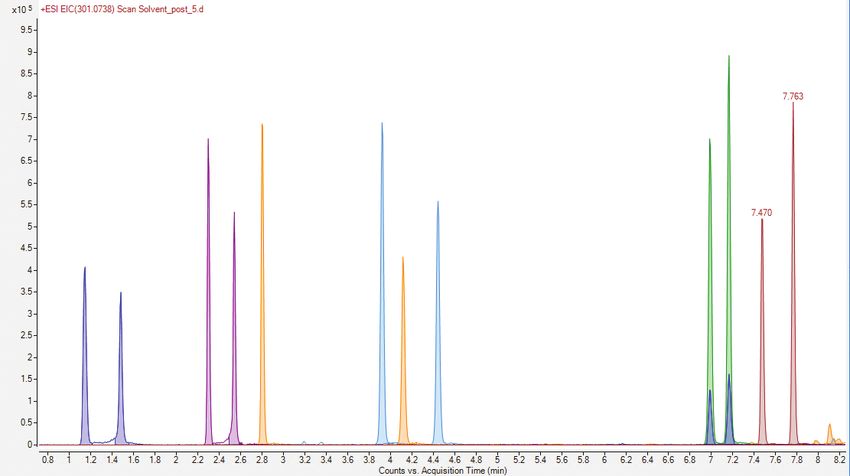
The fast acquisition rates allowed                               ×105

for ample points across the                                              9
                                                                                                                                                                                    J
chromatographic peak (Figure 4).                                                                                                                                                              L
                                                                         8
Furthermore, the Q-TOF’s resolution                                                                          E                G
                                                                                                     C                                                                          I
performance at this faster speed held                                    7
the same as it would at lower speed.
                                                                         6                                                            H
The codeine peak, shown in Figure 4,                                                                     D                                                                                K

                                                            Counts
had 12 precursor ion scans (CE 0),                                       5
                                                                                                                                  F
                                                                                   A
which had an average resolution greater                                  4
                                                                                         B
than 48,000. In-between these data
                                                                         3
points, the Q-TOF was also collecting
data at two other collision energies.                                    2
These nonzero CE scans acquired
                                                                         1
the fragment information for codeine
with the same resolution quality. This                                   0
                                                                             0.8   1.2   1.6   2.0   2.4     2.8   3.2   3.6 4.0 4.4 4.8 5.2            5.6   6.0   6.4   6.8       7.2   7.6     8.0
sufficient number of data points across
                                                                                                                            Acquisition time (min)
the chromatographic peak ensures
robust integration of every peak above                      Figure 3. Extracted ion chromatograph of six sets of isobaric analytes that all have baseline separation
                                                            with this LC method. Morphine (A), hydromorphone (B), codeine (C), hydrocodone (D), O-desmethyl-
the detection limits. For all experiments,                  tramadol (E), N-desmethyl-tramadol (F), methylphenidate (G), normeperidine (H), promethazine (I),
no manual integration was needed due                        promazine (J), temazepam (K), and clonazepam (L).
to this feature.

     ×105                                                   ×104                                                                      ×104
      3.8     m/z 300.1594, avg. R = 45,165                  6.8              m/z 199.0754, avg. R = 39,381                           2.4 m/z 165.0699, avg. R = 38,750
      3.6                                                     6.4
                                                                                                                                      2.2
      3.4                                                     6.0
      3.2                                                     5.6                                                                     2.0
      3.0                                                     5.2
      2.8                                                                                                                             1.8
                                              0 CE            4.8                                                    40 CE                                                              40 CE
      2.6                                                                                                                             1.6
                                                              4.4
      2.4
      2.2                                                     4.0                                                                     1.4
Counts

      2.0                                                     3.6
                                                                                                                                      1.2
      1.8                                                     3.2
      1.6                                                     2.8                                                                     1.0
      1.4                                                     2.4
      1.2                                                                                                                             0.8
                                                              2.0
      1.0                                                                                                                             0.6
                                                              1.6
      0.8
                                                              1.2                                                                     0.4
      0.6
      0.4                                                     0.8
                                                                                                                                      0.2
      0.2                                                     0.4
        0                                                            0                                                                    0
             2.22 2.24 2.26 2.28 2.30 2.32 2.34 2.36 2.38 2.40               2.22 2.24 2.26 2.28 2.30 2.32 2.34 2.36 2.38 2.40                2.22 2.24 2.26 2.28 2.30 2.32 2.34 2.36 2.38
                          Acquisition time (min)                                          Acquisition time (min)                                            Acquisition time (min)

Figure 4. Chromatographic peaks of codeine’s precursor (m/z 300.1594, CE 0) and two fragments (m/z 199.0754 and 165.0699, CE 40). There were 12 data points
collected across their peak when using an acquisition rate for 8 spectra/sec, which provides good integration. Even at this fast acquisition, the resolution of the
precursor averaged to 48,712 and the fragments had a resolution of 39,381 and 38,750 for this analyte. This data was from a blood sample spiked with drugs at
25 ng/mL.

         6
Matrix effects
Sample preparation 5%
11% 21%
and 97% were below 20% matrix effects
(Figure 5). The recovery of the analytes
with this sample protocol was also very
good: 78% of the analytes fell between
80% and 120%, and 91% fell between
70% and 130% recovery. Those that fell
below 70% recovery were late‑eluting
analytes such as cannabinoids, which
are very hydrophobic and have similar
structures to the lipids that were
removed in the sample preparation
(Figure 6).
66%
Figure 5. Pie chart showing matrix effect for 153 analytes. The matrix effects
were calculated as stated in the experimental section. The majority of the
analytes had less than 10% matrix effects, indicating good matrix cleanup was
achieved with the Agilent Captiva EMR—Lipid sample preparation.
140
120
100
Recovery (%)
80
60
Synthetic cannabinoids
40
20
0
0 1 2 3 4 5 6 7 8 9 10
Retention time (min)
Figure 6. Percent recovery plotted against the retention time (min) of the analyte. The calculation for
percent recovery was presented in the experimental section above. The green line indicates 80–120%
recovery and the orange line indicates 70–130% recovery.
7Spiked samples LOD in whole blood 0.5 ng/mL
The LOD was experimentally determined. 4% 1 ng/mL
5%
This was a concentration where 5 ng/mL
the parameters yielded a positive 10 ng/mL
identification for the analyte with the
25 ng/mL
LC Screener Tool. The LOD for the LC
Screener was determined when the S/N
of the precursor and one fragment was 41%
greater than 3, the RSD of the precursor
wasLongevity longevity study was performed by The area was very stable for the analytes,
For the method to be high throughput injecting a 10 ng/mL spiked sample indicating a robust method. The late
and deployed in a routine environment, 1,465 times over an 11-day period. The eluters, cannabinoids, are not stable in
it must produce robust and reproducible area, retention time, and mass accuracy the vial and decreased over time due to
data on an instrument that does not of all the analytes were stable. The data analyte loss and not due to sensitivity
require extensive maintenance. A for morphine, the earliest eluter, is plotted loss. The column used for this study had
in Figure 9. already received over 1,500 injections
A
500000 C Mass accuracy of morphine
9%
400000
Area count
300000 10% 38%
200000
100000
0 17%
0 200 400 600 800 1000 1200 1400
Injection
B 1.44
1.34
Retention time (min)
1.24 26%
0 to 0.5 ppm
1.14
0.6 to 1 ppm
1.04 1.1 to 1.5 ppm
1.6 to 2 ppm
0.94
>2 ppm
0.84
0 200 400 600 800 1000 1200 1400
Injection
D 35%
30%
25%
Signal RSD
20%
15%
10%
5%
0%
0 1 2 3 4 5 6 7 8 9 10
Retention time (min)
Figure 9. Area (A) and retention time (B) of morphine plotted over 1,465 injections. The mass accuracy (ppm) for morphine is reported in the pie chart (C). The
sample was 10 ng/mL drugs in whole blood. The RSD of the 1,465 injections was plotted along with the retention time for all the drugs in the mix (D). The green
line indicates 10% RSD and orange 20%. The high RSD of the cannabinoids is due to the sample degradation over time and not a loss of sensitivity of the Q-TOF.
The maintenance included refilling the mobile phase and reference mass solution as needed and calibrating the Q-TOF twice over the eleven-day experiment.
9from other tests. Additionally, the ×106
study ended at 1,465 injections due to 3.6
10,000 ng/mL sample
3.4
time constraints and not because of
3.2
performance. There was no indication 3.0
that the system could not continue to 2.8
produce high-quality data. 2.6
2.4
Carryover 2.2
Most analytes did not have any carryover 2.0
Counts
and those that did were a very low 1.8
percentage, which would not affect most 1.6
analysis. Twenty-eight analytes had 1.4
carryover that averaged 20%
3%
into the individual bovine samples was 8% 11 to 20%
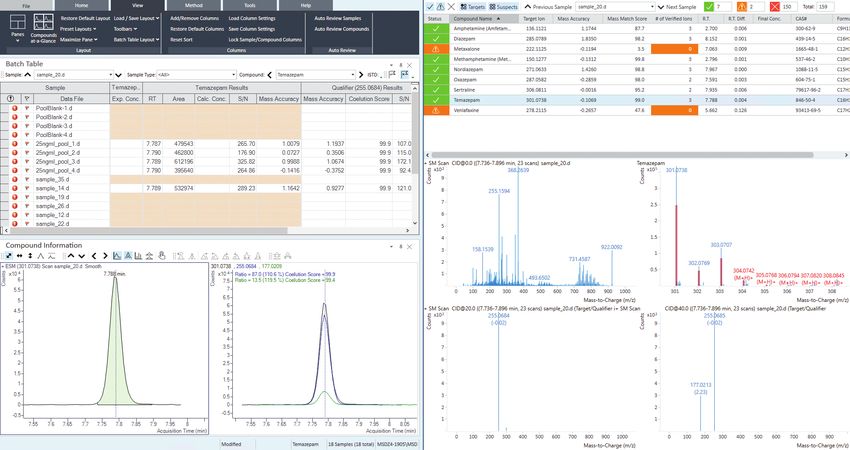
largely stable, with 75% having an RSD 6 to 10%LC screener analysis analyte based on the outlier parameters An analyte needed review (orange) when
With the MassHunter Quantitative defined in the method (reported in the one analysis parameters was an outlier
Analysis software, the combined experimental section). These are flexible (i.e., mass accuracy). If this outlier was
Quant‑My-Way user interface (UI) and the for each analyte, allowing a customizable corrected in the data review process,
LC Screener Tool created a powerful and method to be created. When an analyte the analyte moved to the positively
easy-to-understand analysis experience was selected, related results were identified list (green). This tool filtered
(Figure 12). The LC Screener Tool displayed for confirmation along with and displayed data in a manner that
displayed positively identified analytes in the mass accuracy and fragment makes reviewing hundreds or a thousand
a sample (green), analytes that needed information in the Quant-My-Way UI analytes in a sample easy and fast.
review (orange), and ones that were not and/or Screener Tool (Figure 12 and
identified (red) (Figure 13). The software Figure 13).
determined how to identify each
Figure 12. Quant my Way UI (left) and the LC Screener Tool (right) are complementary windows for fast LC/Q-TOF analysis. When an analyte is selected in either
window, its complementary data appears automatically in the other.
11Figure 13. The LC Screener Tool showed a list of analytes that are positively identified or needed review in the selected sample. Unidentified analytes were
filtered out. Important information like mass accuracy and number of detected analytes was shown in the top table. Temazepam was selected here, so its results
were shown in the analysis panels. The middle left panel shows an average full spectrum at the time when temazepam elutes. The middle right panel shows the
theoretical isotopes for temazepam (red) overlaid with the experimental data (blue). If adducts were present in the data, they would be displayed here as well. The
lower left shows the analytes fragments at CE 20 and the lower right shows the fragments at CE 40.
12Unknown samples with the screening results. When an while the remainder were suspects for
The samples from a collaborator were analyte calibration curve is added, the screening. The calibration curves had
tested on the method. Drugs and their software labels it as a target, allowing an average R2 >0.99 when using wither
metabolites were detected (Table 3). for additional LC Screener filtering. A linear or power fits (n = 3). When a target
Figure 13 shows the positively identified calibration curve is displayed in the analyte is detected, it is quantified, and
sample for temazepam in sample 2. To Compound Information tab of the the reported concentration is displayed
report the results, the simple screener Quant-My-Way UI (Figure 15). Twenty-six in the LC Screener Tool (Figure 13) and
report template (Figure 14) was used. analytes were calibrated and analyzed, the report (Figure 14).
This lists the identified analytes in
the sample and the criteria by which Table 3. Table of positively identified analytes found in ten unknown samples provided by a collaborator.
they were positively identified in a
Sample Drugs Detected
PDF. Other reporting options showing
1 Methamphetamine
chromatograms are also available. With
2 Dihydrocodeine, oxycodone, hydrocodone, oxazepam, temazepam, nordiazepam, diazepam
the developed method, analyzing and
3 Methamphetamine
reporting this data took no more than
4 Diphenhydramine, diazepam, nordiazepam
twenty minutes.
5 Amphetamine, methamphetamine, oxazepam, temazepam, sertraline, diazepam, nordiazepam
Simultaneous quantitation 6 None
If a lab also wanted to quantify all 7 None
or a subset of analytes, this can be 8 Amphetamine, methamphetamine, sertraline
done easily with this platform and 9 Amphetamine, methamphetamine
simultaneously analyzed in this software 10 Gabapentin, 7-aminoclonazepam, EDDP, clonazepam, methadone, lorazepam
Figure 14. One page of the batch report showing the unknown sample 2 results. Only positively identified analytes are listed in the report summary, with the
pertinent information as to why it was identified as positive. If a calibration curve was added, the concentration would also be reported.
Figure 15. Calibration curve for diphenhydramine from 1–250 ng/mL displayed in the Compound Information table of the Quant-My-Way UI. This chromatogram
on the left is for 1 ng/mL of the analyte in blood and its two fragments are overlaid in the center panel. R2 = 0.9982 with linear fit and no weighting.
13Conclusion The data, which contains all the analytes Appendix
precursor and fragment information, is
Sample preparation with the Bravo easy to analyze with the LC Screener List of all tested analytes
liquid handling platform is automated Tool. The whole analysis method setup
and facilitates good matrix removal took under 10 minutes using the wizards. • 10-Hydroxycarbazepine
and analyte recovery. The cannabinoid Once testing and development was • 2-Hydroxyethylflurazepam
recoveries need to be improved, but the completed, the analysis method was • 3,4-Dimethylmethcathinone
detection limits are much better with the saved and was reused for analyzing new
• 3,4-Methylenedioxypyrovalerone (MDPV)
solid phase extraction compared to just batches of data. This analysis workflow
• 4-Methylmethcathinone (Mephedrone)
a liquid extract, where a large amount is very analogous to using MassHunter
Quantitative Analysis software for triple • 6-Acetylmorphine
of signal suppression of the analytes
was observed (data not shown). Overall, quadrupole data analysis, but the data • 7-Aminoclonazepam
automation is beneficial, as it improves here has high resolution, greater mass • 7-Aminoflunitrazepam
lab efficiency and consistency of results accuracy, and isotopic information. • α-Hydroxyalprazolam
by removing manual pipetting steps. The LC Screener Tool only shows you • α-Hydroxymidazolam
The 6546 LC/Q-TOF and the LC information required to identify for the • α-Hydroxytriazolam
Screener Tool make routine drug analyte of interest, which simplifies the
• Alprazolam
screening with a Q-TOF possible. The data review. Furthermore, how it flags
• AM2201
excellent data quality, reproducibility, an analyte for review and filters data
• Amisulpride
and robustness of the 6546 LC/Q-TOF makes batch review and reporting fast.
Although only 153 analytes were in the • Amitriptyline
make it ideal for high-throughput routine
laboratories. Confidently detecting analysis method here, data analysis for • Amoxapine
drugs in a batch of unknown samples over a thousand analytes would not be • Amphetamine
was very straightforward. The fast overwhelming with this software. • Aripiprazole
acquisition rates of the Q-TOF allow Finally, because the data acquired are • Atropine
for excellent integration of a 0.1 min data independent, retrospective analysis • Benzatropine
chromatographic peak while collecting for new or emerging analytes is possible • Benzoylecognine
fragment information—all with high for research purposes. For this, an • Bromazepam
resolution. The mass accuracy of the analyte is added to the method and
• Brompheniramine
analytes and reproducibility of the area the resolution, isotopic pattern, mass
• Buprenorphine
was maintained over the longevity accuracy, and fragments are used to
• Bupropion
study, demonstrating the robustness find suspect identifications. If a PCDL
of the hardware. This performance entry doesn’t exist (no standard at hand), • Cannabidiol
held over 1,400 injections with minimal then precursor and predicted fragment • Carbamazepine
maintenance required, which gives masses can be added manually, and • Carisoprodol
confidence in the data collected over the RT window kept open for the whole • Chlordiazepoxide
time. Furthermore, carryover was either chromatographic run. This capability is • Chlorpheniramine
not found or kept to a minimum with the unique to Q-TOFs and can be used for • Chlorpromazine
LC method. When quantifying analytes, testing emerging drug trends without
• Chlorprothixene
good linearity can be achieved and the collecting new data.
• Citalopram
analysis occurs in the same software,
which improves data analysis efficiency. • Clobazam (Urbadan)
Labs can quantitate commonly found • Clomipramine
analytes and screen for a much larger • Clonazepam
and more uncommon, but still important, • Clonazolam
set of analytes. • Clozapine
• Cocaethylene
• Cocaine
• Codeine
14• Cyclobenzaprine • MDMA • Promethazine
• Desalkylflurazepam • Medazepam • Propoxyphene
• Deschloroketamine • Meperidine • Protriptyline
• Desipramine • Meprobamate • Pseudoephedrine
• Dextromethorphan • Metaxalone • Quetiapine
• Diazepam • Methadone • RCS-4
• Diclazepam • Methamphetamine • Risperidone
• Dihydrocodeine • Methcathinone • Ritalinic acid
• Diltiazem • Methocarbamol • Sertraline
• Diphenhydramine • Methylone • Tapentadol
• Dothiepin • Methylphenidate • Temazepam
• Doxepin • m-Hydroxybenzoylecognine • Thioridazine
• Doxylamine • Mianserin • Topiramate
• EDDP • Midazolam • Tramadol
• Fentanyl • Mirtazapine • Trazodone
• Fluconazole • Morphine • Triazolam
• Flumazenil • Naloxone • Venlafaxine
• Flunitrazepam • Naltrexone • Verapamil
• Fluoxetine • N-DM-Tramadol • Zaleplon
• Flupentixol • N-ethylamphetamine • Zolpidem
• Flurazepam • N-ethylcathinone • Zonisamide
• Fluvoxamine • Nitrazepam • Zopiclone
• Gabapentin • Norbuprenorphine
• Haloperidol • Norclozapine
• Heroin • Nordiazepam
• HU-210 • Norfentanyl
• Hydrocodone • Norketamine
• Hydromorphone • Normeperidine
• Hydroxybupropion • Nortriptyline
• Imipramine • O-Desvenlafaxine
• JWH-018 • O-Desmethyl-cis-tramadol
• JWH-019 • Olanzapine
• JWH-073 • Oxazepam
• JWH-081 • Oxycodone
• JWH-122 • Oxymorphone
• JWH-200 • Paliperidone
• JWH-203 • Paroxetine
• JWH-210 • PCP
• JWH-250 • Pentazocine
• Ketamine • Phenazepam
• Lamotrigine • Phentermine
• Levetiracetam • Pipamperone
• Lorazepam • Prazepam
• MDA • Primidone
• MDEA • Promazine
15www.agilent.com/chem For Forensic Use. DE.3980902778 This information is subject to change without notice. © Agilent Technologies, Inc. 2020 Printed in the USA, March 20, 2020 5994-1744EN
You can also read


