Predictive Analytical Model for Microblogging Data Using Asset Bubble Modelling
←
→
Page content transcription
If your browser does not render page correctly, please read the page content below
International Journal of Cognitive Informatics and Natural Intelligence
Volume 14 • Issue 2 • April-June 2020

Predictive Analytical Model
for Microblogging Data Using
Asset Bubble Modelling
Srinidhi Hiriyannaiah, Department of ISE, Ramaiah Institute of Technology (MSRIT), Bangalore-560054, India &
Visvesvaraya Technological University, Belagavi, Karnataka, India
Siddesh G.M., Department of ISE, Ramaiah Institute of Technology (MSRIT), Bangalore-560054, India & Visvesvaraya
Technological University, Belagavi, Karnataka, India
Srinivasa K.G., National Institute of Technical Teachers Training and Research, Chandigarh, India

ABSTRACT

In recent days, social media plays a significant role in the ecosystem of the big data world and its
different types of information. There is an emerging need for collection, monitoring, analyzing, and
visualizing the different information from various social media platforms in different domains like
businesses, public administration, and others. Social media acts as the representative with numerous
microblogs for analytics. Predictive analytics of such microblogs provides insights into various aspects
of the real-world entities. In this article, a predictive model is proposed using the tweets generated
on Twitter social media. The proposed model calculates the potential of a topic in the tweets for the
prediction purposes. The experiments were conducted on tweets of the regional election in India and
the results are better than the existing systems. In the future, the model can be extended for analysis
of information diffusion in heterogeneous systems.

Keywords
Apache Storm, Asset Bubble Model, Forecasting, Information Diffusion, Sentiment Analysis, Twitter Data

1. INTRODUCTION

With the widespread adoption of internet and smart phones, social media plays a significant role
in various areas of business and research areas with unprecedented reach to users from all walks
of life (Zeng et al., 2010). There is an emerging need to collect, monitor and analyze the different
types of information from social media in the areas of business, politics, public administration
and consumer-decision making (Stieglitz et al., 2014). The motivation of the paper is predictive
analytics based on topics in microblogs of social media that acts as a representative for real world
events (political campaigns, flu propagation, etc.). Twitter is used as a microblog for evaluation
of the prediction and analytics.
     Twitter is an online social networking platform where users exchange the messages in the form of
tweets. It can be attributed as a micro blog where users exchange information in short text form limiting
to 280 characters. The limited size helps to focus on the important part of the message rather than

DOI: 10.4018/IJCINI.2020040107
  This article, originally published under IGI Global’s copyright on April 1, 2020 will proceed with publication as an Open Access article

starting on February 1, 2021 in the gold Open Access journal, International      Journal of Cognitive Informatics and Natural Intelligence (con-
Copyright
verted      © 2020,
        to gold OpenIGI   Global.
                      Access      Copying
                              January       or distributing
                                       1, 2021), and will beindistributed
                                                              print or electronic forms
                                                                          under the termswithout
                                                                                           of the written
                                                                                                  Creativepermission
                                                                                                           Commonsof  IGI GlobalLicense
                                                                                                                     Attribution  is prohibited.
                                                                                                                                         (http://
 creativecommons.org/licenses/by/4.0/) which permits unrestricted use,     distribution, and production in any medium, provided the author of
                                    the original work and original publication source are properly credited.
108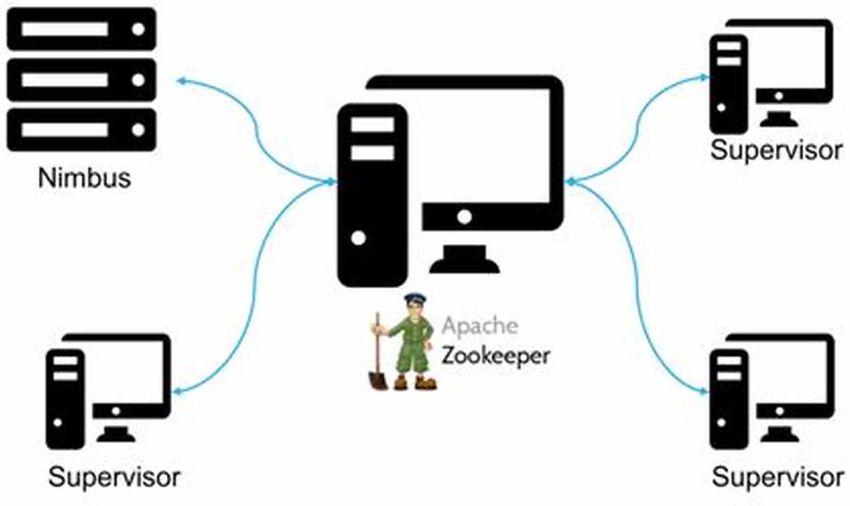
International Journal of Cognitive Informatics and Natural Intelligence
                                                                               Volume 14 • Issue 2 • April-June 2020

reading through the entire text. It is now used as one of the popular social media tools for exchanging
messages. There is a growing base of useful news and knowledge content on Twitter. Users use hash
tags to give context to their tweets and opinions that can be used in data analysis for classification
of tweet. The hash tags allow making tweets relevant to a particular event. The information within a
tweet can be extracted into meaningful information for further analytics.
      The motivation for the implementation of a predictive analytics model is based on ‘topics’ in
microblogs representative of real-world events/phenomenon. In this paper, the prediction model
is proposed by combining the information diffusion and asset bubble model topics. Users in the
twitter tweet about various events. These events are represented as ‘topics’ in the microblog data.
In several instances, since the events are of short-time duration there is no historical data available
that is associated to a topic of interest. It can be in the form of short-time duration data but with no
properties of a time series data. Therefore, the traditional time-series forecasting approaches are not
effective for analysis and prediction.
      For analysis of tweets the proposed method uses information diffusion and asset bubble model.
Each tweet has an influential potential associated with it. For example, consider a tweet “The computer
purchased is good, but the delivery experience was bad”. The potential of this tweet can be seen as
good in terms of the purchase but also bad in terms of delivery. In this paper, such short falls of the
traditional techniques are identified by the proposed method. A topic in the twitter is identified and
its related tweets are collected within a time interval [0,T] and a time-series is built on it. The tweets
are then analyzed to identify the potential of the topic using a parameterized function. The proposed
approach is validated using election related data in the state of Karnataka. The predictions made by
popular media articles are used to validate the claim of prediction.

2. RELATED WORK

Social media platforms allow collecting data and analyzing different types of information from different
users and on different topics. Examples of the social media platforms include Facebook, Google+,
Twitter and others. Facebook and other social media platforms data need to be statically collected
and analyzed whereas twitter provides a streaming API wherein the data can be gathered in real-time.
Hence, in this paper the proposed method is used with microblog twitter. Many of the experiments
related to sentimental analysis choose twitter as the source since it provides the streaming service
for analysis (Owen et.al). However, there are certain drawbacks of the streaming service that include
scalability and processing. In order to address this issue, the proposed system includes Apache kafka
as the platform for receiving the messages from the twitter. Apache kafka includes a message queuing
system wherein it can collect one million messages per second (Kreps et al., 2011).
     The tweets in Twitter network are generated in real-time and need to be processed as soon as
the tweet is generated. The model that analyzes the tweets need to capable of handling the tweets in
real-time. Thus, in the proposed method Apache storm is used as a platform for real-time distributed
processing. In Apache storm a topology is created with necessary spouts and bolts that consume
streams of data from the source specified. In the proposed system, the topology is configured with
source as the twitter, spout emits this data into bolts where the processing of the tweets is carried out.
     In (Bakshy et al., 2012) the role of social networks in information diffusion is examined with
case-studies and experiments. It was evidently found that the information spreads through the network
soon for those who are significantly connected than those who are not connected. The different types
of ties namely strong ties and weak ties between the users in a social network was closely examined
and inferred that the influence was stronger in the locations of strong ties rather than the weak ties.
However, the dissemination of information occurred from the weak ties in the social media. It was
evident from the analysis that most of the novel information was propagated in the social media
through the weak ties. The theory of weak ties was prevalent with sentiments on the different topics
in social media. The main drawback of this approach is the ties of the topics need to visualized in

                                                                                                                109
International Journal of Cognitive Informatics and Natural Intelligence
Volume 14 • Issue 2 • April-June 2020
the form of graph first and then the modularity aspects of the graph need to be addressed. In this
paper, the proposed system addresses this issue by identifying the potential of the topic of the tweet
and then analyzes the impact of it later.
Tweets represented in the form of text usually consist of textual information as well as non-
textual content such as smileys and other emotional icons. Natural language processing (NLP)
plays a key role in analyzing such text with correct semantics. There are various works related to
sentimental analysis of the tweets using NLP. In (Arias et al., 2013) the proposed method is based on
probabilistic machine learning on streaming twitter data to perform sentiment analysis. They analysis
method includes several techniques such as support vector machines (SVM), support trees, linear and
logistic regression models. The most notable advantage of the method is it adopts a corpus which
includes smileys such as:-), :-D, :-(. It also uses time series model which assigns varying weights to
the tweets based on its proximity to the event occurrence. The shortcomings of this approach include
the use of a probabilistic model which is generally not scalable since it cannot be implemented on a
distributed environment. Another limitation is the requirement of a large historic training corpus in
training the model, which may not be available for several events such as the elections (Andrew et
al., 2013; Kiseleve & Ryshik, 2010). A parsimonious rule-based model is proposed in (Kiseleve &
Ryshik, 2010) for sentiment analysis of social media. A rule-based model is used for computational
sentimental analysis that requires less training data. This method of rules helps in analysis of stream
events faster and gives a trade-off for the performance of the model. The proposed method uses this
rule-based model as the base method for identifying the sentimental aspect of the tweet first before
identifying the potential of a tweet.
The concept of asset price bubble formation was proposed in (Kumar & George, 2016). The
main idea is to form a model of bubbles in social context where each term has a definite meaning and
several behaviours. The model was formed using a stochastic differential equation with three factors
i.e. mean stable value, response and random fluctuations. These three factors lead to the formation of
the bubble and different types of simulation were conducted by tuning the factors for the formation
of the bubble. In (Chae et al., 2014) the asset price bubble model was used in the prediction of events
based on twitter streaming data. The algorithm was implemented in three stages, to obtain an asset
bubble, in which the information diffusion increases exponentially until a time T, when the event
occurs. At this instant, the outcome of the event can be predicted with a great deal of accuracy. The
model was implemented for the 2016 US Presidential Elections considering the topics related to the
three candidates namely Sanders, Clinton and Trump. The outcome was even verified against the
actual results from Real Clear which is a US political data source. The proposed approach in this paper
considers the asset price bubble model for analysis (Chae et al., 2014). However, the use of superior
sentiment analysis algorithms with the streaming distributed computing approach using Apache Storm
enables the proposed system to be superior, scalable and fault tolerant than the standalone asset price
bubble model and sentimental analysis (Kumar & George, 2016; Chae et al., 2014).
Public behavioral analysis is one of the key areas of research that is being studied. In the events
of disaster, people respond to the events in different ways. A system of capturing these events helps
in analyzing the behavior of people in different times. In (Goonetilleke et al., 2014), an attempt has
been made to study the influence of events on human behaviour through visualization. The visual
analysis needs a proper management of the platform for storage and analysis. In ((Singh et al., 2010),
the data management and its issues are discussed for the twitter data. The perspective of storage will
play an important role wherein the events need to be captured in real-time. In the proposed system,
Apache storm is used as one of the key platforms for capturing the real-time events.
Microblogging and analytics is used in various areas such as stock market trading and event
analysis (Oliveira et al., 2017). In this regard, the impact of microblogging and analytics is studied in
(Singh et al., 2018). It highlights the importance of returns on the stock market data through analytics
on microblogging data. It also helps in supply chain management industries and applications where
in the events can be tracked and analyzed (Sapountzi et al., 2018). The challenges that exist with the
110International Journal of Cognitive Informatics and Natural Intelligence
Volume 14 • Issue 2 • April-June 2020
microblogging and analytics is the different features available for the analysis. The feature analysis,
data pre-processing, visualization is considered as one of the key challenges for the microblogging
analytics (Li & Liu, 2017; Archambault et al., 2013).
User profiling and crowd management plays an important role in the microblogging analytics. In
(Gupta et al., 2014), the different types of twitter crowds are analyzed to see the impact of topic among
the crowd in the twitter. Sentimental analysis is one of the key applications that will help in such in
twitter crowds. A social media analytical platform is needed for analyzing such crowd sentiments that
has been developed in (Cea et al., 2014). The platform is distributed and helps in analyzing the various
forms of events. Social network analytics can be classified into various forms such as real-time based
events (Cherichi et al., 2016), wherein the different cases of the cloud platforms for twitter analytics
is discussed. Cloud computing plays an important role in performing twitter analytics.
Event classification and analytics is an important part of the analytics in microblogging sites. In
(Azam et al., 2015), various methods are used for exploring the events and detection using microblogs.
These methods consider only analysis of the microblogs and the study of events but the prediction.
Overall, the related work in the data analytics of the microblogging data is on the analysis but not
prediction. In the proposed system, the prediction of the future outcomes is studied with the analysis.
3. PROPOSED SYSTEM
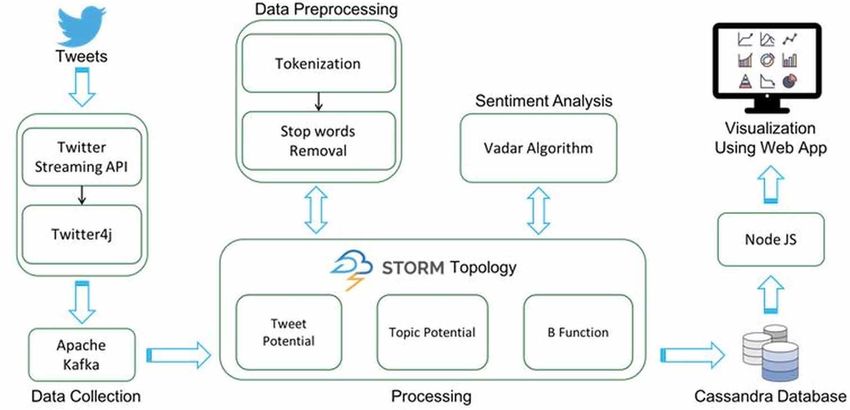
The proposed system has been architected after analysis of various related sources as discussed in
the previous section. The resulting system architecture as shown in Figure 1 which shows the various
components and their interaction with other components of the system. The main components of the
proposed architecture include data collection, data pre-processing and data analysis with visualization
in the dashboard. These components are explored in the further sections.
3.1. Data Collection and Pre-Processing
The data source considered for the analysis is twitter. Twitter utilizes HTTP Streaming protocol to
deliver data services through an open and streaming and connection-oriented API. Conventionally
data to be delivered is sent in batches by repeating requests to users. However, a streaming API uses
a single connection and new results are being sent to the app through this single connection. This
Figure 1. Architecture diagram of proposed model
111International Journal of Cognitive Informatics and Natural Intelligence
Volume 14 • Issue 2 • April-June 2020
allows getting the tweets with very low-latency and high throughput. To maximize the efficiency
by not losing tweets in case of slow processing, distributed messaging framework namely Apache
Kafka is used. Apache Kafka, caches the tweets in a fault tolerant and distributed cluster and then
streams it into Apache Storm Topology for processing. The excess tweets are cached in the Apache
Kafka cluster until the Apache Storm cluster is ready to process them. This ensures that no tweet is
lost even if the velocity of tweets is very high and the storm processing unit cannot keep up with it.
Once the tweets are gathered it is divided into tokens by removing the stop words in the tweet. The
potential of the tweet is calculated in the analysis stage as covered in the further sections.
3.2. Data Analysis
3.2.1. Potential of Tweet
The proposed algorithm calculates the potentials of the tweets and topic under consideration. A time
series graph is generated from the topic potentials. Also, based on these potentials, a curve Δ(t) is
generated using the B-Function which is our asset bubble graph. Potential of tweet pz(x) is defined as
the summation of all the weights of strings in L if the string exists in a tweet and calculated as shown
in Equation 1 where α represents the tokens obtained from the tweets in the data pre-processing phase.
Potential of a tweet pz(x) is defined as writer’s attitude towards a topic under consideration. It employs the
topic measure Z representation. For each tweet, a topic Z is measured, which consists of 3 components
(X, R, δ), where X is a set of strings in tweets, R is a set of asymmetric relations which can be either
‘true’ or ‘false’ between elements of L, and Π is a mapping function that maps a real number with
every element of X (the weight associated to the word). The contents of the tweet are analyzed based
on the topic. The real number associated with each tweet x called potential of tweet, χ(x) and is relative
to the topic Z. The algorithm for calculating the potential of the tweet is as shown in the Algorithm 1:
k
χz (x ) = ∑(αi )I (αi ) (1)
i =1
where:
I (αi ) = 1 if αi is present in the tweet x
= 0 if αi is not present in the tweet x
Algorithm 1: Tweet Potential
Input: Set of tokens for each tweet generated from data pre-
processing stage
Output: Tweet potential for each and every tweet.
Symbols:
• Z = (X, R, δ) is a topic
• X = {α1, α2, α3, α4….αk} is a set of strings in tweets,
• R is a set of asymmetric relations which can be either ‘true’ or
‘false’ between elements of X.
• Π is a mapping function that maps a real number with every element of X
Begin
For k tweets
112International Journal of Cognitive Informatics and Natural Intelligence
Volume 14 • Issue 2 • April-June 2020
For each set of tokens for a tweet repeat until no more tokens are left
Calculate Z-measure for set of tokens in a tweet using
k
χz (x ) = ∑(αi )I (αi ) (1)
i =1
Add it to potential of tweet, p(tw)
End
3.2.2. Topic Potential
Once the potential of a tweet is obtained the topic based on the tweet needs to be estimated for its
potential influence on others. Potential of a topic ϕ(T) is summation of all the potential of tweets
into influence factor as calculated in Equation 2. The topic potential is general attitude of the users
at a particular time t. The influence function Ω(l) is defined by the contribution of a tweet at time
t to the potential of the topic. The contribution of the tweet to the topic being analyzed should be
capture by the influence function. The topic potential definition is very essential as it produces the
time series for analysis:
k
φ (T) = ∑χz (x) *Ω (lz ) (2)
z =1
Algorithm 2: Topic Potential
Input: Tweet potential of every tweet
Output: Topic Potential of a topic
Begin
For every l tweet
Calculate influence using diffusion function of a tweet Ω(l) as
Ω (l) = 1if the tweet is potential of the tweet l > 0
Ω (l) = 0if the tweet is potential of the tweet l < 0
Calculate the potential of a topic Z using
k
φ ( T) = ∑χ (x) *Ω (l )
z z
z =1
Add it to time series graph
End
3.2.3. Prediction
A function (known as B-Function) is used to predict outcomes of scenarios in real time. This function
sets a threshold for making a decision. Decision making is done by comparison of χ(t) vs γ(t) in
[0, T] as shown in Equations 1 and 3. The growth function γ(t) is exponential to k and linear to the
parameters X and Y. Here, k represents as the significant parameter for the growth function γ(t). X
and Y are used as the estimated parameters for the growth function. γ(t) is used for prediction using
a threshold to cross. The decision criterion is based on the threshold fixed for the growth function.
Times series is defined as f([0,T]) using the pair (γ, χ) where χ acts as the threshold parameter. It is
113International Journal of Cognitive Informatics and Natural Intelligence
Volume 14 • Issue 2 • April-June 2020
this parameter that is used to determine the bar cross of the function. The values of X, Y and k are
determined as shown in the Equation 4:
γ (t) = X + Y (T − t)
k
(3)
where t ∈ 0, T , B < 0 and 0 < m < 1
( ) ( (
X = max pz (t) Y = min χ (t) − A / T ) ) (4)
4. EXPERIMENTS AND RESULTS
All experiments are deployed on the locally created cluster. The cluster is as shown in Figure 2. It
consists of five nodes. 3 nodes are Supervisors, 1 node is zookeeper and 1 Nimbus. All the nodes
had 8 gigabytes of memory and sufficient storage. These nodes are in the same local area network.
For validation of our system, tweets related to 2018 Karnataka elections were considered. The
key objective is to predict the chances of the candidates winning. If the candidate is winning the
sentiment associated to the candidate will increase. Candidates are considered as topics and keywords
are associated to corresponding topics. Lot of experiments was conducted using Twitter data collected
at different periods during the primary season. Graphical representation results are described in this
section. Figure 3 shows sentiment for the topic for “BJP”. The model values are plotted for 20 days
with around 68,000 tweets. The BI values are between 0 and 1 for the 20-day period, this indicates
that sentiments will grow after day 20.
Figure 4 shows sentiment for the topic for “Congress”. The topic potential series for congress is
also plotted for 20 days with around 74,000 tweets. The BI values are less to 0 for the 20-day period.
This indicates that sentiments are going to remain stagnant or even decrease after day 20.
For JDS, another major party in Karnataka elections, the number of tweets collected were very
low to do the required analysis for the 20-day period. Therefore, ignored in our analysis. It is also
Figure 2. Cluster architecture for the experiment
114International Journal of Cognitive Informatics and Natural Intelligence
Volume 14 • Issue 2 • April-June 2020
Figure 3. Topic potential time series for BJP
Figure 4. Topic potential time series for congress
noted that the Bar Index values for both parties are very close to each other, indicating a very close
election result with neither having a large margin for victory. This prediction is in line with predictions
from major media agencies.
5. CONCLUSION
Microblogging websites have become a popular networking platform wherein the data can be used
for various analytical purposes and obtain insights out of it. The paper proposed a model based on
115International Journal of Cognitive Informatics and Natural Intelligence Volume 14 • Issue 2 • April-June 2020 the asset bubble model for predicting the events in a microblogging site using election data as an example. The proposed system has been integrated with Apache storm to provide better insights into the events in the microblogging site with suitable visualization for analysis. The results of the proposed system shows that the bar index value of the asset bubble model helps in predicting the future outcomes of the events for data related to micro blogging sites. In future, the proposed system can be extended to heterogeneous ecosystem of data with analysis on different parameters such as real-time visualization of the outcomes. ACKNOWLEDGMENT This research was supported by Ramaiah Institute of Technology (MSRIT), Bangalore-560054 and Visvesvaraya Technological University, Jnana Sangama, Belagavi -590018. 116
International Journal of Cognitive Informatics and Natural Intelligence
                                                                                   Volume 14 • Issue 2 • April-June 2020

REFERENCES

Archambault, D., Greene, D., & Cunningham, P. (2013). Twittercrowds: Techniques for exploring topic and
sentiment in microblogging data.
Arias, M., Arratia, A., & Xuriguera, R. (2013). Forecasting with twitter data. ACM Transactions on Intelligent
Systems and Technology, 5(1), 8. doi:10.1145/2542182.2542190
Azam, N., Abulaish, M., & Haldar, N. A. H. (2015, November). Twitter data mining for events classification and
analysis. Proceedings of the 2015 Second International Conference on Soft Computing and Machine Intelligence
(ISCMI) (pp. 79-83). IEEE. doi:10.1109/ISCMI.2015.33
Bakshy, E., Rosenn, I., Marlow, C., & Adamic, L. (2012). The role of social networks in information
diffusion. Proceedings of the 21st international conference on World Wide Web (pp. 519-528). ACM.
doi:10.1145/2187836.2187907
Cea, D., Nin, J., Tous, R., Torres, J., & Ayguadé, E. (2014, October). Towards the cloudification of the social
networks analytics. Proceedings of the International Conference on Modeling Decisions for Artificial Intelligence
(pp. 192-203). Springer. doi:10.1007/978-3-319-12054-6_17
Chae, J., Thom, D., Jang, Y., Kim, S., Ertl, T., & Ebert, D. S. (2014). Public behavior response analysis in
disaster events utilizing visual analytics of microblog data. Computers & Graphics, 38, 51–60. doi:10.1016/j.
cag.2013.10.008
Cherichi, S., & Faiz, R. (2016). Big data analysis for event detection in microblogs. In Recent Developments
in Intelligent Information and Database Systems (pp. 309–319). Springer. doi:10.1007/978-3-319-31277-4_27
Goonetilleke, O., Sellis, T., Zhang, X., & Sathe, S. (2014). Twitter analytics: A big data management perspective.
ACM SIGKDD Explorations Newsletter, 16(1), 11–20. doi:10.1145/2674026.2674029
Gupta, M., Li, R., & Chang, K. C. C. (2014, April). Towards a social media analytics platform: event detection
and user profiling for twitter. Proceedings of the 23rd International Conference on World Wide Web (pp. 193-
194). ACM. doi:10.1145/2567948.2577264
Kiselev, A., & Ryzhik, L. (2010). A simple model for asset price bubble formation and collapse.
Kreps, J., Narkhede, N., & Rao, J. (2011). Kafka: A distributed messaging system for log processing. Proceedings
of the NetDB (pp. 1-7). Academic Press.
Kumar, A.K., & George, K.M. (2016, December). Application of an Asset Bubble Model to Microblog Data
Analytics. Proceedings of the 2016 IEEE 23rd International Conference on High Performance Computing
Workshops (HiPCW) (pp. 19-27). IEEE.
Li, J., & Liu, H. (2017). Challenges of feature selection for big data analytics. IEEE Intelligent Systems, 32(2),
9–15. doi:10.1109/MIS.2017.38
Oliveira, N., Cortez, P., & Areal, N. (2017). The impact of microblogging data for stock market prediction:
Using Twitter to predict returns, volatility, trading volume and survey sentiment indices. Expert Systems with
Applications, 73, 125–144. doi:10.1016/j.eswa.2016.12.036
Sapountzi, A., & Psannis, K. E. (2018). Social networking data analysis tools & challenges. Future Generation
Computer Systems, 86, 893–913. doi:10.1016/j.future.2016.10.019
Singh, V., Gao, M., & Jain, R. (2010). Event analytics on microblogs.
Stieglitz, S., Dang-Xuan, L., Bruns, A., & Neuberger, C. (2014). Social media analytics. Business & Information
Systems Engineering, 6(2), 89–96. doi:10.1007/s12599-014-0315-7
Tapia, A. H., Moore, K. A., & Johnson, N. J. (2013). Beyond the trustworthy tweet: A deeper understanding of
microblogged data use by disaster response and humanitarian relief organizations. Proceedings of ISCRAM.
Academic Press.
Zeng, D., Chen, H., Lusch, R., & Li, S. H. (2010). Social media analytics and intelligence. IEEE Intelligent
Systems, 25(6), 13–16. doi:10.1109/MIS.2010.151

                                                                                                                    117
International Journal of Cognitive Informatics and Natural Intelligence Volume 14 • Issue 2 • April-June 2020 Srinidhi Hiriyannaiah is a research scholar at VTU. He received his Master of Technology in Software Engineering from M.S. Ramaiah Institute of Technology, Bengaluru (VTU). He is currently working as an Assistant Professor in the Department of Computer Science and Engineering at M.S. Ramaiah Institute of Technology, Bengaluru. He previously worked at IBM India Software Labs, Bengaluru. His main area of interest includes studies related to parallel computing, big data and its applications, information management, and software engineering for education. Siddesh G. M. is currently working as an Associate Professor at the Department of Information Science & Engineering, Ramaiah Institute of Technology, Bangalore. He has published number of research papers in international journals and conferences. His research interests include Data analytics, distributed computing, grid/ cloud computing, and IoT. Srinivasa K.G. is working as a Professor at National Institute of Technical Teachers Training & Research, Chandigarh, India and served as the principal investigator for many projects funded by UGC, DRDO, and DST. He has been a recipient of several awards, published more than 100 research papers, and authored two books. His research areas include data mining, machine learning, and cloud computing. He received his PhD in Computer Science and Engineering from Bangalore University. 118
You can also read