BUDGET 2020 Analysis of Live Register Expenditure
←
→
Page content transcription
If your browser does not render page correctly, please read the page content below

B UDGET 2020

Analysis of Live Register Expenditure
O CTOBER , 2019

O RLAGH L AVELLE
DEASP V OTE
D EPARTMENT         OF   P UBLIC E XPENDITURE            AND   R EFORM

  This paper has been prepared by IGEES staff in the
  Department of Public Expenditure & Reform. The
  views presented in this paper do not represent the
  official views of the Department or the Minister for
  Public Expenditure and Reform.
Executive Summary
At end September 2019 the Live Register (LR) figure was 183,783, the lowest point since January 2008,
representing a reduction of 286,501 or 61% since the peak in 2011. These significant reductions have resulted in
LR savings of over €1.4 billion since 2014. While the LR has performed better than expected in 2019, more recent
data is showing signs of tightening and the LR reaching a lower bound. The 2019 average LR figure is estimated to
be higher than expected at 192,902 and is estimated to be €3m above the 2019 expenditure allocation.

2020 Baseline LR Forecasts
Five methods were used to forecast the LR for 2020 on a no change basis, without an external economic shock.
The forecast average in the table below captures the range of these estimates and outlines that there will be
minimal reductions in the LR in 2020, yielding negligible savings of around €6m.

   Method              Description           Average LR 2020            Jobseeker           Difference on 2019
                                                Number                 Expenditure            REV Allocation
                                                                           €m                       €m
       1        Flat Carryover                    190,784                 1,972                    + 19
       2        Trend, Upward Drift               191,406                 1,977                     + 24
       3        Trend, Flows                      188,680                 1,953                       0
       4        Conversion Method                 185,364                 1,923                     - 30
       5        ARIMA                             183,689                 1,908                     - 45
                Forecast Average                  187,984                 1,947                      -6

Estimated Impact of a No Deal Brexit on the LR in 2020
The Department of Finance (DoF) forecast an unemployment rate of 5.7% in 2020 under a No Deal Brexit, this is
an increase of 0.5% on the 2019 rate of 5.2%. The forecasts are based on the numbers unemployed rising from
125,000 in 2019 to 140,000 in 2020, an increase of 15,000 persons (using the Labour Force Survey (LFS) definition).

Based on the conversion rate method, an increase of 0.5% in the unemployment rate is estimated to increase the
LR by 19,119. However, using observations from previous unemployment crises, in particular in relation to the
interaction of the LR and LFS, it was found that this relationship changes during periods of rising unemployment.
It is estimated that total additional LR costs could range from €164m and €347m in a No Deal Brexit scenario.
These costs are underpinned by an increase in the average LR figure of between 19,119 to 45,721 persons.

Increases in the number of persons on the LR will have further cost implications for other LR related schemes in
2020. Some of these are expected to include Supplementary Payments like Fuel Allowance, Exceptional Needs
Payments and Labour Market Activation supports.

                                                                                                            1
Glossary
JA Jobseekers Allowance
JB Jobseekers Benefit
JA + JB Jobseeker Expenditure
LTU Long-Term Unemployed (> 1 year)
STU Short – Term Unemployed (< 1 year)
LR Live Register
YtD Year-to-Date
UE Unemployment
DEASP Department of Employment Affairs and Social Protection
CSO Central Statistics Office
DoF Department of Finance
ESRI Economic Social and Research Institute
CBI Central Bank of Ireland
LFS Labour Force Survey
DRCD Department of Rural Affairs and Community Development
ILO International Labour Organisation
SIF Social Insurance Fund
21. Introduction
The Live Register (LR) is a monthly series dated back to 1967 which provides a record of the number
of people registering for Jobseekers Benefit (JB), Jobseekers Allowance (JA) or for various other
statutory entitlements with the Department of Employment Affairs and Social Protection (DEASP). It
is a widely used and continually moving metric. In 2019, €20,498 million was allocated to DEASP, of
which €1,953 million was allocated to JA and JB schemes, accounting for 10% of the total allocated
DEASP spend. Over the course of the last seven years there have been significant declines in the
number of persons on the Live Register. Given the large quantum of Jobseeker expenditure, this paper
aims to analyse the current position and forecast developments of the Live Register for the remainder
of 2019 and 2020. The 2020 forecast estimates are written on no change basis, which is under the
assumption of no exogenous shocks to the economy. This sets the baseline position for the LR in 2020.
An additional section is included in this iteration of the LR paper which provides an analysis and
forecast of the impact of a potential Brexit related shock in 2020.
The key objectives of this paper are to:
Brief overview of recent Live Register trends;
Provide analysis on 2019 Live Register position and expenditure compared to profile;
Provide a profile of persons on the Live Register;
Estimate the Live Register outturn for 2019 and the 2020 position;
Impact of potential Brexit shock in 2020.
3Live Register Trends
The Live Register peaked in 2011 with just over 470,000 people signing on. Since then, the LR has been
on a continuous downward trajectory as shown in Figure 1 to reach 183,783 as of end September
2019 (Week 39), a reduction of 286,501 or 61% from the 2011 peak.
Figure 1: Number of persons on the Live Register, 2007- 2019 M09
500,000
470,284
450,000
400,000
350,000
300,000
250,000
183,783
200,000
150,000
100,000
50,000
-
2017M06
2019M07
2007M01
2007M06
2007M11
2008M04
2008M09
2009M02
2009M07
2009M12
2010M05
2010M10
2011M03
2011M08
2012M01
2012M06
2012M11
2013M04
2013M09
2014M02
2014M07
2014M12
2015M05
2015M10
2016M03
2016M08
2017M01
2017M11
2018M04
2018M09
2019M02
LR LR Seasonally Adjusted
Source: CSO Live Register Data
The LR number has significant seasonality, with numbers increasing during the summer months
followed by declines in September1. This seasonality exists irrespective of the unemployment level or
economic cycle, as shown in Figure 22.
1During the summer months (and during mid-terms), there are inflows into the LR; (i) education sector temporary workers
who claim jobseekers benefit (JB), (ii) Back to Education Allowance recipients who do not take up full-time employment
during the summer can enter the LR for this period before exiting in September upon recommencement of course.
2September LR data is necessary when constructing estimates as it provides an important indication of the actual year-to-
date performance of the LR.
4Figure 2: Number of persons on the Live Register, 2016 – 2019 M09
350,000
300,000
250,000
200,000
150,000
100,000
50,000
-
Jan Feb Mar Apr May Jun Jul Aug Sept Oct Nov Dec
2016 2017 2018 2019
Source: CSO Live Register Data
(i) Jobseeker Expenditure
Jobseeker expenditure has reduced since 2010 reflecting developments in the number on the LR and
jobseeker payment rates. Figure 3 shows Jobseeker related expenditure (JA and JB) which peaked in
2010 at €4,104 million and decreased to €2,179 million in 2018, a reduction of €1,925 million.
Expenditure reductions in 2011 and 2012 were primarily driven by reductions in the weekly rate of
payments introduced in Budget 2010 and 20113. In more recent years, the JA and JB expenditure
reductions have been due to falling numbers on the Live Register. Expenditure reductions accelerated
from 2014 reflecting strong labour market performance over the period 2014 to 2018. The
expenditure reductions also meant that jobseeker related expenditure reduced as a proportion of
total DEASP spend. In 2010, jobseeker expenditure accounted for 20% of total DEASP spend, this has
reduced to 11% in 2018, a fall of 9 p.p.
3 Social Welfare rates were reduced by €8.30 and €8 in 2010 and 2011 respectively, reducing social welfare payment rates
from €204.30 to €188 over the period.
5Figure 3: Jobseeker Expenditure, 2009 -2018
4,500 25%
4,000
3,500 20%
Proportion of DEASP spend %
3,000
Expenditure €m
15%
2,500
2,000
10%
1,500
1,000 5%
500
- 0%
2009 2010 2011 2012 2013 2014 2015 2016 2017 2018
JA JB Jobseeker Expenditure as % of Total DEASP Spend
Source: DEASP Admin Data
Table 1 shows more recent developments in total DEASP expenditure alongside jobseeker expenditure
over the 2014 to 2018 period. It demonstrates the quantum of savings that have accumulated through
reductions in the number on the LR and related expenditure, with jobseeker expenditure reducing by
35.6%. This has amounted to €1,190 million in LR savings over a five year period, 2014 to 2018. These
savings have provided additional funding for other areas of DEASP expenditure and have also been
used to fund new Budget measures and consecutive social welfare rate increases.
The underlying DEASP expenditure, which is total DEASP expenditure excluding jobseeker related
expenditure, has increased considerably, rising from €16,442m in 2014 to reach €17,885m in 2018, a
7% increase. This growth in underlying expenditure is masked by the significant LR savings which have
offset expenditure increases. This is demonstrated as total DEASP expenditure over the period
increased by just €254m or 1.3%. In addition, expenditure on employment supports has also fallen
from a peak of €1,024m in 2015 to €724m for 2019 REV allocation, a €300m reduction. €262m of
these expenditure reductions is related to declining demand and scheme closures (JobBridge,
Gateway), with €38m relating to the transfer of the Community Services Programme to the
Department of Rural and Community Development in 2018.
6Table 1: Total DEASP and Jobseeker Related Expenditure4, 2014 - 2018
2014 2015 2016 2017 2018 Change 2014 - 2018
€m €m €m €m €m €m %
Total DEASP
Expenditure 19,785 19,906 19,802 19,944 20,305 +520 +1.3%
Jobseekers
Related 3,344 3,130 2,808 2,444 2,179 -1,190 -35.6%
Expenditure
Underlying
DEASP 16,341 16,776 16,994 17,500 18,126 +1,443 +8.7%
Expenditure
Source: DEASP Admin Data
2. Live Register Profile
While the LR has continued to fall in the early half of 2019, there are indications of the LR reaching its
lower bound or full employment. To assess whether this is the case, revisiting the profile of the
persons remaining on the Live Register will help in informing where the LR is expected to finish in 2019
and the 2020 position.
Non-Live Register Recipients and Dependants
Figure 4 shows the breakdown of the cohorts who receive welfare payments from the Jobseeker
expenditure allocation but are not included in the LR figures. Between 2014 and 2018, this cohort has
been increasing however in 2019 the numbers in this cohort have reduced, falling by 1,825 or 6%. This
is predominately due to lower numbers of Self-Employed and Over 65’s. This non LR cohort has an
upward effect on the average cost per 1,000 on the LR, therefore the lower numbers in this cohort for
2019 may have a small downward effect on the average cost for 2019.
4These expenditure figures includes the Christmas Bonus paid in December to qualifying social welfare recipients; 25%
payment rate in 2014,75% payment rate in 2015 and 2016, 85% payment rate in 2017 and 100% payment rate in 2018.
7Figure 4: Non Live Register Cohorts5; 2014 – July 2019
35,000 1,060
882 731
695
30,000
1,516
25,000 14,762
14,550 14,558
8,218 15,023
2,563
20,000
1,199
15,000
5,214 7,721
8,165
8,609 8,942
10,000 8,418
5,000 10,734 10,085 9,098 7,945 7,356 6,294
0
2014 2015 2016 2017 2018 2019
Self-employed Over 65’s Jobseekers Transition Other*
Source: DEASP Admin Data
Table 2: Persistence Rates for Live Register, 2017 to 2019 Q1
2017 2018 2019 Q1
STU into LTU 24% 23% 22.2%
Source: DEASP Admin Data
Persistence rates in Table 2 measures the movement of those classified as short-term unemployed
(less than 1 year) into long-term unemployment (greater than one year). A low persistence rate is
preferable as it provides evidence that people are not staying on the LR for long periods upon entry
and are exiting the LR into education, training or employment. Since 2017, the persistence rate has
fallen from 24% to 22.2% in Q1 2019, a fall of 1.8 percentage points. This indicates that less people
are moving into long term unemployment.
5The Other category includes recipients of Short-Term Enterprise Allowance; Work Placement Programme; and Systematic
Short-Time workers.
8Figure 5: Live Register by Duration, 1st September 2019
90,000
77,891
80,000
70,000
60,000
Number on the LR
50,000
40,000
30,000 23,488
21,909 21,336
18,566
20,000
12,515
8,145 8,976
10,000 6,267
-Table 3 below shows the breakdown of the LR by duration and the percentage share of each cohort
having some form of dependant i.e. qualified adult (QA), qualified child (QC) or both (QA and QC).
Persons on the LR with dependants are not solely characteristic of those with longer durations on the
LR and appear broadly characteristic of persons across all durations, with between 40% and 56% of
persons in each duration category having some form of dependant. As of 1st September 2019, 46.6%
of people on the LR had some form of dependant, while 53.4% of people on the LR had no dependants
and were individual jobseeker claims. Figure 6 shows the composition of claims with dependants and
individual claims by volume.
Table 3: Persons on the Live Register and Dependants, 1st September 2019
Duration Persons on Live Register Dependant %Figure 6: Overview of Live Register Claimants, 1st September 2019
22,607
31,201
106,215
39,070
No Dependants Qualfied Child (QC) Qualified Adult (QA) Both QA and QC
Source: DEASP Admin data
3. Developments in 2019
This section reviews key LR metrics to assess the current 2019 position which will provide a basis for
the estimated end year position and inform LR forecasts for 2020.
Overview
In 2019, €1,953 million was allocated to fund jobseekers payments, €1,607 million allocated for JA
payments and €346 million for JB payments. This represents a €201m reduction on 2018 levels of
expenditure. The 2019 expenditure allocation was based on a number of assumptions which are
summarised in Table 4. These key assumptions include a 29,604 reduction in the average number of
persons on the LR and an increase of €0.46m in the average cost per 1,000 on the LR to reach an
annual average of €10.19m in 2019.
11Table 4: Key Live Register Budget Parameters, 2018 –2019
2018 Outturn 2019 REV Change
Estimate
Number Number Number
Average Live Register 221,323 191,719 -29,604
€m €m €m
Cost per 1,000 on LR (€m) 9.73 10.19 +0.46
Total Jobseeker Expenditure 2,154* 1,953 -201
Jobseekers Allowance 1,815 1,607 -208
Jobseekers Benefit 339 346 +7
Source: DEASP Admin data *This figure excludes the 2018 Christmas Bonus paid at 100%
Latest Position
(i) Number of Persons on the LR
As at end September 2019, the average number of persons on the Live Register fell from 201,251 to
an average figure of 196,382 over the first 39 weeks of the year. This is 974 below the average LR
profile number as shown in Figure 7.
Figure 7: Average Live Register Profile versus Outturn 2019, Week 1 to 39
205,000
200,000
197,356
195,000 196,382
190,000
185,000
180,000
1 3 5 7 9 11 13 15 17 19 21 23 25 27 29 31 33 35 37 39 41 43 45 47 49 51
2019 Profile 2019 Outturn
Source: DEASP Admin Data
12Table 5 shows a comparison of the LR position from January to September from 2017 to 2019. There
has been a slow-down in the rate and volume of reductions on the LR in 2019, which may suggest
that the economy has reached full employment and the LR is approaching its lower bound.
In 2017 and 2018, between Week 1 – 38, the LR reductions were 30,718 and 28,406 respectively or
11% and 11.9%. Over the same period in 2019, the LR reduction was 13,961 or 6.9% between Week 1
- 38. This suggestion of reaching the lower bound of the LR is reflected by reviewing LR data which
excludes the education sector numbers to assess the current position of the underlying LR (LR
excluding education sector).
Table 5: Comparison of 2017, 2018 and 2019 LR performance for period Jan to Sept (Week 1 - 38)
2017 2018 2019
Change in LR Week 1- 38 - 30,718 - 28,406 - 13,961
Change % - 11% - 11.9% - 6.9%
Source: DEASP Admin Data
a. Education Sector Effects
As mentioned earlier, the LR has a significant seasonal component with LR numbers increasing during
the summer months primarily from the education sector, for example temporary teachers/workers
not on permanent contracts and participants on the Back to Education Allowance scheme7.
Figure 8 shows the underlying LR figure each year from 2016 to July 2019. It shows that the underlying
LR for 2017 and 2018 has been on a downward trend over this period. The beginning of 2019 follows
the patterns seen in previous years, however the increase in the underlying LR during the 2019
summer is higher than in previous years and these increases are of a longer duration. It demonstrates
a slowdown in the rate of reduction in the LR from mid-2019.
7
There is a stock of education sector workers on the LR at any point in time however this number inflates significantly during
the summer months. From 2016 to 2018, this number reached 21,000 in mid-summer, before declining in September. These
are shown in Figure 22 in the Appendix 7.
13Figure 8: Number of persons on Underlying LR, 2016 – 2019 M07
280,000
270,000
260,000 1.2%
250,000
Persons on Underlying LR
240,000
230,000
1.1%
220,000
210,000
200,000
2.8%
190,000
180,000
170,000
160,000
1 3 5 7 9 11 13 15 17 19 21 23 25 27 29 31 33 35 37 39 41 43 45 47 49 51
Week No.
2017 2018 2019
Source: DEASP Admin Data
The larger increases in the underlying LR are likely related to the weekly summer increases lasting for
longer durations; in 2019 there were 10 weeks of consecutive increases to the underlying LR,
compared to 5 weeks of consecutive summer increases in the underlying LR in 2018, as shown in Table
6. This demonstrates that when the education sector seasonality is excluded, there are greater
numbers entering the LR and this will have implications for jobseeker expenditure. This is also
contributing to the slow-down in the rate of reduction. As Table 6 shows, during the summer period
the nominal increase in the LR rose from 2,407 in 2018 to 5,012 in 2019. The 2019 increase represents
a 2.8% increase in the underlying LR during the summer months, compared to a 1.1% increase in 2018.
Table 6: Underlying LR, 2016 - 2019
Summer Period Underlying Live Register LR Change Duration
Increase Increase % Weeks
2016 4,885 1.7% 4 Weeks
2017 3,147 1.2% 4 Weeks
2018 2,407 1.1% 5 Weeks
2019 5,012 2.8% 10 Weeks
Source: DEASP Admin Data
14The decline in the rate of reduction of the LR excluding seasonality is outlined in Table 7. It shows
there was a 44,298 or 14.8% year on year reduction in the LR in 2017. In 2018, the percentage
reduction increased to 15.4% year on year with a decrease of 39,214. The same week in 2019 shows
a year on year reduction of 13.4% or 28,886, a 2 percentage point decline from 2018.
Table 7: Changes in the Underlying LR number at Week 29, 2016 - 2019
Week 29 Underlying Live Register Change YoY Change YoY
Number Number %
22-Jul-2016 299,227 - -
21-Jul-2017 254,929 - 44,298 - 14.8%
20-Jul-2018 215,715 - 39,214 - 15.4%
19-Jul-2019 186,829 - 28,886 - 13.4%
Source: DEASP Admin Data
b. Live Register Inflows and Outflows
The Live Register comprises both Jobseeker Allowance and Jobseeker Benefits recipients8. Reviewing
the LR flows of JA and JB claims also appears to indicate that the LR is approaching its lower bound.
Comparing year to date 2019 flow data to 2018 data over the same period, shows that inflows (LR
entries) to Jobseeker Allowance have decreased by 8,426 or 9% year on year, however outflows (LR
exits) from JA have also decreased by 17,934 or 16%. This means that there is still a downward effect
on JA, but the size of the reduction has declined by 56% between 2018 and 2019. See Table 8 below.
Table 8: Cumulative Jobseeker Allowance Inflows and Outflows Week 1-38, 2018 - 2019
Jobseeker Allowance 2018 2019 Difference %
Cumulative No. Cumulative No.
Inflows 98,619 90,193 -8,426 -9%
Outflows 115,665 97,731 -17,934 -16%
Net effect -17,046 -7,538 9,508 -56%
Source: DEASP Admin Data
Table 9 shows the inflows (LR entries) and outflows (LR exits) from Jobseeker Benefit and compares
the same period in 2018 and 2019. The number entering JB has increased year on year by 3,491 or
3.7%, and the number exiting JB has reduced by 566 or 0.6% year on year. While there is still a
8In addition, people on credits are also counted in the LR total number however they are not in receipt of a payment.
There are 22,414 on the LR that are not on a JA or JB payment and are claiming PRSI credits, as of September 2019.
15downward net effect in 2019 of 896, this is significantly smaller than in 2018, an 81% reduction in the
net effect. This is indicating collectively that less people are becoming unemployed and entering the
LR, however those already on the LR appear to be staying on the LR and are not exiting as readily as
in previous years.
Table 9: Cumulative Jobseeker Benefit Inflows and Outflows Week 1-38, 2018 -2019
Jobseeker Benefit 2018 2019 Difference %
Cumulative No. Cumulative No.
Inflows 92,451 95,942 + 3,491 3.7%
Outflows 97,404 96,838 - 566 - 0.6%
Net Effect - 4,953 - 896 + 4,057 - 81%
Source: DEASP Admin Data
(ii) Live Register Expenditure
Table 10 shows that jobseeker expenditure outturn to August amounted to €1,327m, this is €6m
below what the expenditure was profiled to be. This can be expected given that the average LR is also
below profile. The average cost per 1,000 is €10.04m as of August 2019, which is €0.01m below the
profile figure of €10.05m.
Table 10: Comparison of 2019 profile and outturn for Key LR metrics
2019 Profile 2019 Outturn
Variance
(August) ( August)
Average Live Register 198,515 197,180 -1,335
Cost per 1,000 on LR
10.05 10.04 -0.01
(€m)
Jobseekers expenditure €m €m €m
Jobseekers Allowance 1,092 1,090 -2
Jobseekers Benefit 241 237 -4
Total 1,333 1,327 -6
Source: DEASP Interim Finance Report, CSO Live Register data
16(iii) Live Register Average Costs
Average costs per 1,000 on the LR have a number of drivers which make them challenging to forecast.
The average LR costs are influenced by the composition of the LR i.e. the number of persons who have
dependants versus a single claimant and the number of persons on the Non-Live Register9 i.e. persons
who are not on the LR but who are paid from the jobseeker allowance expenditure, this cohort will
increase average costs. New Budget measures will also increase average costs, for example
consecutive social welfare rate increases have driven up average costs in recent years and the
introduction of Jobseeker Benefit for the self-employed from November 2019 will also impact average
costs.
Finally, the number on the LR has a non-linear negative relationship with jobseeker expenditure,
meaning that reductions in the number on the LR will not result in an equal reduction in LR related
expenditure. The non-linear negative relationship between the LR and average cost per 1,000 means
that as the number on the LR decreases, the average cost per 1,000 increases and vice versa. The large
declines in the LR in recent years has contributed to the annual increases in the average costs shown
in Table 11. As of August 2019, the average cost per 1,000 is €10.04m, which €0.15m or 1.5% below
the 2019 profiled annual average for 2019.
Table 11: Average cost per 1,000 on the LR, 2012 - 2019
2012 2013 2014 2015 2016 2017 2018 2019 2019
Annual August
Profile
Average cost per 1,000 (€m)
8.67 8.74 8.66 8.69 9.23 9.39 9.73 10.19 10.04
Annual change (€m)
0.07 -0.08 0.03 0.54 0.16 0.34 0.46 -0.15
Annual change (%)
0.8% -0.9% 0.3% 6.2% 2% 3.6% 4.7% -1.5%
Source: DEASP Admin Data
9Over 65s are those who were in receipt of a jobseekers payment and are in transition for qualifying for the state pension
at age 66 years. These individuals are not on the official LR but are paid from the Jobseekers expenditure allocation.
174. Forecasts
This section sets out the methodologies used for estimating the number of persons on the Live
Register and the associated jobseeker expenditure for the remainder of 2019 and 2020. Economic
shocks are not included in the forecasts presented here which are intended only to forecast the
baseline position for 2020.
Box 1: Previous Live Register Forecasts10
The table below outlines how the LR forecasts from previous iterations of the Live Register paper
have performed compared to the actual LR outturn figure. It shows that overall the forecasts have
a variance of between 1% and 3%.
Live Register Forecast Average LR Actual Average LR Variance Variance
paper Number Number Number %
2014 395,000 385,000 - 10,000 - 3%
2015 340,000 344,234 + 4,234 + 1%
2016 306,250 303,749 - 2,501 - 1%
2017 267,800 263,876 - 3,924 - 1%
2018 225,967 221,323 - 4,644 - 2%
The mean absolute percent error (MAPE) expresses accuracy as a percentage of the error. The
MAPE for the LR forecasts from previous iterations is -1.2%, which means on average the LR
forecasts have a deviation of -1.2%, and as such are considered accurate and within acceptable
standard deviations for forecasting (Athanasopoulos, 2018). See Appendix 9.
102014 LR paper can be accessed here: https://igees.gov.ie/wp-content/uploads/2014/11/Analysis-of-Jobseekers-and-Related-
Expenditure.pdf
2015 LR paper can be accessed here: https://igees.gov.ie/wp-content/uploads/2014/11/Analysis-of-Jobseekers-and-Related-Expenditure-
1.pdf
2016 LR paper can be accessed here: https://igees.gov.ie/wp-content/uploads/2013/06/FINAL-Estimating-JA-and-JB-for-2016-2017.pdf
2017 LR paper can be accessed here: https://igees.gov.ie/wp-content/uploads/2018/04/Analysis-of-Live-Register-and-Related-
Expenditure.pdf
2018 LR paper can be accessed here: https://igees.gov.ie/wp-content/uploads/2019/01/Analysis-of-Live-Register-Related-Expenditure.pdf
18Methodology
Economic forecasters often have a variety of different models and forecasts of the same variable from
which to choose. These models and forecasts may differ due to underlying assumptions, or differences
in the data used. Forecasts from a given method may provide some useful information that is not
conveyed in forecasts from other methods. Thus, instead of choosing a single forecasting method, a
technique called forecast averaging considers information generated by several forecasts and then
combines this information.
A number of studies have shown that averaging forecasts of multiple methods is more accurate than
limiting a forecast to a single method. Timmermann (2006) offers a good overview of such studies,
citing Clemen (1989) and Makridakis (2000) in particular. The approach taken in this analysis is to
employ a number of forecast techniques ranging from simple trend forecasting method to more
complex autoregressive modelling, and then to take an average forecast of these methods.
Forecast Methodologies
Method 1: Flat Method with Seasonality (Carryover No trend)11
This method uses the 2019 estimated outturn for end year as the baseline starting position for 2020
with seasonal increases over the year based upon the same volume of seasonality in 2019. It assumes
a flat trajectory for 2020 with no downward trend component. The method intends to capture the
pure carryover impact of having a lower starting number in 2020 than in 2019.
Method 2: Trend Upward Drift Method
This method uses the 2019 estimated outturn for end year as the starting position for 2020. It is based
on two data components, the underlying LR and the education sector number on the LR. It uses the
average trend increase in the underlying LR seen in 2019 up to week 29 (July) which is an average
weekly change of 0.3%, and this trend is carried through to 2020 and is increased to 0.4% for the latter
half of 2020, a slight acceleration in the average increase in the underlying LR. The number of persons
relating to the education sector on the LR is kept constant on 2019 levels. This method allows the
forecasts to increase or “drift” upwards over time based on the average increase in the more recent
observed LR data. The forecasts for the increase in the underlying LR is shown in Figure 18 in the
Appendix 1.
11The 2020 estimates are inclusive of the additional numbers expected on the LR as a result of the introduction of the JB for
the self-employed. It is estimated that this will increase the LR by 1,980 in 2020. These are indicative estimates of take up
from DEASP.
19Method 3: Inflows and Outflows Trends
The LR is a constantly moving metric with large volumes of inflows and outflows reflecting the
movement of workers and seasonality of certain sectors. Using LR flows data in forecasting takes
account of these movements and captures the LR trends beneath the overall LR aggregate figure to
inform the 2020 position. The recent inflows and outflows average trends are extrapolated forward
to 2020; on average inflows have reduced by 0.2% however, outflows have reduced by 7% on average
in 2019 year to date (Week 1- 38).
Method 4: Conversion Rate Method
The conversion method calculates the number on the Live Register for every 1% unemployment rate
published in the Labour Force Survey (LFS). This methods uses the macroeconomic unemployment
forecasts from the Department of Finance and the Central Bank for 2019 and 2020 and applies the
change in the unemployment rate between 2019 and the 2020 forecast and converts this change into
a corresponding Live Register forecast for 2020. The average conversion number12 is 38,238, this
means that every 1% unemployment rate equates to 38,238 persons on the Live Register. The
conversion rate estimate results in a 4% year on year reduction in the LR.
Method 5: Auto-Regressive Integrated Moving Average Method (ARIMA13 model No Seasonality)
An ARIMA is a forecasting technique that is used to regress a variable on its lagged values and errors,
and then forecast future data points for the variable. ARIMA projects the future values of a series
based on its own inertia, and can be used in conjunction with exogenous independent variables. Its
main application is in the area of short-term forecasting. It optimally works when the data exhibits a
stable or consistent trend over time with a minimum number of outliers, which the annual LR data
demonstrates. The ARIMA model uses seasonally adjusted monthly CSO data backdated to 1970 to
most recently available monthly LR as at August 2019.
12 This is the average conversion number from monthly data between 2017 and August 2019. Further detail on the conversion
rate number can be found in Appendix 2.
13Auto-Regressive, Integrated, Moving Average Model. The LR forecast was modelled using Eviews software which ran 600
econometric models and specification tests to ensure the best fitted model was used in the forecast projection.
20Results
a. End 2019
The 2019 outturn figure provides the baseline LR for the 2020 estimates. Using the current year to
date position, the end 2019 position for the LR was estimated using a trend analysis factoring in a
slowdown in the year on year rate of reduction to 0.3% over the remainder of the year. This is the
average weekly change in the lower rate of reduction which can be seen in more recent summer 2019
data14. In addition, the introduction of the Jobseeker Benefit for the Self-Employed from November
2019 is projected to result in an additional 350 persons on the LR by end 2019.
The 2019 trajectory and forecast outturn can be seen in Figure 9. The end year 2019 outturn figure is
estimated to be 186,763 and this figure forms the baseline or starting position for 2020. At the
beginning of 2019 the LR was 201,251 and this estimate would result in an in-year reduction of 14,488
or 7.1%. This is compared to a 19% in-year reduction in 2018. The average LR figure for 2019 is
estimated at 192,902, which is 1,183 higher than estimated. The 2018 average LR was 221,323 which
would correspond to an average year on year LR reduction of 28,421 or 12.8% in 2019. This compares
to the 2017 to 2018 year on year average reduction of 38,882 or 15%.
Figure 9: Live Register Trajectory and Forecast for 2019
300,000
280,000
260,000
238,052
240,000
220,000
201,251 199,669
200,000
180,000
Average LR 2020 = 192,902 186,763
160,000
140,000
120,000
100,000
1 3 5 7 9 11 13 15 17 19 21 23 25 27 29 31 33 35 37 39 41 43 45 47 49 51
2018 2019 2019* 2017
Source: DEASP Admin data & Author' own calculations
14 Details can be found in Figure 19 in Appendix 1.
21The key metrics for the 2019 estimated outturn are set out in Table 12 below. The average cost per
1,000 figure is estimated to finish €0.05m below profile. This is calculated using 2018 weekly changes
in the average cost per 1,000 on 2019 baseline data to date15 to estimate average 2019 outturn. The
lower than profiled average costs is primarily due to a reduced number of non LR recipients and a
higher LR number than profiled. Based on trends to date and the expected slowdown in the LR
trajectory for the remainder of 2019, the LR 2019 expenditure outturn is estimated to be €3m over
profile.
Table 12: Key Live Register metrics, 2019 Outturn
2019 Allocation 2019 Estimated Outturn Variance
Number Number Number
Average Live Register 191,719 192,902 +1,183
€m €m €m
Average Cost per 1,000 on LR 10.19 10.14 -0.05
Jobseekers expenditure 1,953 1,956 +3
b. 2020 Forecasts
Method 1: Flat Method with Seasonality (Carryover No trend)
Using Method 1 the 2020 LR is estimated to have a relatively flat trajectory from the 2019 outturn,
with LR increases from seasonality only, as shown in Figure 10. The latter half of 2020 increases above
2019 levels as there is no downward trend component offsetting the seasonal increases. The
estimated end year 2020 figure is 191,460. This method has an estimated average LR for 2020 of
190,784 and an average year on year reduction of 2,118 or 1%.
15Analysis and extrapolation of 2018 weekly trends uses only full payment weeks and excludes December figures due to
impact of the Christmas Bonus paid in the first couple of weeks in December.
22Figure 10: Method 1 Flat No Trend (Carryover Impact)
260,000
240,000
220,000
191,460
200,000
180,000 188,345
Average LR 2020 = 190,784 186,763
160,000
140,000
120,000
100,000
1 3 5 7 9 11 13 15 17 19 21 23 25 27 29 31 33 35 37 39 41 43 45 47 49 51
2018 2019 2019* 2020*
Source: DEASP Admin data & Author’s own calculations
Method 2: Upward Trend Drift Method
Method 2 shown in Figure 11 below, takes into account the increase in the underlying LR (LR minus
education sector) which was discussed earlier. It estimates an end year 2020 figure of 191,758 and an
average LR for 2020 of 191,406, an average year on year reduction of 1,496 or 0.8%.
23Figure 11: Method 2 Upward Drift Method
260,000
240,000
220,000
191,758
200,000
180,000 187,706
186,763
Average LR 2020 = 191,406
160,000
140,000
120,000
100,000
1 3 5 7 9 11 13 15 17 19 21 23 25 27 29 31 33 35 37 39 41 43 45 47 49 51
2018 2019 2019* 2020*
Source: DEASP Admin data & Author’s own calculations
Method 3: Inflows and Outflows Trend Analysis
Method 3 uses the trend inflows and outflows from 2018 and 2019 data. This method accounts for a
reduced number of LR exits but also a reduced number of inflows into the LR. This is based upon
average percentage changes in the LR flows between 2018 and 2019 year to date. Additional detail
can be found on this in the Appendix 10. It estimates an end year 2020 figure of 184,464 and average
LR for 2020 of 188,680, an average year on year reduction of 4,222 or 2.1%.
24Figure 12: Method 3 Trend Inflows and Outflows
260,000
240,000
220,000
186,763
200,000
180,000 188,523
184,464
Average LR 2020 = 188,680
160,000
140,000
120,000
100,000
1 3 5 7 9 11 13 15 17 19 21 23 25 27 29 31 33 35 37 39 41 43 45 47 49 51
2018 2019 2019* 2020*
Source: DEASP Admin data & Author’s own calculations
Method 4: Conversion Rate Method
Method 4, the conversion method is conducted using the Department and Finance and Central Bank
most recent unemployment rate forecasts for 202016. The method captures the change in the
unemployment rate and applies this change to the LR estimate for 2020 on a monthly basis. Using this
method, the end year 2020 figure is estimated to be 176,698, with an average LR for 2020 of 185,364,
an average year on year reduction of 7,538 or 3.9%.
162020 forecasts from the Department of Finance are from the 2019 Summer Economic Statement and are estimated at
5.2%, which is a 0.2% reduction from 2019 estimate of 5.4%. The Central Bank forecast is from the Quarterly Bulletin Q3
2019 which estimates an unemployment rate for 2020 of 4.5%, a 0.2% reduction from 2019 forecast of 4.7%.
25Figure 13: Method 4 Conversion Rate Method
240,000
220,000
200,000
183,100
180,000
Average LR 2020 = 185,364
176,698
160,000
140,000
120,000
Jan Feb Mar Apr May Jun Jul Aug Sep Oct Nov Dec
2020* 2019* 2019 2018
Source: DEASP Admin data & Author’s own calculations
Method 5: Average Method with No Seasonality (ARIMA17 model)
Method 5 is the Average Method (ARIMA model) and uses monthly seasonally adjusted LR data and
by extension produces monthly seasonally adjusted forecast estimates for 2019 outturn and 2020. It
estimates an average LR of 190,874 for 2019, a lower average LR than the trend forecast due to no
seasonality. The 2020 end year figure is estimated at 184,190 and an average LR for 2020 of 183,689.
This would mean an average year on year reduction of 9,213 or 4.7%. This method is indicating an LR
lower bound of approximately 184,000.
17
Auto-Regressive, Integrated, Moving Average Model. The forecast was estimated using Eviews software which ran 600
models and specification tests to ensure the most appropriate model was applied to the LR data.
26Figure 14: Method 5 Average Method, Seasonally Adjusted (ARIMA Model)
250,000
240,000
230,000
220,000
210,000
200,000
184,724
190,000
180,000 184,342 184,190
Average LR 2020 = 183,689
170,000
160,000
150,000
Jan Feb Mar Apr May Jun Jul Aug Sep Oct Nov Dec
2018 2019 2019* 2020*
Source: CSO data & Author’s own calculations
c. Average costs
As discussed earlier, average costs are influenced by many factors, including the actual LR number
itself given the non-linear negative relationship between LR number and average cost. It is also
influenced by the percentage share of the LR number in payment, as not all those on the LR receive a
payment18.
The number of persons in payment has increased on average by 2% in 2019 compared to the same
period in 2018, increasing from an average of 90% to 92%. In 2016 and 2017, the average pay share
was 89%19.
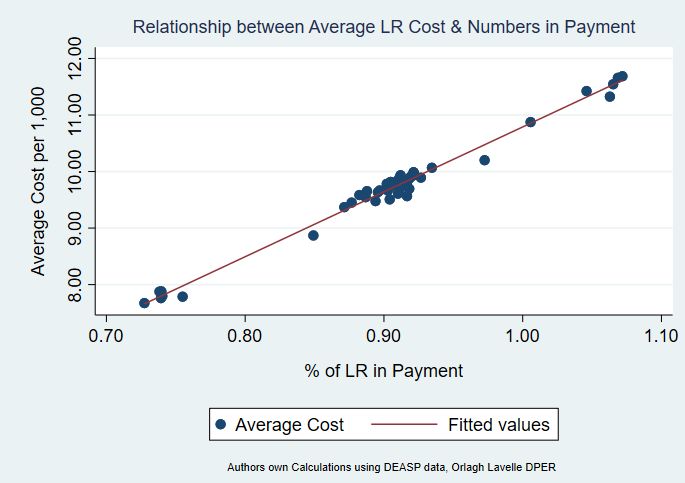
A regression analysis was conducted to establish the elasticity between the average cost per 1,000 on
the LR and the percentage share of the LR that are in payment. This found a positive statistically
significant relationship, with every 1% increase in the percentage share of the LR in payment
increasing the average cost by 1.21%. Regression analysis results on average costs can be found in
Appendix 4.
18 This may be due to payment sanction and suspension and people who are signing on LR for PRSI credits only.
19 Further detail on the components of the pay share is outlined in Appendix 6.
27Between 2018 and 2019, there was a 2% increase in the pay share which was equivalent to a 28,421
average year on year reduction. Based on these figures, it is assumed that a 1% change in the LR pay
share relates to 14,210 decrease in the LR number. This relationship is used to estimate the average
cost per 1,000 on the LR for each method outlined in the paper. The breakdown of these components
to the average cost for 2020 can be seen in Table 13 below. It is expected that the percentage share
in payment will remain relatively flat on 2019 levels given that minimal further decreases are expected
on the LR in 2020.
In addition, the introduction of the Jobseekers Benefit for the self-employed is estimated to have an
annual cost additional cost of €15m. The extra pay day20 for Jobseeker’s Benefit is estimated to cost
€2.91m in 2020 and will result in a higher cost for 2020 on a one off basis. The carryover cost of the
payment rate increases from March 2019 has an estimated cost €10m in 2020, and this will also
increase the average cost. It is estimated that collectively these components will increase average
costs by €0.18m per 1,000 in 2020.
Table 13: Breakdown of Average Cost per 1,000 on 2020 Forecasts
Method 1 2 3 4 5 Forecast
Average
LR Average Reduction 2,118 1,496 4,222 7,538 9,213 4,918
Increase in Pay Share
0.15% 0.11% 0.30% 0.53% 0.65% 0.35%
(%)
Increase in Average
0.1509% 0.1166% 0.3007% 0.5369% 0.6562% 0.3502%
Cost (%)
Average Cost per 1,000
10.16 10.15 10.17 10.19 10.21 10.18
€m
Average Cost per 1,000
10.34 10.33 10.35 10.37 10.39 10.36
with Carryover €m
Source: DEASP Admin Data and Author’s own Calculations
Table 14 below outlines the five 2020 estimates which take into consideration the potential
trajectories of the LR in 2020.
1. The Flat Carryover method estimates an average LR for 2020 of 190,784, with an expenditure
requirement of €1,972m, which is €19m above the 2019 REV allocation.
2. The Trend Upward Drift method estimates an average LR of 191,406 with a cost of €1,977m,
which would result in €24m above 2019 REV allocation.
3. The Trend Flows method estimates an average LR of 188,680 with an expenditure
requirement of €1,953m which would result in no change on the 2019 REV allocation.
20 2020 isa leap year and as a result of the extra day in the calendar year payments made on Wednesdays and Thursdays will
receive an additional payment i.e. 53 payments instead of 52 payments normally.
284. The Conversion Rate method estimates an average LR for 2020 of 185,364, with an
expenditure requirement of €1,923m resulting in savings of €30m.
5. The ARIMA method estimates an average LR in 2020 of 183,689 with an expenditure
requirement of €1,908m which would result in a savings of €45m.
The forecast average of the five methods combined estimates an average LR of 187,984 with an
expenditure requirement of €1,947m, which would yield a savings of €6m on the 2019 REV allocation.
Table 14: Estimates for 2020 Live Register Number and Expenditure
Method Description Average LR Average Cost Per Jobseeker Difference
2020 1,000 Expenditure from REV
Number €m €m €m
1 Flat Carryover 190,784 10.34 1,972 19
Trend, Upward
2 191,406 10.33 1,977 24
Drift
3 Trend, Flows 188,680 10.35 1,953 0
Conversion
4 185,364 10.37 1,923 - 30
Method
5 ARIMA 183,689 10.39 1,908 - 45
Forecast
187,984 10.36 1,947 -6
Average
Carryover
The end 2019 figure has a significant influence on the 2020 LR positon and expenditure requirement.
The 2019 estimated end year LR is 186,763. In previous years, the lower LR number in the previous
year resulted in a significant amount of savings from this carryover effect alone. However, this year
the carryover impact is estimated to result in an additional expenditure requirement of €19m above
the 2019 REV allocation, despite a lower LR number. This is primarily as a result of increased average
costs and declines in the rate of reduction on the LR. Because the carryover impact is positive, this
means that for any actual LR savings to occur in 2020 it would require to be greater than €19m to be
realised at aggregate level.
295. Potential Brexit Impact
Overview of LR Trends in Previous Unemployment Crises
The most recent unemployment crisis began at the end of 2007. This resulted in a 308,562 or 191%
increase in numbers on the Live Register over a three and half year period before the LR numbers
began to decline. The scale and speed of this increase was the largest in state history, however the
duration of the unemployment crisis in the 1980’s recession was longer, lasting over six and a half
years, almost twice the duration of the 2008 crisis.
Table 15 below demonstrates the differences in scale and duration of the different unemployment
crises since the 1980’s. It should be noted that these different points in time are not necessarily
directly comparable21 however it can provide context and insights into the developments of the LR
under various unemployment crises.
Table 15: Historical Overview of Unemployment Crises
Cumulative Change in
Peak before Increase Duration of
Start of LR Increase Increase in Average LR in
Decline in LR Increase
Date LR First Year of
Date % Time
Number Crisis
6 years 6 26,392
1980 M04 1987 M01 162,493 177%
months
1 year 1 29,238
1990 M11 1993 M01 79,235 35%
month
2 years 2 20,212
2001 M06 2003 M08 52,862 39%
months
3 years 6 64,426
2007 M11 2011 M07 308,562 191%
months
Source: CSO Live Register
The annual change to the average LR during the first year of each unemployment crisis is also shown
in Table 15. These have ranged from an average LR increase of 26,392 between 1980 and 1981 to an
average LR increase of 64,426 between 2007 and 2008. Further detail on the average LR changes since
the 1980’s can be seen in Appendix 8.
21The different points in time are not directly comparable as the changes in the LR are also a function of the overall working
age population and reforms to the eligibility of social welfare schemes.
30These changes as a proportion of the Labour Force are shown below in Figure 15 from 1988 to 2019.
It shows that the LR increase of 29,238 in 1991 was the equivalent of 2.2% of the Labour Force at that
time. Comparatively, the 64,426 increase in 2008 was equivalent to 2.8% of the Labour Force at that
time, demonstrating that while the increase in the LR numbers were almost three times larger in 2008,
the proportions of the increase were comparatively similar during the first year of these
unemployment crises.
Figure 15: Changes in the Average LR as Proportion of Labour Force, 1988 - 2018
7.8% 7.5%
Annual Changes to Average LR as % of LF
5.8%
3.8%
2.8%
2.2% 2.1%
1.8%
1.0%
0.5%
-0.2%
-2.2%
1990
2004
2018
1988
1989
1991
1992
1993
1994
1995
1996
1997
1998
1999
2000
2001
2002
2003
2005
2006
2007
2008
2009
2010
2011
2012
2013
2014
2015
2016
2017
Source: CSO Live Register and LFS (1988 -1997 series; 1998 – 2019 series)
Potential Brexit Impact on the Live Register in 2020
The Department of Finance (DoF) have forecast projections for a No Deal Brexit impact on
unemployment from 2019 to 2024, outlined in Table 16. These 2020 forecasts estimate an
unemployment rate of 5.7%, representing a 0.5 percentage point increase on the 2019 unemployment
rate of 5.2%. The number of persons classified as unemployed under the ILO definition of
unemployment22 which is used in the Labour Force Survey (LFS) is expected to rise from 125,000 in
2019 to 140,000 in 2020, an increase of 15,000.
22The ILO defines the economic status of unemployment as all those of working age who were not in employment, carried
out activities to seek employment in a recent period (comprising the previous 4 weeks or month) and were currently available
to take up employment (in the reference period or within a short subsequent period not exceeding two weeks in total).
31Table 16: Department of Finance Labour Market Forecasts, 2018-2024
2018 2019 2020 2021 2022 2023 2024
No. Unemployed 137,000 125,000 140,000 147,000 149,000 147,000 142,000
Change No.
- 12,000 +15,000 + 7,000 + 2,000 - 2,000 - 5,000
Unemployed
Unemployment rate % 5.8 5.2 5.7 5.9 5.9 5.7 5.5
Change UE Rate + 0.5 + 0.2 + 0.2 + 0.2 + 0.2
The DoF forecasts are used to estimate the expected increase in the average LR figure and related
expenditure in a No Deal Brexit scenario in 2020.
Method 1: Conversion Rate
The conversion rate method is used to translate increases in the unemployment rate to numbers on
the LR. The current conversion rate estimates that every 1% in the unemployment rate corresponds
to 38,238 persons on the LR.
Using the conversion rate method and the DoF forecast for 2020 of a 0.5 percentage point increase in
the unemployment rate, the corresponding increase in the LR is estimated to be 19,119. This method
estimates an average LR of 207,103 in 2020 and would require additional expenditure of €164m over
the baseline (no change) position. See Method 1 in Table 17 for the impact of a 0.5 percentage point
increase in the unemployment rate in 2020 using the conversion method.
A sensitivity analysis is also set out in Table 17 which shows the impact of further increases in the
unemployment rate above the DoF forecasts in 2020 using the conversion rate method, see A to D.
Table 17: Conversion Rate Method and Sensitivity Analysis of Brexit Impact on LR in 2020.
Increase Average LR Average Additional
Additional LR Expenditure
Method in UE rate in 2020 Cost Expenditure
Number €m
% Number €m €m
1 0.5% 19,119 207,103 10.19 2,111 + 164
Increase Average LR Average Additional
Additional LR Expenditure
Sensitivity in UE rate in 2020 Cost Expenditure
Number €m
% Number €m €m
A 0.7% 27,149 215,133 10.12 2,178 + 231
B 1% 38,238 226,222 10.02 2,268 + 321
C 2% 74,947 262,931 9.72 2,557 + 610
D 3% 114,715 302,699 9.43 2,855 + 908
Source: Department of Finance Labour Market Projections and Author’s own calculations
32The sensitivity analysis shows that:
A. 0.7% increase in the unemployment rate would result in an additional 27,149 persons on the
LR and an additional funding requirement of €231m in 2020.
B. 1% increase in the unemployment rate would result in an additional 38,238 persons on the
LR and an additional funding requirement of €321m in 2020.
C. 2% increase in the unemployment rate would result in an increase of 74,947 on the LR and
additional funding of €610m in 2020.
D. 3% increase in the unemployment rate would result in an additional 114,715 people on the
LR and require additional funding of €908m in 2020.
The expenditure impact initially will be primarily on Jobseekers Benefit and the Jobseeker’s Benefit
for the Self-Employed, which is funded from the Social Insurance Fund (SIF).
Method 2: Difference between LR and LFS Unemployment
The LR and number unemployed (ILO and LFS definition) are two different metrics and there is
difference between them given that they are responsible for measuring different things. A contributor
to this difference is that the LR includes people who are working part-time, or on a temporary basis.
While the conversion rate method is used to link the developments in the unemployment rate to the
LR, it does not allow for changes in the relationship between the two measures23.
Historically, the difference between the LR figure and the ILO and LFS definition of number
unemployed increases in periods of rising unemployment. This can be seen by comparing the average
difference between the LR and UE number from 1988 to 2019. The average annual difference between
the LR and LFS UE numbers fell to a low of 62,795 in 2001, however, during the dotcom crisis this
difference increased significantly to 76,614 by 2003 an average annual increase of 10%.
In 2007, the difference between the two metrics was again at a low of 45,885, however this rose
sharply reaching 114,056 in 2010, a 38% annual average increase. As the labour market improved in
recent years, the difference between the metrics has gradually reduced with an average difference of
23 The conversion rate method will not capture the potential increases in temporary and part-time underemployment which
is likely to occur in periods of rising unemployment. Increased numbers of JA and JB casuals and the systematic short-time
work scheme.
3378,644 in 2019. The difference between the two metrics from 1988 and 2019 is outlined in Figure 16
below.
Figure 16: Average Annual Difference between Live Register and LFS Unemployment, 198824 – 2019
140,000 70%
60%
Percentage Change in theAnnual Difference %
120,000 116,002
114,056
50%
100,367
100,000 40%
30%
Annual Difference
80,000 62,795
78,644 20%
60,000
10%
40,000 0%
-10%
20,000 avg. 38%
avg. 10% -20%
- -30%
1988 1990 1992 1994 1996 1998 2000 2002 2004 2006 2008 2010 2012 2014 2016 2018
Annual Difference % Change
Source: CSO Live Register and LFS (1988-1997 series and 1998-2019 series)
In order to account for the structural change between the LR and LFS in times of rising
unemployment25, the difference between the LR figure and LFS UE number is used to estimate the LR
number in a No Deal Brexit under Scenario 2 and Scenario 3. These are based on assumptions from
historical observations26.
Baseline Position
The baseline difference is 67,902. This is the difference between the 2019 LR Average of 192,902 and
the 2019 unemployed number of 125,000. See Table 18 below.
24 It
should be noted that there is a structural break in the data presented. The unemployment data from 1988 - 1997 is from
an older version of the Labour Force Survey (LFS) and the data from 1998 and 2019 is from the current LFS.
25A contributor to the difference is the rise in part-time and temporary unemployment, however this does not account for
the full differential.
26The increases to the baseline differences are based upon historical observations and the average percentage increase in
the LR/UE difference that occurred in the 1991 and 2008 unemployment crises.
34Table 18: Brexit 2020 Estimate for Number Unemployed (LFS)
Number
2019 Estimated Average LR Figure 192,902
2019 DoF LFS UE Forecast 125,000
Difference 67,902
DoF forecast the number unemployed in a No Deal Brexit scenario in 2020 to be 140,000, this is an
increase of 15,000 persons from 2019 levels.
Method 2 – Assumption based on 10% increase in difference between LR and UE number
The baseline difference of 67,902 is estimated to increase by 10%. The 10% increase is based on
the historical annual average increase experienced in the unemployment crisis from 2001 to 2003.
This results in an average LR for 2020 of 214,692.
Method 3 - Assumption based on 38% increase in difference between LR and UE number
The baseline difference of 67,902 is estimated to increase by 38%. The 38% increase is based on
the historical annual average increase experienced in the unemployment crisis from 2007 to 2010.
This results in an average LR of 233,705 in 2020.
Table 19 below outlines the three methods for the 2020 LR estimates.
Method 1 using the conversion rate method discussed above, estimates an LR increase of
19,119 and an additional funding requirement of €164m in 2020.
Method 2 estimates an additional LR of 26,708 in 2020 and an additional funding requirement
of €227m.
Method 3 estimates an additional LR of 45,721 and an additional funding requirement of
€347m.
These indicate the range of LR estimates for 2020 in a No Deal Brexit scenario using DoF forecasts.
35Table 19: 2020 LR Estimate and Expenditure
Method Description LR Average LR Average Total Additional
Additional 2020 Cost Expenditure Expenditure
Number Number €m €m over
Baseline
€m
Conversion
Rate
19,119 207,103 10.19 2,111 + 164
1 Method
Difference
Method
(10% 26,708 214,692 10.125 2,174 + 227
2 increase)
Difference
Method
(38% 45,721 233,705 9.82 2,294 + 347
3 increase)
In addition, other areas of DEASP expenditure are expected to increase as part of the automatic
stabiliser effect from increased numbers on the LR and weaker labour market performance. It is
expected there will be increased demand for employment supports and activation schemes and in-
work supports such as the Working Family Payment and Part Time Job Incentive scheme. Other
payments are also expected to have increased demand, these include Fuel Allowance, Redundancy
and Insolvency payments, the Back to School Clothing and Footwear payment, Exceptional and Urgent
Needs payment and Basic Supplementary Allowance.
6. Conclusions
The Live Register has fallen to its lowest level since January 2008 at 183,783 as of end September
2019. However, despite this lower LR number various data and trends reviewed in the paper are
indicating that the LR is reaching its lower bound and there are signs of tightening, with less people
entering the LR, and those already on the LR not moving off as readily compared to previous years. As
a result, further reductions in the LR will be minimal in 2020. This means that the significant decline
in jobseeker expenditure seen in previous years will not continue in 2020.
A number of different methodologies were used to forecast the potential trajectories of the LR for the
remainder of 2019 and 2020. These provide a range of average LR estimates for 2020, the lowest being
the ARIMA method estimating an average LR number of 183,689 and yielding LR savings of €45m. The
highest is the Trend Upward Drift method estimating an LR number of 191,406, and an expenditure
requirement of €1,977m for 2020, an additional €24m on 2019 REV allocation.
36The carryover method estimates a lower LR number for 2020 compared to 2019, however it will
require an additional €19m over the 2019 REV allocation. This is a result of increases costs and full
year impact of 2019 rate increases.
The higher average costs expected in 2020 mean that even relatively small differences in LR numbers
result in large differences in expenditure requirements across each method. The forecast average is
intended to capture the range of potential trajectories for the LR into 2020. This is estimating an
average LR of 187,984 with an expenditure requirement of €1,947m, a savings of €6m on 2019 REV.
The impact of a potential Brexit shock on the LR is estimated to result in increases in the LR number.
Based upon DoF forecasts of LFS unemployment in 2020, the LR for 2020 is estimated to increase by
between 19,119 and 45,721, which will result in additional expenditure above the baseline of between
€164m and €347m.
In addition, other areas of DEASP expenditure are expected to increase as part of the automatic
stabiliser effect from increased numbers on the LR and weaker labour market performance. These are
expected to include increased demand for employment and activation schemes, in-work supports like
the Working Family Payment and other supplementary income supports.
37You can also read