Single-Layer Pressure Textile Sensors with Woven Conductive Yarn Circuit - MDPI
←
→
Page content transcription
If your browser does not render page correctly, please read the page content below
applied
           sciences
Article
Single-Layer Pressure Textile Sensors with Woven
Conductive Yarn Circuit
Gaeul Kim, Chi Cuong Vu              and Jooyong Kim *
 Department of Organic Materials and Fiber Engineering, Soongsil University, Seoul 156-743, Korea;
 rkdmf3738@naver.com (G.K.); cuongvc287@gmail.com (C.C.V.)
 * Correspondence: jykim@ssu.ac.kr; Tel.: +82-010-8720-0631

 Received: 9 March 2020; Accepted: 13 April 2020; Published: 21 April 2020

 Featured Application: The single-layer pressure sensor presented in this study serves as a
 stepping stone towards the development of cost-effective and scalable sensors for the industrial
 manufacturing process. The results show that the one-layer sensor has a high working
 performance and is thinner than multi-layer sensors. Thus, it is easy to apply it to robot control
 or human motion recognition fields.

 Abstract: Today, e-textiles have become a fundamental trend in wearable devices. Fabric pressure
 sensors, as a part of e-textiles, have also received much interest from many researchers all over the
 world. However, most of the pressure sensors are made of electronic fibers and composed of many
 layers, including an intermediate layer for sensing the pressure. This paper proposes the model of a
 single layer pressure sensor with electrodes and conductive fibers intertwined. The plan dimensions
 of the fabricated sensors are 14 x 14 mm, and the thickness is 0.4 mm. The whole area of the sensor is
 the pressure-sensitive point. As expected, results demonstrate an electrical resistance change from
 283 Ω at the unload pressure to 158 Ω at the load pressure. Besides, sensors have a fast response
 time (50 ms) and small hysteresis (5.5%). The hysteresis will increase according to the pressure and
 loading distance, but the change of sensor loading distance is very small. Moreover, the single-layer
 pressure sensors also show high durability under many working cycles (20,000 cycles) or washing
 times (50 times). The single-layer pressure sensor is very thin and more flexible than the multi-layer
 pressure sensor. The structure of this sensor is also expected to bring great benefits to wearable
 technology in the future.

 Keywords: single-layer-textile pressure sensor; carbon nanotubes (CNTs); hysteresis; conductive
 wool yarns

1. Introduction
     E-textile fibers have now been recognized as one of the important materials in the wearable
technology field. More and more new e-textile fibers have been actively developed and applied in
wearable devices [1–6]. Especially, as the convergence of fibers and IT technology has accelerated,
many studies on electronic textile [7–10] and smart fibers [11–13] have been proposed, and a variety of
products have been released [14]. However, e-textile fibers and wearable technologies still have many
problems yet to be solved [15,16], especially in the pressure textile sensors field [17–20]. The pressure
sensors based on smart fibers are necessary for all aspects of life, such as recognition of human activities,
biosignal monitoring and healthcare. Those goals require the sensors to be lightweight, flexible, easy
to use, and comfortable for the wearer. So, the development of compact pressure sensors [21–24]
that can be a part of clothing has become a big challenge today. Most of the pressure sensors have a
multi-layer structure with a low conductive layer as a spacer inserted between two high conductive

Appl. Sci. 2020, 10, 2877; doi:10.3390/app10082877                               www.mdpi.com/journal/applsci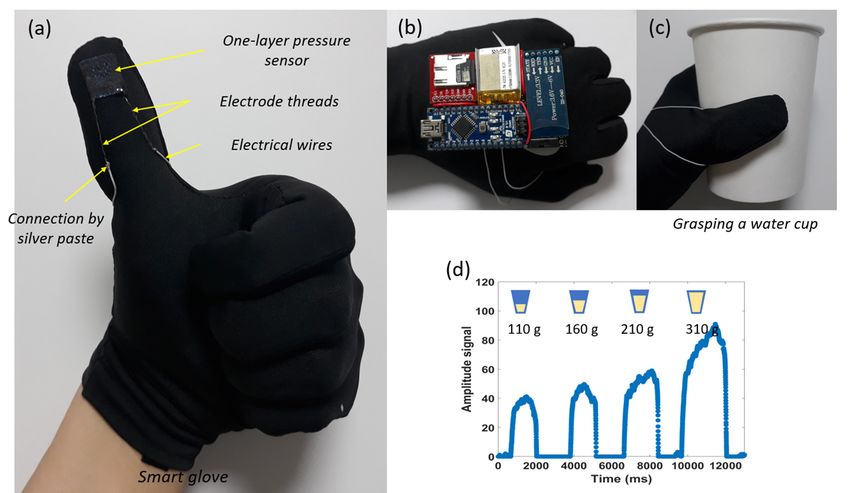
Appl. Sci. 2020, 10, 2877 2 of 10
layers in order to measure the levels of pressure [25–27]. For example, Atalay et al. [28] proposed
the sensitive capacitive pressure sensor based on conductive fabrics and a microporous-dielectric
layer. Pizarro et al. [29] presented an easy method to create a textile pressure sensor. Jeong et al. [30]
studied a multilayer fabric pressure sensor for the real-time piezo-impedance imaging of pressure
distribution. Chang et al. [31] developed a high-sensitivity and low-hysteresis- flexible pressure sensor
based on carbonized cotton fabric. However, the multilayer structure will increase the thickness of the
sensor and cause discomfort to the wearer. Therefore, this paper proposes a new structure composed
of a one-layer sensor. Nonconductive fibers are converted to conductive fibers through the carbon
nanotubes (CNTs) impregnation process. Then, the sensing layer is made by the intertwining of
nonconductive fibers, conductive fibers, and electrodes. The results of experiments demonstrate that
the one-layer-textile-pressure sensor is really thin (0.4 mm), lightweight, and more fit for wearable
devices than the conventional multilayer structure. The characteristics of resistance and hysteresis
of the fabricated sensor are analyzed in the paper. We also show an application of this sensor on the
glove for monitoring finger motion.
2. Sensor Design
The conductive yarns are fabricated by impregnation to impart conductivity to the nonconductive
wool yarns (about 10 yarns/sample). The impregnation ink is carbon nanotubes (CNTs) dispersed
methyl ethyl ketone (MEK), which is easily agglomerated by the van der Waals force of the surface.
Therefore, in order to ensure uniform dispersion, the CNT ink was stirred for at least 1 h at 700 rpm
by a mechanical stirrer and treated ultrasonically for avoiding incorporation of air bubbles by an
ultrasonic machine (Figure 1a,b). As shown in Figure 1c,d, the wool yarns are impregnated in CNT
inks and dried for 48 h in order to fix CNT particles adhering to the wool yarns. Using a precision
LCR meter (Keysight E4980AL), we observed that the produced wool yarns have a resistance of about
× 102
7Appl. Ω/cm.
Sci. 2020, 10, x FOR PEER REVIEW 3 of 10
1. Fabrication
Figure 1. Fabricationprocess
processofof
conductive yarns
conductive consisting
yarns of (a)
consisting ofstirring CNTs,CNTs,
(a) stirring (b) sonification CNTs,
(b) sonification
(c) CNT-impregnation
CNTs, yarns, (d)
(c) CNT-impregnation drying
yarns, (d)CNT-yarns, (e) weaving
drying CNT-yarns, (e)sensor
weavinglayer, and (f)
sensor the sensor
layer, and (f)with
the
two laminating
sensor with twolayers.
laminating layers.
As shown
3. Results in Figure 1e, single-layer pressure sensors are fabricated by combining electrode threads
and Discussion
and spacing threads through intertwining with conductive wool yarns via a hand process on a weaving
tool (from Woven
3.1. Conductive WoolonYarns
looms Ltd., Seoul, Korea) [32]. The electrode threads are made of 70 deniers (D)
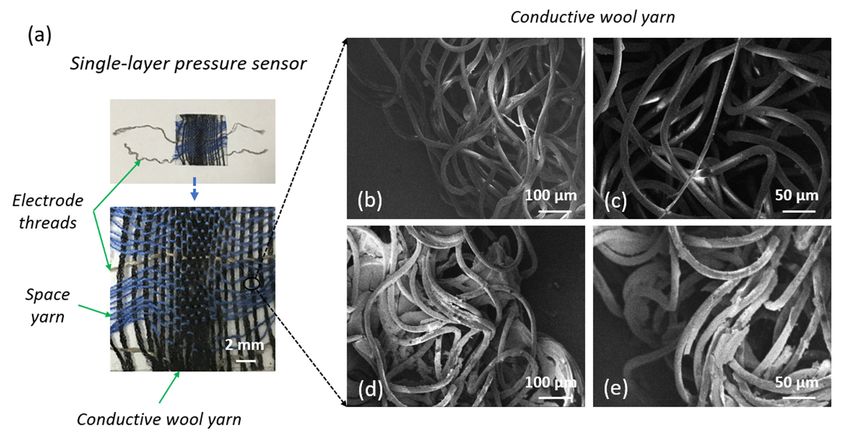
A scanning electron microscope (SEM) is employed to characterize morphological changes of
the wool yarns at different steps of the synthesis of the conductive fibers through the process
proposed. Figure 2a,b describes the fabricated sensors. Furthermore, Figure 2c−f shows SEM images
of the standard wool yarns with the magnified view showing no coating on the yarns and the coated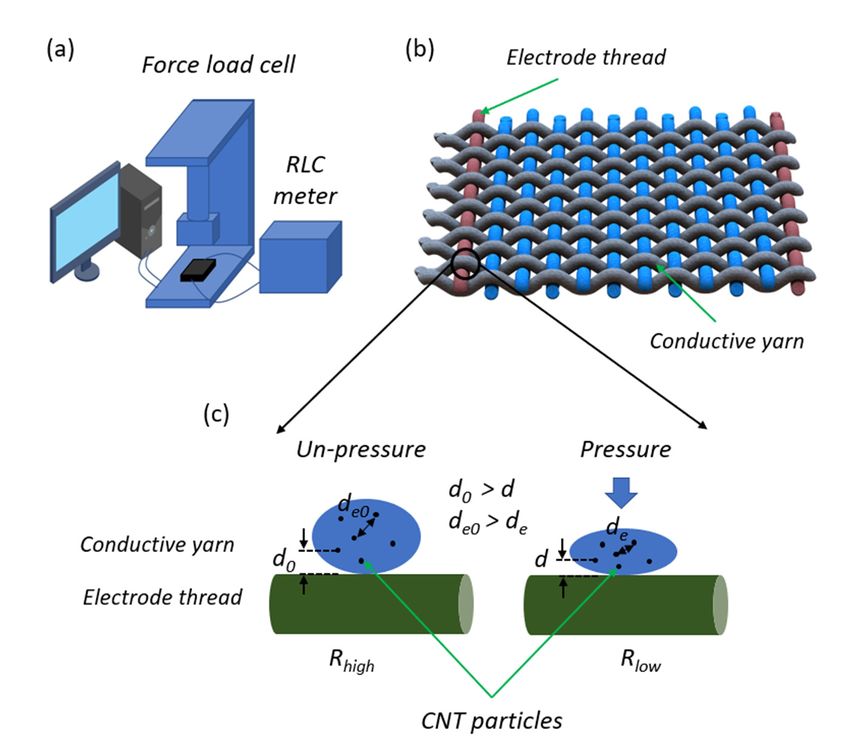
Appl. Sci. 2020, 10, 2877                                                                                   3 of 10

galvanized nylon plated yarn in a twist direction (S-twist) with a 140D metal plated gold yarn twined
at a twisting rate of 10,000 rpm during manufacturing. In the process of electrode threads, the metal
plating chamber is set at a very high electrical resistance (8.104 Ω/m). Non-conductive PET 250D is
used as the spacing yarns (about 10 yarns/sample). The sensor area is laminated by thermal pressing
with a flexible thin film on both sides (Figure 1f) at a temperature of 135 ◦ C and a duration of 20 s.
These film layers cover the sensor surface and prevent CNT fall-off. The material used for laminating
the sensor is a 100 µm thin elastic film with 100% polyurethane (PU) from Sealon Ltd., Seoul, Korea.
Because of the PU films, the sensor will no longer have a drape or feel of textiles normally, and it will
have no breathability. However, the area size (10 mm) and the thickness (0.4 mm) of sensors are small;
this can be accepted for the application in this paper. We suggest using other materials or structures for
      Figure
the cover    1. Fabrication
           layers (as highlyprocess of conductive
                             stretchable          yarns
                                         PU/Silicone     consisting
                                                      film,         of (a)on
                                                            some holes     stirring CNTs,
                                                                              film) to    (b) sonification
                                                                                       improve the drape and
      CNTs, (c) CNT-impregnation yarns, (d) drying CNT-yarns, (e) weaving sensor layer, and (f) the
breathability, but more experiments are needed for this. Finally, the one-layer-fabric pressure sensor of
      sensor with two laminating layers.
a small thickness of 0.4 mm and a size of 10 × 10 mm is prepared.
3. Results
3. Results and
           and Discussion
               Discussion

3.1. Conductive Wool Yarns
                     Yarns
        scanning electron
      A scanning    electronmicroscope
                               microscope(SEM)
                                            (SEM)is is  employed
                                                     employed   to to characterize
                                                                   characterize      morphological
                                                                                  morphological        changes
                                                                                                   changes       of
                                                                                                             of the
the wool
wool  yarnsyarns   at different
             at different          steps
                            steps of     of the synthesis
                                     the synthesis           of the conductive
                                                     of the conductive             fibers the
                                                                         fibers through    through
                                                                                               processthe  process
                                                                                                        proposed.
proposed.
Figure  2a,bFigure   2a,b the
              describes   describes   the fabricated
                               fabricated             sensors. Furthermore,
                                           sensors. Furthermore,               Figure
                                                                      Figure 2c−f       2c−f SEM
                                                                                    shows    showsimages
                                                                                                     SEM images
                                                                                                             of the
of the standard
standard          wool with
           wool yarns    yarnsthe
                                with  the magnified
                                   magnified           view showing
                                                view showing           no coating
                                                               no coating   on theon   the and
                                                                                    yarns  yarnstheand  the coated
                                                                                                     coated  yarns
yarns under
under          highlow
        high and     andmagnification
                           low magnification     with CNTs.
                                          with CNTs.          The diameter
                                                         The diameter          of a single
                                                                         of a single  yarn yarn   is about
                                                                                            is about   10 µm10 and
                                                                                                                µm
and appears
appears        loosely
          loosely twistedtwisted   with ample
                             with ample          free between
                                          free space   space between    the microfibers.
                                                               the microfibers.            Conductive
                                                                                   Conductive    particlesparticles
                                                                                                           (CNTs)
(CNTs)
can      can be observed
     be observed   in the formin the
                                  of form  of the
                                     the thin      thin coatings
                                               coatings  and stuckand  stuck randomly
                                                                     randomly    onto woolonto  woolwith
                                                                                              yarns    yarns
                                                                                                           an with
                                                                                                               80%
an  80%  coating
coating area.     area.

      Figure 2. (a) Single-layer pressure textile sensor, (b) nonconductive wool yarn at 100 µm,
      (c) nonconductive wool yarn at 50 µm, (d) conductive wool yarn at 100 µm, and (e) conductive
      wool yarn at 50 µm.

3.2. Electrical Properties
     To analyze the characteristics of sensors, we use a universal testing machine (UTM) from Dacell
Co. Ltd., Seoul, Korea, and a source meter (Keysight B2902A). As shown in Figure 3a, sensor samples
are placed above the sole and between the grips of the UTM machine. For the measurements of the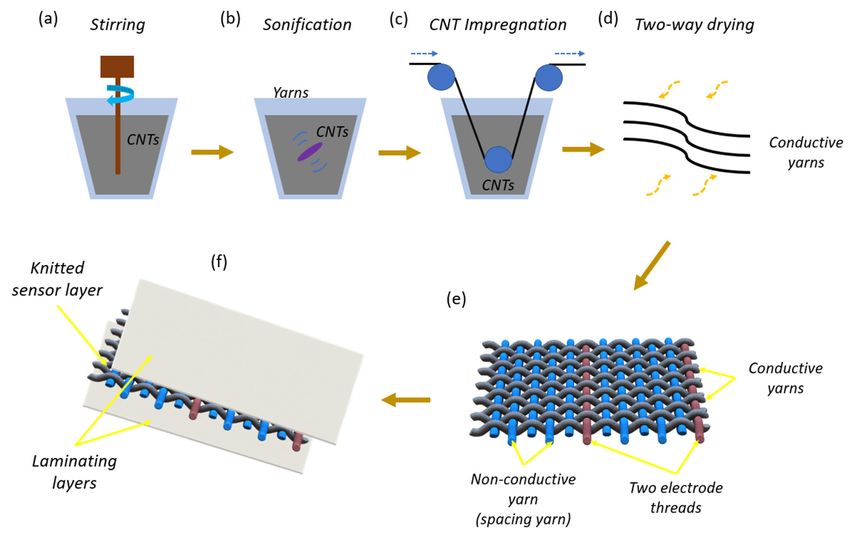
yarn at 50 µm.
3.2. Electrical Properties
To analyze the characteristics of sensors, we use a universal testing machine (UTM) from Dacell
Appl. Sci. 2020, 10, 2877 4 of 10
Co. Ltd, Seoul, Korea, and a source meter (Keysight B2902A). As shown in Figure 3a, sensor samples
are placed above the sole and between the grips of the UTM machine. For the measurements of the
electrical
electrical resistance,
resistance, electrical
electrical wires
wires connected
connected directly
directly toto the
the two
two electrode
electrode threads
threads ofof the
the samples
samples by by
the
the grips. A constant sourcesourcevoltage
voltageapplied
appliedtotothe
thesamples
samples during
during thethe test.
test. Resistance
Resistance andand pressure
pressure are
are continuously
continuously measured
measured whenwhenloadingloading theAt
the force. force.
least Atfiveleast fiveare
samples samples
tested, are
and tested, and the
the experiments
experiments
are repeated are repeated
50 times 50 times
in order in order
to record to record
average average
values, values, respectively.
respectively.
The
The working
working principle (Figure(Figure3b,c)
3b,c)ofofone-layer
one-layerpressure
pressuresensors
sensorsisisbased
basedononsensing
sensing the
the change
change of
of electrical
electrical resistance
resistance when when the distance
the distance between between
conductiveconductive
particlesparticles (CNTs)inchanges
(CNTs) changes in the
the conductive
conductive
fibers, as wellfibers, as well
as between theasCNTs
between the CNTs
and electrode and electrode
threads. Equation threads.
(1) showsEquation (1) conduction
the electrical shows the
electrical
mechanism conduction
under themechanism under the
loading of pressure where R, ρ, of
loading pressure
l, and where
A present theR, ρ, l, and resistivity,
resistance, A presentfiberthe
resistance,
length, andresistivity,
cross-section fiber length,
area, and cross-section
respectively. As describedarea,inrespectively.
Figure 3c, d0 As described
is the in Figure
initial distance 3c, d0
between
is the initial
CNTs, distance
d is the distancebetween
between CNTs,
CNTsd isafter
the distance between
pressuring, de0 isCNTs after distance
the initial pressuring, de0 is CNTs
between the initial
and
distance
electrodes,between
and deCNTs is the and electrodes,
distance between and de isand
CNTs the electrodes
distance between CNTs andWhen
after pressuring. electrodes after
pressure is
pressuring.
applied, theseWhen pressure
distances is applied,
become closer (d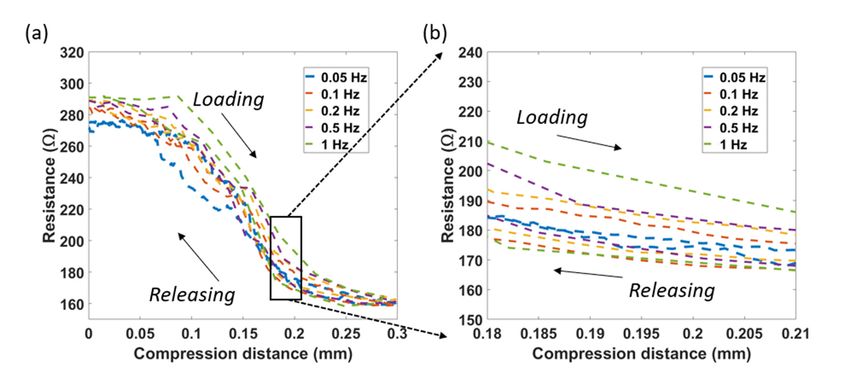
define the operation of the sensor under different static pressures at 250 kPa, 500 kPa, 750 kPa, and
1000 kPa within the system. The applied voltage from −1.8 V to 1.8 V demonstrated an ohmic behavior
define the operation of the sensor under different static pressures at 250 kPa, 500 kPa, 750 kPa, and
of the sensors. The slope of I-V curves reduces with a decrease of pressure, indicating that an increase
1000 kPa within the system. The applied voltage from −1.8 V to 1.8 V demonstrated an ohmic behavior
in applied pressure led to a decrease in the sensor’s resistance.
of the sensors. The slope of I-V curves reduces with a decrease of pressure, indicating that an increase
in applied
Appl. Sci. 2020, pressure
10, 2877 led to a decrease in the sensor’s resistance. 5 of 10
Figure 4. (a) Relationship of resistance and pressure, (b) I-V curves.
Figure 5a describesFigure 4.4.(a)
the
Figure (a)Relationship
resistance ofofresistance
of sensors
Relationship afterand
resistance andpressure,
100 pressure,(b)
loading (b)I-V
I-Vcurves.
cycles. The sensitivity decreases
curves.
initially but stabilizes after some cyclic loading/unloading periods. The reason for this behavior is the
Figure5a5adescribes
Figure describes theresistance
resistanceofofsensors
sensorsafterafter100
100loading
loading cycles.The Thesensitivity
sensitivitydecreases
decreases
deformation (permanent)the in the structure under pressure leads to acycles.
change in the electrical response
initiallybut
initially butstabilizes
stabilizesafter
aftersome
somecyclic
cyclicloading/unloading
loading/unloadingperiods. periods.The Thereason
reasonfor forthis
thisbehavior
behaviorisisthe
the
of the sensors. However, after 85 cycles, that deformation of the fibers remains stable, and the
deformation(permanent)
deformation (permanent) inin
thethe structure
structure under
under pressure
pressure leads
leads to atochange
a change in the electrical response
electrical output of the sensor becomes stable (Figure 5b). Response time in is the electrical
an important response
parameter of
of sensors.
the the sensors. However,
However, after after
85 85 cycles,
cycles, that that deformation
deformation of the of the
fibers fibers stable,
remains remains and stable,
the and the
electrical
that defines the time lag between an electronic input and the output signal. The response delay in the
electricalthe
output output of the sensor becomes stable Response
(Figure 5b). Response time is an important parameter
sensor of sensor
is caused bybecomes stable
the viscoelastic (Figure
nature5b). of wool yarns timeand is an
theimportant
connectivity parameter
between that defines
the CNT
that
the defines
time lag the time an
between lagelectronic
between an electronic
input and theinput andsignal.
output the outputThe signal.
response The response
delay in thedelay in the
sensor is
coatings under pressure. As shown in Figure 5b, the fast response time is about 50 ms. The fast
sensorby
caused is the
caused by the nature
viscoelastic viscoelastic
of woolnature
yarns of
andwool
the yarns and the
connectivity connectivity
between the CNT between
coatings the CNT
under
connection time of conductive particles ensures the rapid electrical property of these sensors in a
coatings As
pressure. under
shownpressure.
in FigureAs 5b,shown in Figure
the fast response 5b,time
the is
fast response
about 50 ms.timeTheisfastabout 50 ms. time
connection The fast
of
practical application.
connectionparticles
conductive time of ensures
conductive particles
the rapid ensures
electrical the rapid
property electrical
of these sensors property of these
in a practical sensors in a
application.
practical application.
Figure 5. (a) Resistance change in 100 loading/unloading cycles and (b) Response time.
Figure 5. (a) Resistance change in 100 loading/unloading cycles and (b) Response time.
As described in Figure 6a, we also evaluated the hysteresis of the proposed sensor at different
As described
frequencies of 0.05 in
Figure Hz, Figure
5. (a)0.1 Hz,6a,0.2
Resistance we also
Hz, 0.5evaluated
change Hz,
in 100and 1the
Hz.hysteresis
With each
loading/unloading offrequency,
cyclesthe
andproposed sensor
the upper
(b) Response at different
line
time. presents
frequencies
the loading of 0.05 Hz,
phase, and0.1theHz, 0.2 Hz,
lower line0.5 Hz, andthe
presents 1 Hz. With each
releasing frequency,
phase. Relative the upper line presents
change-in-resistance
As described in Figure 6a, we also evaluated the hysteresis of the proposed sensor at different
the loading
values phase,
are logged and the
during the lower
loadingline presents pressure)
(increasing the releasing phase. Relative
and unloading change-in-resistance
(decreasing pressure), and
frequencies of 0.05 Hz, 0.1 Hz, 0.2 Hz, 0.5 Hz, and 1 Hz. With each frequency, the upper line presents
values
the are logged
maximum during error
hysteresis the loading
of the (increasing pressure)
sensor is found to beand unloading
5.5%. It is clear(decreasing pressure),
that the higher and
pressure
the loading phase, and the lower line presents the releasing phase. Relative change-in-resistance
the maximum hysteresis error of the sensor is found to be 5.5%. It is clear that the
and faster removal speed will increase the hysteresis of the sensor. The results show that at a higher higher pressure
values are logged during the loading (increasing pressure) and unloading (decreasing pressure), and
and faster
pressure removal
and speed will
faster removal, increase
the the hysteresis
speed will increase theofhysteresis
the sensor.ofThe
the results
sensor show
(Figurethat
6b).at a higher
the maximum hysteresis error of the sensor is found to be 5.5%. It is clear that the higher pressure
pressure and faster removal, the speed will increase the hysteresis of the sensor (Figure 6b).
and faster removal speed will increase the hysteresis of the sensor. The results show that at a higher
pressure and faster removal, the speed will increase the hysteresis of the sensor (Figure 6b).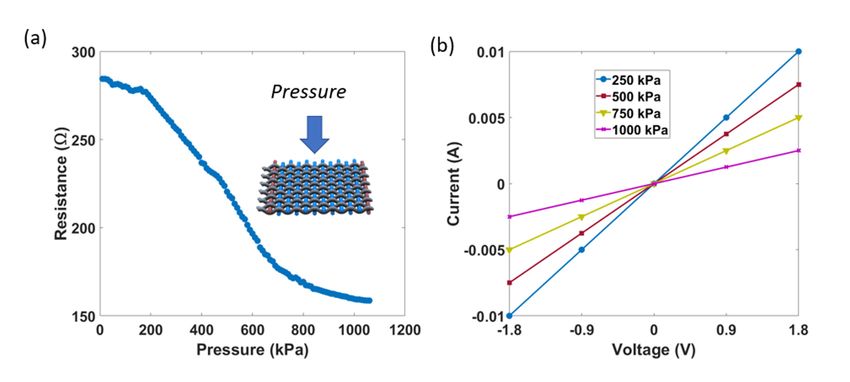
Appl. Sci. 2020, 10, x FOR PEER REVIEW                                                                              6 of 10

Appl. Sci. 2020, 10, 2877                                                                                          6 of 10
 Appl. Sci. 2020, 10, x FOR PEER REVIEW                                                                              6 of 10

      Figure 6. (a) Hysteresis at different frequencies in the compression from 0 – 0.1 mm, and (b) hysteresis
      at different frequencies in the compression from 0.06 - 0.07 mm.
     Figure 6. (a) Hysteresis at different frequencies in the compression from 0–0.1 mm, and (b) hysteresis
        Figure
     atIn       6. (a)
         different     Hysteresis atthe
                    frequencies      different frequencies in the compression from 0 – 0.1 mm, and (b) hysteresis
           order to    evaluate in      compression
                                 the dynamic         from 0.06–0.07
                                                  durability  of the mm.
                                                                     sensors, we determined the stable electrical
        at different frequencies in the compression from 0.06 - 0.07 mm.
 functionality and mechanical integrity during loading/releasing cycles. The experiment was
      In order to evaluate the dynamic durability of the sensors, we determined the stable electrical
 performed in a lab-customized machine (UTM), and resistance was measured at every 100 cycles. We
        In order
functionality     to mechanical
                and   evaluate the dynamic
                                 integrity     durability
                                           during          of the sensors,
                                                    loading/releasing         we The
                                                                          cycles. determined
                                                                                       experimentthewas
                                                                                                      stable electrical
                                                                                                          performed
 observed that uniform resistance changes of less than 7% were recorded after 20,000
  functionality    and   mechanical    integrity  during     loading/releasing      cycles.  The
in a lab-customized machine (UTM), and resistance was measured at every 100 cycles. We observed      experiment   was
 loading/unloading cycles (Figure 7a). In the washing test, the samples were checked in a mini
  performed
that  uniformin   a lab-customized
                resistance           machine
                            changes of          (UTM),
                                        less than        and recorded
                                                   7% were    resistanceafter
                                                                            was 20,000
                                                                                measured     at every 100 cycles.
                                                                                         loading/unloading         We
                                                                                                               cycles
 washing machine (LG-W0082) from Daewoong Co., Seoul, Korea. Each washing time had a duration
  observed
(Figure        that
          7a). In the uniform    resistance
                       washing test,           changes
                                      the samples    wereof    less than
                                                           checked            7% washing
                                                                       in a mini   were recorded         after 20,000
                                                                                             machine (LG-W0082)
 of 10 min, a squeezing time of 2 min, and a drying time of 7 min at 100 °C. The sensors demonstrated
  loading/unloading
from   Daewoong Co.,cyclesSeoul,(Figure   7a). In
                                 Korea. Each       the washing
                                                 washing   time had test,  the samples
                                                                        a duration   of 10were
                                                                                            min, checked    in atime
                                                                                                   a squeezing    mini
 a small resistance change (less than 10%) after  ◦     50 washing times (Figure 7b). This is significant for
ofwashing   machine
   2 min, and          (LG-W0082)
                 a drying  time of 7 from
                                     min atDaewoong
                                              100 C. The Co., Seoul, demonstrated
                                                            sensors    Korea. Each washing
                                                                                        a smalltime    had a duration
                                                                                                  resistance change
 wearable applications.
  of 10
(less    min,
      than    a squeezing
            10%)            time of 2times
                   after 50 washing    min, and  a drying
                                            (Figure         timeisofsignificant
                                                      7b). This       7 min at 100
                                                                                 for °C.  The sensors
                                                                                     wearable           demonstrated
                                                                                                 applications.
  a small resistance change (less than 10%) after 50 washing times (Figure 7b). This is significant for
  wearable applications.

     Figure 7. (a) Resistance after 20,000 loading/releasing cycles, and (b) resistance after 50 washing times.
      Figure 7. (a) Resistance after 20,000 loading/releasing cycles, and (b) resistance after 50 washing times
      Figure 8a shows the effect of temperature on the performance of the pressure sensor. The resistance
change   has a 8a
       Figure   small   rangethe
                    shows      (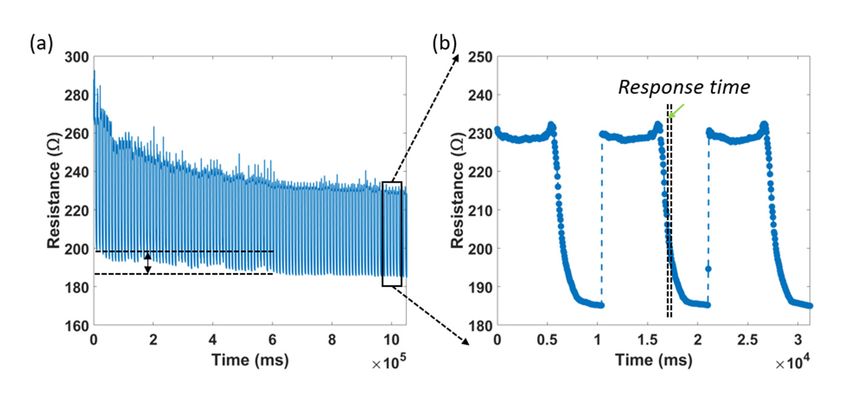
Appl.
Appl. Sci. 2020, 10,
      Sci. 2020, 10, 2877
                     x FOR PEER REVIEW                                                                      77of
                                                                                                              of10
                                                                                                                 10

     Figure 8.8. (a)
     Figure      (a) Resistance
                     Resistance change
                                change at
                                       at different
                                          different temperatures
                                                     temperatures and
                                                                  and (b)
                                                                       (b) Comparison
                                                                           Comparison of
                                                                                      of the
                                                                                          the thickness
                                                                                               thickness with
                                                                                                         with
     other studies.
     other studies.
4. Smart Glove
 4. Smart Glove
      To demonstrate the potential of the one-single layer pressure sensors, the proposed sensor is
      To demonstrate the potential of the one-single layer pressure sensors, the proposed sensor is
integrated into a smart tactile glove (Figure 9a) in order to distinguish objects with different weights
 integrated into a smart tactile glove (Figure 9a) in order to distinguish objects with different weights
during a grasping task. We used a hot melt double-sided adhesive tape to attach the sensor onto
 during a grasping task. We used a hot melt double-sided adhesive tape to attach the sensor onto the
the glove by heating it at 90 ◦ C for 15 s (with an iron). Two electrode threads of the sensor were
 glove by heating it at 90 °C for 15 s (with an iron). Two electrode threads of the sensor were connected
connected to two electrical wires of the Arduino Nano (5 V–16 Mhz) using a silver paste (from KLK
 to two electrical wires of the Arduino Nano (5 V–16 Mhz) using a silver paste (from KLK Ltd.,
Ltd., Jeonnam, Korea). As shown in Figure 9b, the hardware platform of experimental is an integrated
 Jeonnam, Korea). As shown in Figure 9b, the hardware platform of experimental is an integrated
circuit, composed of some main components such as Arduino, Bluetooth module, Micro SD Card, and
 circuit, composed of some main components such as Arduino, Bluetooth module, Micro SD Card,
a lipo-battery (3.7 V). Using a voltage divider circuit, the electrical resistance variation of the sensors
 and a lipo-battery (3.7 V). Using a voltage divider circuit, the electrical resistance variation of the
has been converted into a voltage variation. Data are sampled and digitized and thus converted into
 sensors has been converted into a voltage variation. Data are sampled and digitized and thus
digital values. For resolution reasons, mathematical mapping of voltage values between 0 to 5 V into
 converted into digital values. For resolution reasons, mathematical mapping of voltage values
digital values between 0 to 1023 (5/1023~0.005 V or 5 mV per unit) has been made by pre-calculating
 between 0 to 5 V into digital values between 0 to 1023 (5/1023~0.005 V or 5 mV per unit) has been
the actual data. It is calculated to take about 0.01 s (10 ms) to read an analog signal input, and a
 made by pre-calculating the actual data. It is calculated to take about 0.01 s (10 ms) to read an analog
maximum reading rate is about 100 times per second. Subjects are instructed to grasp a paper water
 signal input, and a maximum reading rate is about 100 times per second. Subjects are instructed to
cup (Figure 9c) for an amount of time, and the electrical signal is continuously recorded. The weights
 grasp a paper water cup (Figure 9c) for an amount of time, and the electrical signal is continuously
of paper water cup are 110 g, 160 g, 210 g, and 310 g, respectively. Figure 9d shows the amplitude
 recorded. The weights of paper water cup are 110 g, 160 g, 210 g, and 310 g, respectively. Figure 9d
signal during the scenarios. The change in electrical resistance is found to be higher when the subject
 shows the amplitude signal during the scenarios. The change in electrical resistance is found to be
grasps the heavier object. From the results, it is clear that this one-layer pressure sensor could be used
 higher when the subject grasps the heavier object. From the results, it is clear that this one-layer
in soft, wearable sensors or actuator applications for control purposes.
 pressure sensor could be used in soft, wearable sensors or actuator applications for control purposes.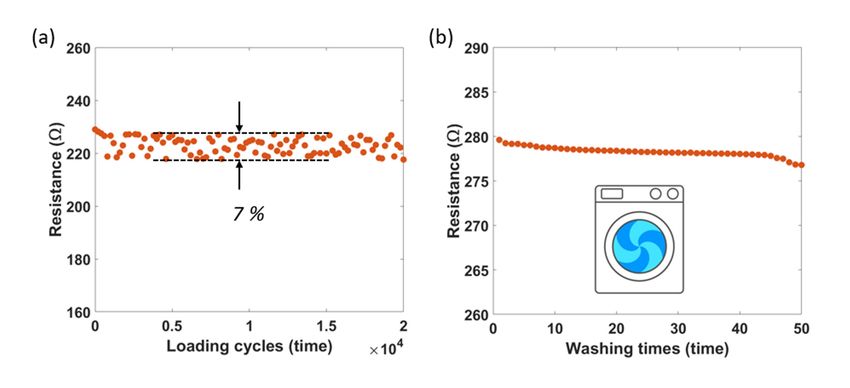
Appl. Sci. 2020, 10, 2877 8 of 10
Appl. Sci. 2020, 10, x FOR PEER REVIEW 8 of 10
Figure 9.
Figure 9. Smart
Smart glove
glove application
application ofof the sensor, consisting
the sensor, consisting of
of (a)
(a) structure
structure of
of the
the sensing
sensing finger
finger on
on
glove, (b)
glove, (b) hardware
hardware platform,
platform, (c)
(c) grasping
grasping aa water
water cup,
cup, and
and (d)
(d) the
the change
change in
in signal
signal amplitude
amplitude when
when
the subject grasps the different weights.
the subject grasps the different weights.
5. Conclusions
This paper
paper presented
presented a case
case of
of aa single-layer
single-layer pressure
pressure sensor
sensor fabricated
fabricated by
by interweaving
interweaving thethe
conductive wool yarns and spacer thread (nonconductive) together in order to create the the one-layer
one-layer
pressure
pressure sensor. The conductive
sensor. The conductive wool
wool yarns are converted from nonconductive yarns by being being
impregnated in CNT CNT inks.
inks. Two electrodes
electrodes ofof the
the sensor
sensor used
used two
two highly
highly conductive
conductive threads.
threads. The
The
electrical characteristics of the sensor are analyzed through experiments.
the sensor are analyzed through experiments. Unlike the conventional
the conventional
pressure
pressure sensors
sensors(multi-layer
(multi-layerstructure),
structure),this
thissensor
sensorisisthin
thin(0.4
(0.4mm),
mm),extremely
extremelylightweight,
lightweight, and has
and hasa
small
a smallhysteresis
hysteresis(5.5%).
(5.5%).WeWealso
alsodemonstrated
demonstratedthe theapplication
applicationof ofthe
theproposed
proposedsensor
sensor for
for detecting
detecting
the grasping
grasping force
force via
via the
the smart
smart glove.
glove. Such sensors can be utilized to sense the grasp action in robot
control
control or
or human
human motion
motion recognition.
recognition.
Author
Author Contributions:
Contributions: All All authors
authors have
have read
read and
and agree
agree to
to the
the published
published version
version of
of the
the manuscript.
manuscript.
Conceptualization, G.K., C.C.V., and J.K.; methodology, G.K., C.C.V., and J.K.; software, C.C.V.; validation,
Conceptualization, G.K., C.C.V., and J.K.; methodology, G.K., C.C.V., and J.K.; software, C.C.V.; validation, G.K.,
G.K., C.C.V., and J.K.; formal analysis, G.K., and C.C.V.; investigation, G.K.; resources, G.K., C.C.V., and J.K.; data
C.C.V., and
curation, J.K.;
G.K., formal
C.C.V., andanalysis, G.K., and C.C.V.;
J.K.; writing—original draftinvestigation, G.K.;and
preparation, G.K., resources, G.K., C.C.V., and
C.C.V.; writing—review J.K.;
and data
editing,
curation,
G.K., G.K.,
C.C.V., andC.C.V., and J.K.; writing—original
J.K.; visualization, G.K., C.C.V., anddraft preparation, J.K.;
J.K.; supervision, G.K.,project
and C.C.V.; writing—review
administration, and
J.K.; funding
acquisition, J.K.
editing, G.K., C.C.V., and J.K.; visualization, G.K., C.C.V., and J.K.; supervision, J.K.; project administration, J.K.;
funding acquisition,
Funding: J.K. was funded by the National Research Foundation of Korea (NRF) grant number
This research
2019R1A2C2005933 and Korea Display Industry Association(KDIA) grant number P0002397. The APC was funded
Funding:
by This Research
the National research Foundation
was fundedofby the and
Korea National
KoreaResearch Foundation
Display Industry of Korea (NRF) grant number
Association.
2019R1A2C2005933 and Korea Display Industry Association(KDIA) grant number P0002397. The APC was
Acknowledgments: This research was supported by the National Research Foundation of Korea (NRF) grant
funded by
funded by the
the Korea
National Research (MSIT)
government Foundation
(No. of Korea and Korea Display
2019R1A2C2005933), and theIndustry Association.
Competency Development Program
for Industry Specialists
Acknowledgments: of research
This the Korean
wasMinistry of Trade,
supported by theIndustry,
Nationaland Energy
Research (MOTIE) operated
Foundation of Koreaby the Korea
(NRF) grant
Institute for Advancement of Technology (KIAT) (No. P0002397, HRD program for Industrial Convergence of
funded by the Korea
Wearable Smart Devices).government (MSIT) (No. 2019R1A2C2005933), and the Competency Development Program
for Industry Specialists of the Korean Ministry of Trade, Industry, and Energy (MOTIE) operated by the Korea
Conflicts of Interest:
Institute for The authors
Advancement declare no
of Technology conflict
(KIAT) of interest.
(No. P0002397, HRD program for Industrial Convergence of
Wearable Smart Devices).
Conflicts of Interest: The authors declare no conflict of interest.
References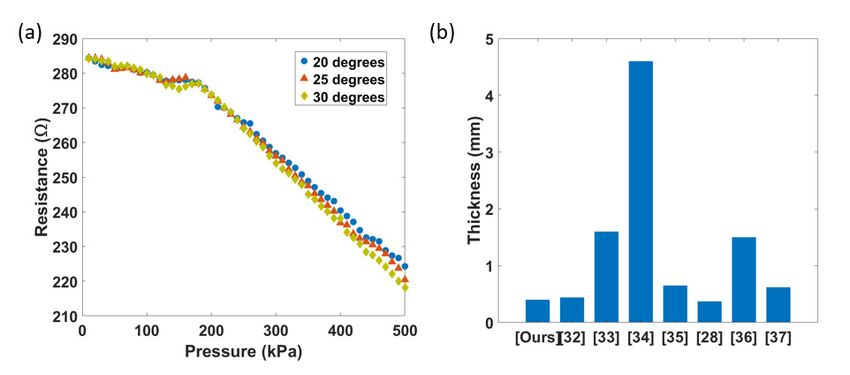
Appl. Sci. 2020, 10, 2877                                                                                        9 of 10

References
1.    Nag, A.; Mukhopadhyay, S.C.; Kosel, J. Wearable Flexible Sensors: A Review. IEEE Sens. J. 2017, 17,
      3949–3960. [CrossRef]
2.    Acar, G.; Ozturk, O.; Golparvar, A.J.; Elboshra, T.A.; Böhringer, K.; Yapici, M.K. Wearable and Flexible Textile
      Electrodes for Biopotential Signal Monitoring: A review. Electronics 2019, 8, 479. [CrossRef]
3.    Liang, T.; Yuan, Y.J. Wearable Medical Monitoring Systems Based on Wireless Networks: A Review.
      IEEE Sens. J. 2016, 16, 8186–8199. [CrossRef]
4.    Jayathilaka, W.A.D.M.; Qi, K.; Qin, Y.; Chinnappan, A.; Serrano-García, W.; Baskar, C.; Wang, H.; He, J.;
      Cui, S.; Thomas, S.W.; et al. Significance of Nanomaterials in Wearables: A Review on Wearable Actuators
      and Sensors. Adv. Mater. 2018, 31, 1805921. [CrossRef]
5.    Di, J.; Zhang, X.; Yong, Z.; Zhang, Y.; Li, D.; Li, R.; Li, Q. Carbon-Nanotube Fibers for Wearable Devices and
      Smart Textiles. Adv. Mater. 2016, 28, 10529–10538. [CrossRef]
6.    Vu, C.C.; Kim, J. Human Motion Recognition by Textile Sensors Based on Machine Learning Algorithms.
      Sensors 2018, 18, 3109. [CrossRef]
7.    Ojuroye, O.O.; Torah, R.N.; Komolafe, A.O.; Beeby, S.P. Embedded Capacitive Proximity and Touch Sensing
      Flexible Circuit System for Electronic Textile and Wearable Systems. IEEE Sens. J. 2019, 19, 6975–6985.
      [CrossRef]
8.    Castano, L.M.; Flatau, A.B. Smart fabric sensors and e-textile technologies: a review. Smart Mater. Struct.
      2014, 23, 053001. [CrossRef]
9.    Li, Y.; Li, Y.; Su, M.; Li, W.; Li, Y.; Li, H.; Qian, X.; Zhang, X.; Li, F.; Song, Y. Electronic Textile by Dyeing
      Method for Multiresolution Physical Kineses Monitoring. Adv. Electron. Mater. 2017, 3, 1700253. [CrossRef]
10.   Wang, S.; Xuan, S.; Liu, M.; Bai, L.; Zhang, S.; Sang, M.; Jiang, W.; Gong, X. Smart wearable Kevlar-based
      safeguarding electronic textile with excellent sensing performance. Soft Matter 2017, 13, 2483–2491. [CrossRef]
11.   Jeong, S.M.; Song, S.; Seo, H.-J.; Choi, W.M.; Hwang, S.-H.; Lee, S.G.; Lim, S.K. Battery-Free,
      Human-Motion-Powered Light-Emitting Fabric: Mechanoluminescent Textile. Adv. Sustainable Syst.
      2017, 1, 1700126. [CrossRef]
12.   Mao, C.; Zhang, H.; Lu, Z. Flexible and wearable electronic silk fabrics for human physiological monitoring.
      Smart Mater. Struct. 2017, 26, 095033. [CrossRef]
13.   Tong, J.; Xu, Z.; Bian, Y.; Niu, Y.; Zhang, Y.; Wang, Z. Flexible and smart fibers decorated with Ag nanoflowers
      for highly active surface-enhanced Raman scattering detection. J. Raman Spectrosc. 2019, 50, 1468–1476.
      [CrossRef]
14.   Koncar, V. Smart Textiles and Their Applications, 1st ed.; Woodhead Publishing: Cambridge, UK, 2016;
      pp. 329–374.
15.   McLaren, R.; Joseph, F.; Baguley, C.; Taylor, D. A review of e-textiles in neurological rehabilitation: How
      close are we? J. NeuroEng. Rehabil. 2016, 13, 59. [CrossRef]
16.   Bonfiglio, A.; Rossi, D.D. Wearable Monitoring Systems, 1st ed.; Springer: Boston, MA, USA, 2010; pp. 147–162.
17.   Heo, J.S.; Eom, J.; Kim, Y.-H.; Park, S.K. Recent Progress of Textile-Based Wearable Electronics: A
      Comprehensive Review of Materials, Devices, and Applications. Small 2017, 14, 1703034. [CrossRef]
18.   Gonçalves, C.; Silva, A.F.d.; Gomes, J.; Simoes, R. Wearable E-Textile Technologies: A Review on Sensors,
      Actuators and Control Elements. Inventions 2018, 3, 14. [CrossRef]
19.   Hughes-Riley, T.; Dias, T.; Cork, C. A Historical Review of the Development of Electronic Textiles. Fibers
      2018, 6, 34. [CrossRef]
20.   Xu, F.; Li, X.; Shi, Y.; Li, L.; Wang, W.; He, L.; Liu, R. Recent Developments for Flexible Pressure Sensors: A
      Review. Micromachines 2018, 9, 580. [CrossRef]
21.   Hu, J.; Meng, H.; Li, G.; Ibekwe, S.I. A review of stimuli-responsive polymers for smart textile applications.
      Smart Mater. Struct. 2012, 21, 053001. [CrossRef]
22.   Tian, M.; Lu, Y.; Qu, L.; Zhu, S.; Zhang, X.; Chen, S. A Pillow-Shaped 3D Hierarchical Piezoresistive Pressure
      Sensor Based on Conductive Silver Components-Coated Fabric and Random Fibers Assembly. Ind. Eng.
      Chem. Res. 2019, 58, 5737–5742. [CrossRef]
23.   Patel, S.; Park, H.; Bonato, P.; Chan, L.; Rodgers, M. A review of wearable sensors and systems with
      application in rehabilitation. J. NeuroEng. Rehabil. 2012, 9, 21. [CrossRef] [PubMed]
Appl. Sci. 2020, 10, 2877 10 of 10
24. Hirai, Y.; Suzuki, Y.; Tsuji, T.; Watanabe, T. Tough, bendable and stretchable tactile sensors array for covering
robot surfaces. IEEE Int. Conf. on RoboSoft 2018, 1, 276.
25. Qiang, S.; Carey, T.; Arbab, A.; Song, W.; Wang, C.; Torrisi, F. Wearable solid-state capacitors based on
two-dimensional material all-textile heterostructures. Nanoscale 2019, 11, 9912–9919. [CrossRef]
26. Chai, Z.; Zhang, N.; Sun, P.; Huang, Y.; Zhao, C.; Fan, H.J.; Fan, X.; Mai, W. Tailorable and Wearable Textile
Devices for Solar Energy Harvesting and Simultaneous Storage. ACS Nano 2016, 10, 9201–9207. [CrossRef]
[PubMed]
27. Wang, B.; Facchetti, A. Mechanically Flexible Conductors for Stretchable and Wearable E-Skin and E-Textile
Devices. Adv. Mater. 2019, 31, 1901408. [CrossRef] [PubMed]
28. Atalay, O.; Atalay, A.; Gafford, J.; Walsh, C. A Highly Sensitive Capacitive-Based Soft Pressure Sensor Based
on a Conductive Fabric and a Microporous Dielectric Layer. Adv. Mater. Technol. 2018, 3, 1700237. [CrossRef]
29. Pizarro, F.; Villavicencio, P.; Yunge, D.; Rodríguez, M.; Hermosilla, G.; Leiva, A. Easy-to-Build Textile Pressure
Sensor. Sensors 2018, 18, 1190. [CrossRef] [PubMed]
30. Jeong, Y.J.; Kim, Y.E.; Kim, K.J.; Woo, E.J.; Oh, T.I. Multilayered Fabric Pressure Sensor for Real-Time
Piezo-Impedance Imaging of Pressure Distribution. IEEE Trans. Instrum. Meas. 2019, 69, 565–572. [CrossRef]
31. Chang, S.; Li, J.; He, Y.; Liu, H.; Cheng, B. A high-sensitivity and low-hysteresis flexible pressure sensor
based on carbonized cotton fabric. Sens. Actuators, A 2019, 294, 45–53. [CrossRef]
32. Weaving Kit. Available online: http://wovenonlooms.com/product/list.html?cate_no=24 (accessed on
2 April 2020).
33. Lou, C.; Wang, S.; Liang, T.; Pang, C.; Huang, L.; Run, M.; Liu, X. A Graphene-Based Flexible Pressure Sensor
with Applications to Plantar Pressure Measurement and Gait Analysis. Materials 2017, 10, 1068. [CrossRef]
34. Qi, K.; Wang, H.; You, X.; Tao, X.; Li, M.; Zhou, Y.; Zhang, Y.; He, J.; Shao, W.; Cui, S. Core-sheath nanofiber
yarn for textile pressure sensor with high pressure sensitivity and spatial tactile acuity. J. Colloid Interface Sci.
2020, 561, 93–103. [CrossRef] [PubMed]
35. Baldoli, I.; Maselli, M.; Cecchi, F.; Laschi, C. Development and characterization of a multilayer matrix textile
sensor for interface pressure measurements. Smart Mater. Struct. 2017, 26, 104011. [CrossRef]
36. Lim, S.J.; Bae, J.H.; Jang, S.J.; Lim, J.Y.; Ko, J.H. Development of Textile-based Pressure Sensor and Its
Application. Fibers Polym. 2018, 19, 2622–2630. [CrossRef]
37. Büscher, G.H.; Kõiva, R.; Schürmann, C.; Haschke, R.; Ritter, H.J. Flexible and stretchable fabric-based tactile
sensor. Rob. Auton. Syst. 2015, 63, 244–252. [CrossRef]
38. Lim, S.J.; Bae, J.H.; Han, J.H.; Jang, S.J.; Oh, H.J.; Lee, W. Foldable and washable fully textile-based pressure
sensor. Smart Mater. Struct. 2019. accepted. [CrossRef]
© 2020 by the authors. Licensee MDPI, Basel, Switzerland. This article is an open access
article distributed under the terms and conditions of the Creative Commons Attribution
(CC BY) license (http://creativecommons.org/licenses/by/4.0/).You can also read