The Effects of Methane Storage Capacity Using Upgraded Activated Carbon by KOH - MDPI
←
→
Page content transcription
If your browser does not render page correctly, please read the page content below
applied
           sciences
Article
The Effects of Methane Storage Capacity Using
Upgraded Activated Carbon by KOH
Jung Eun Park, Gi Bbum Lee, Sang Youp Hwang, Ji Hyun Kim, Bum Ui Hong, Ho Kim
and Seokhwi Kim *
 Center for Plant Engineering, Institute for Advanced Engineering, Yongin-si 17180, Korea;
 jepark0123@gmail.com (J.E.P.); mnbbv21c@gmail.com (G.B.L.); syhwang80@iae.re.kr (S.Y.H.);
 jhkim2017@iae.re.kr (J.H.K.); buhong@iae.re.kr (B.U.H.); kimh0505@iae.re.kr (H.K.)
 * Correspondence: shkim5526@iae.re.kr; Tel.: +82-31-330-7203

 Received: 10 August 2018; Accepted: 28 August 2018; Published: 9 September 2018

 Abstract: In this study, a feasible experiment on adsorbed natural gas (ANG) was performed using
 activated carbons (ACs) with high surface areas. Upgraded ACs were prepared using chemical
 activation with potassium hydroxide, and were then applied as adsorbents for methane (CH4 ) storage.
 This study had three principal objectives: (i) upgrade ACs with high surface areas; (ii) evaluate the
 factors regulating CH4 adsorption capacity; and (iii) assess discharge conditions for the delivery
 of CH4 . The results showed that upgraded ACs with surface areas of 3052 m2 /g had the highest
 CH4 storage capacity (0.32 g-CH4 /g-ACs at 3.5 MPa), which was over two times higher than the
 surface area and storage capacity of low-grade ACs (surface area = 1152 m2 /g, 0.10 g-CH4 /g-ACs).
 Among the factors such as surface area, packing density, and heat of adsorption in the ANG system,
 the heat of adsorption played an important role in controlling CH4 adsorption. The released heat
 also affected the CH4 storage and enhanced available applications. During the discharge of gas from
 the ANG system, the residual amount of CH4 increased as the temperature decreased. The amount
 of delivered gas was confirmed using different evacuation flow rates at 0.4 MPa, and the highest
 efficiency of delivery was 98% at 0.1 L/min. The results of this research strongly suggested that the
 heat of adsorption should be controlled by both recharging and discharging processes to prevent
 rapid temperature change in the adsorbent bed.

 Keywords: adsorbed natural gas; activated carbon; potassium hydroxide; heat of adsorption;
 gas delivery

1. Introduction
     The use of alternative energies, such as hydrogen (H2 ) and methane (CH4 ), has been studied.
Studies on H2 are usually focused on the production process [1–3], while those on CH4 are mainly
concentrated on its storage and transport. Methane is one of the most significant sources of energy from
natural or purified biogas due to large resources with minimal environmental impacts. Liquefaction
and compression techniques are generally applied for the storage of natural gas, but these are not
practical for transportation purposes as automobile fuels because they require additional systems
to lower the temperature to 111 K for liquefaction and pressurization over 20 MPa for compressing
natural gas [4,5].
     As an alternative method for natural gas storage, adsorbed natural gas (ANG) systems, which can
store natural gas at a relatively lower pressure (3–4 MPa), have been considered and intensively
studied [6–10]. The CH4 storage capacity is the same or even higher than that of compressed natural
gas (CNG) at 20 MPa. Since adsorption of CH4 involves the interaction between the gas phase and
adsorbents at a certain pressure, the gas storage capacity is strongly dependent on the adsorbent’s

Appl. Sci. 2018, 8, 1596; doi:10.3390/app8091596                              www.mdpi.com/journal/applsci
Appl. Sci. 2018, 8, 1596                                                                         2 of 10

surface area and pore structures. Previous researchers have studied adsorbents such as activated carbon
(AC), high surface activated carbon (HSAC), metal organic frameworks (MOF), and active carbon
fiber [11,12]. Among the various adsorbents, activated carbons (ACs) have been considered the most
suitable adsorbents due to their high surface area, microporosity, and regenerative capacity [13–15].
In this respect, previous works have been conducted to enhance the properties of adsorbents with
high surface areas to develop micropores using physical and chemical activation [16]. In the literature,
there are few studies on physical activation using steam or carbon dioxide (CO2 ), and on chemical
activation using potassium hydroxide (KOH), potassium chloride (KCl), phosphoric acid (H3 PO4 ),
etc. [17–19]. Particularly, the CH4 storage capacity of activated carbon by H3 PO4 (14 mmol CH4 /g-AC)
followed by chemical activation is higher than that of KCl (9 mmol CH4 /g-AC) [8]. Lu et al. [20]
mentioned that the diffusion rate of the potassium in KOH is more effective than the potassium in
K2 CO3 due to high micropore volume and a larger surface area [21–23].
      One of the difficulties in ANG techniques is the management of thermal effects. The heat
of adsorption significantly affects ANG storage capability even for adsorbents with high surface
areas. According to the computational results of Mota et al., it was suggested that gas should be
cooled before it is injected into vessels filled with adsorbents [24]. Owing to adsorbents having poor
thermal conductivity, heat transfer to the surroundings is limited. Thus, it can lead to the suppression
of adsorption storage capacity. According to the experimental results from Chang and Talu [25],
gas delivery capacity decreased by more than 8% when the temperature decreased to 268 K, and its
dynamic loss fluctuated from 15 to 25% due to changes in the heat capacity of the carbon bed. Thus,
many researchers have developed transient heat and mass transfer models to simulate the performance
of adsorption systems [26–28]. For instance, Ybyraiymkul et al. [27] proposed an ANG cylinder with
water passing through the tubes to effectively control the heat of adsorption.
      In addition, heat transfer on the adsorbent has an influence on gas delivery during discharge.
The heat of adsorption generally decreases during the discharge. Thus, the amount of delivered gas
decreases when the discharge flowrate is higher. Due to these reasons, a large amount of natural
gas still remained after discharging in the previous adsorption systems. Currently, to overcome the
limitations, MOF with flexible structures have been developed [29]. The pores in the MOF structure
were expanded at a certain pressure, and then the gases were adsorbed in the pores. On the other hand,
the adsorbents were desorbed from inside the pores while shrinking the pore structure at low pressure.
MOF have advantages for both adsorption and desorption of methane, but it is not yet commercially
developed and is also expensive [30]. NGVs (natural gas vehicles) with an adsorption system require a
large amount of adsorbents, leading to a high price. Using ACs for the adsorption system is much
cheaper than MOF, and is already commercialized. If the heat generation and discharging conditions
in the ANG system are controlled and optimized, respectively, this system with ACs can be used in
NGVs and for various other applications as well.
      This study was performed (i) to evaluate the CH4 adsorption capacity in various conditions
and (ii) to optimize the discharge conditions for the delivery of CH4 . In more detail, upgraded ACs
with a high surface area were produced by chemical activation and were applied in an ANG system.
In addition, ANG experiments were performed with different conditions, such as temperature and
pressure, and were compared with the amount of available CH4 at different discharge rates.

2. Materials and Methods

2.1. Preparation of Activated Carbons
     Two types of commercial ACs (wood: JIG-SC-2040, Ja Yeon Science Ind. Co., Chulwon, Korea;
coconut: LGL-100, Daelim Carbon Ind. Co., Seoul, Korea) were utilized as precursors for this
study. To upgrade the low-grade AC, 1 kg of AC was treated with potassium hydroxide (KOH,
Samchun chemical, Seoul, Korea) and the mass ratio of AC:KOH was 1:2 under an inert environment.
After the chemical activation, the average particle size of the upgraded ACs was around 500 µm.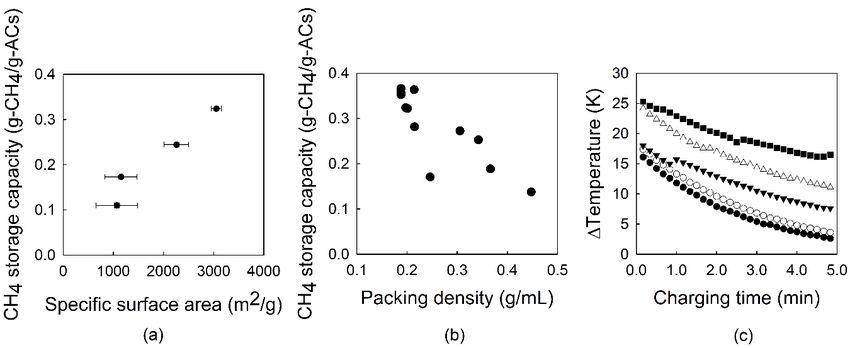
Appl. Sci. 2018, 8, 1596                                                                             3 of 10

The mixture was put into a tubular furnace under N2 flow and heated to 1123 K at a rate of 10 K/min,
and then held for 3 h, as described in a previous study [31]. After completion of the activation
processes, the prepared AC was washed with deionized water until the pH was neutral, and was
subsequently dried at 378 K. The commercial ACs based from wood and coconut were denoted as
AC-WR and AC-CR, respectively. The chemically activated ACs using the commercial ACs were also
denoted as AC-WA and AC-CA, respectively (AC: activated carbon, W: wood based, C: coconut based,
R: raw/commercial materials, and A: activation).

2.2. Analytical Methods for Determining the Chemical Properties of Activated Carbons
      For the proximate analysis, the dried samples were put into a furnace (Daeheung Science, DF-4S,
Korea) and heated at 1223 K for 7 min. The weight loss of the samples was measured for volatile matter.
The samples were put into the furnace again and heated at 1023 K for 10 h to measure the amount of
weight loss for fixed carbon and the residual for ash contents. The ash, volatile matter, and fixed C
contents within the ACs were considered as a percentage of the weight. The elemental (C, H, O, N,
and S) contents were determined using an elemental analyzer (FLASH 2000, Thermo Fisher Scientific,
Waltham, MA, USA), and the results are listed in Table 1. The surface area of the AC was measured
using the Brunauer-Emmett-Teller (SBET ) method based on the N2 adsorption at 77 K, which was
measured using an adsorption analyzer (ASAP-2010, Micromeritics Inc., Norcross, GA, USA). The pore
volume (V) of the AC was calculated according to the t-plot method for micropores (2 nm), respectively. Before carrying out the
N2 isotherms, samples were outgassed at 623 K to a constant vacuum (P/P0 : 2 µmHg) for 360 min.
To investigate the surface morphologies of ACs with and without chemical activation by KOH,
a field-emission scanning electron microscope (FE-SEM; S-4300, Hitachi Co, Tokyo, Japan) was used.

      Table 1. Ultimate and proximate analysis of ACs (activated carbons) as precursors. AC-WR:
      the commercial ACs based on wood material, AC-CR: the commercial ACs based on coconut material,
      n.d.: not detected.

    Sample                   Ultimate Analysis (wt.%)                    Proximate Analysis (wt.%)
                  Carbon   Hydrogen   Oxygen     Nitrogen    Sulfur   Volatile   Fixed Carbon     Ash
    AC-WR          71.60     1.60      17.20       0.80       n.d.     18.56           74.68      6.76
    AC-CR          89.03     0.30      2.50        0.00       n.d.      5.14           92.73      2.12

2.3. Adsorbed Natural Gas System Experiments
     The ANG system consisted of a compressor with an adjustable flow rate and a prototype storage
cylinder with a volume of 50 mL (Diameter: 40 mm; Height: 40 mm) that was filled to maximum
capacity. Using this system, the CH4 storage capacity was evaluated as a function of pressure up to
20 MPa. In the charge period, the CH4 gas was maintained at a constant pressure with a pressure
regulator. The weight of the reactor filled with ACs was measured using a balance, and the CH4
was sufficiently adsorbed in the reactor. The weight difference was the amount of CH4 adsorbed.
The desorption of CH4 was then tested in atmosphere (101 kPa) and vacuum conditions (20 kPa) with
a discharge flow rate of 0.5 L/min. After the desorption process, the weight of the reactor with ACs
was measured again using the balance. The weight differences indicated the amount of CH4 desorbed.
In the ANG system, deliverability, which represents useable gas capacity, is one of the main factors in
the application. It can be defined as the difference in the amount of CH4 between adsorption at the
target storage pressure and the residual after desorption. To evaluate delivery capacity, discharge flow
rates were regulated with a flowrate of 0.1 and 0.5 L/min at 0.4 MPa, respectively. A CNG experiment
in the absence of absorbents was also performed as a function of pressure up to 20 MPa for comparison.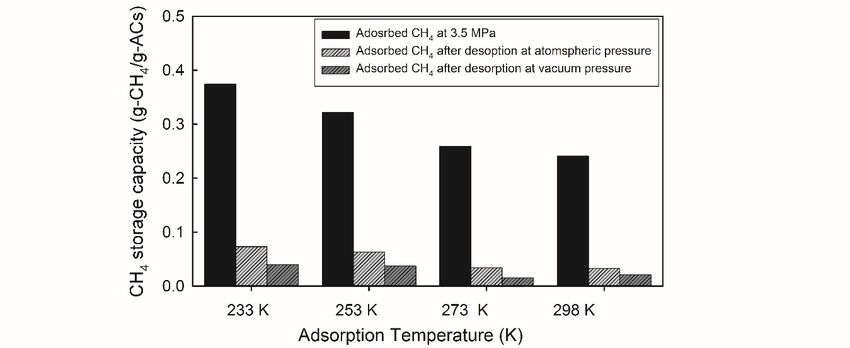
Appl. Sci. 2018, 8, 1596 4 of 10
3. Results
3.1. Upgrading Activated Carbons
Elemental contents, such as C, H, O, N, and S, were different in the precursors of wood and
Appl. Sci. 2018, 8,(Table
coconut x FOR PEER
1). REVIEW 4 of 10
C contents were relatively high in the samples from coconuts, while H and O were relatively
Table
more 1. Ultimate and in
concentrated proximate
the woodanalysis of ACs
samples. (AC-WRthe
Similarly, andlevel
AC-CR). N.D.: not
of volatile detected.
matter in the wood samples
was
Sample 2.5 times higher than in the coconut
Ultimate Analysis (wt.%) samples. The molar ratio of O/C, which
Proximate Analysis (wt.%) is indicative of
oxygenated functional
C Hgroups (OFGs),
O ofNthe woodS samples was eight times
Volatile higher
Fixed carbonthan thatAsh
of coconut
samples.
AC-WR OFGs,
71.60 as electron
1.60 donors,
17.20 may accelerate
0.80 n.d the redox
18.56 reaction more easily
74.68 than elemental
6.76 C
when
AC-CR chemical
89.03activation
0.30 with KOH
2.50 is applied.
0.00 Thus,
n.d. pore development
5.14 on the
92.73 surface of the
2.12 wood
samples would be more enhanced [32,33].
N2 adsorption
N2 adsorption and desorption
and desorption isotherms
isotherms of ACsof followed
ACs followed the type
the type I isotherms
I isotherms regardless
regardless of of
activation with KOH, as shown in Figure
activation with KOH, as shown in Figure 1a,b. 1a,b.
FigureFigure
1. Nitrogen ad-/de-sorption
1. Nitrogen isotherms
ad-/de-sorption and pore
isotherms andsize
poredistribution for coconut
size distribution (a,c) and
for coconut (a,c)wood
and wood
(b,d) based
(b,d) based (activated
ACs. ACs were carbons).
classified These
into low ACs
and were classified
upgraded into low
without/with KOHandtreatment.
upgraded without/with
KOH treatment.
As shown in Figure 1a,b and Table 2, the surface area and micropore volume of wood based ACs
(AC-WR and As shown
AC-WA) in Figure 1a,b and
were higher Table
than 2, thebased
coconut surface area(AC-CR
ACs and micropore volume
and AC-CA). of wood
After based ACs
activation,
(AC-WR
the surface and
area ofAC-WA)
upgradedwere
ACshigher thantwo
was over coconut
timesbased
higherACs
than(AC-CR
that ofand AC-CA). ACs.
raw-graded AfterIn
activation,
the
adsorption and desorption isotherms of the adsorbents, the hysteresis loop in the relative pressureIn the
the surface area of upgraded ACs was over two times higher than that of raw-graded ACs.
(P/P0)adsorption and desorption
range of 0.4–1.0 isotherms
was indicative of the of the adsorbents,
mesoporosity the In
of ACs. hysteresis
the case loop in the relative
of AC-WA, pressure
the fraction
of mesoporosity was rapidly increased compared to AC-WR. However, in the case of AC-C, the 24.5%
fraction of mesoporosity was increased to 47.5% after upgrading. The pore size distribution of the
adsorbents clearly showed that the mesopores had a broad pore size distribution (Figure 1c,d). All
samples dominantly developed micropores, but the mesopore fractions increased after KOH
treatment. The surface areas (SBET) of the upgraded samples (AC-WA and AC-CA) increased
Appl. Sci. 2018, 8, 1596                                                                                 5 of 10

(P/P0 ) range of 0.4–1.0 was indicative of the mesoporosity of ACs. In the case of AC-WA, the fraction
of mesoporosity was rapidly increased compared to AC-WR. However, in the case of AC-C, the 24.5%
fraction of mesoporosity was increased to 47.5% after upgrading. The pore size distribution of
the adsorbents clearly showed that the mesopores had a broad pore size distribution (Figure 1c,d).
All samples dominantly developed micropores, but the mesopore fractions increased after KOH
treatment. The surface areas (SBET ) of the upgraded samples (AC-WA and AC-CA) increased
significantly,
Appl. Sci. 2018, 8,and  were
                    x FOR    over
                          PEER    two times greater than those of the precursors (Table 2 and Figure 1).
                               REVIEW                                                                 5 of 10

                            Table 2. Textural properties
                                              properties and
                                                         and methane
                                                             methane storage
                                                                     storage capacity.
                                                                             capacity.

                   S       VMicro
                              VMicro VMeso   VMeso RR          Rmeso       Methane Storage Capacity
       Sample SBET 2BET
   Sample
                                                         micro R
                                                       micro     meso       Methane   Storage Capacity
                 (m  g−1 ) (cm    3 −1 )
                             3 −1 g        (cm 3 −1 )
                                             3 −1g      (%)     (%)             (g-CH4 /g-AC)
            (m g )
               2  −1
                          (cm g )        (cm g )      (%)      (%)                   (g-CH4/g-AC)
       AC-WR     1152               0.50        0.59       46.1    53.9                  0.17
   AC-WR     1152               0.50         0.59        46.1     53.9                       0.17
       AC-WA     3052               0.04        2.37       1.73    98.3                  0.32
   AC-WA
       AC-CR 30521068           0.040.35     2.37
                                                0.11     1.73
                                                           75.5   98.3
                                                                   24.5                  0.110.32
   AC-CR
       AC-CA 10682258           0.350.48     0.11
                                                0.43     75.5
                                                           52.5   24.5
                                                                   47.5                  0.250.11
   AC-CA             2258       0.48         0.43        52.5     47.5                      0.25
    We
    We observed
          observed the
                   the adsorbents
                       adsorbents with
                                    with an
                                         an FE-SEM
                                            FE-SEM to
                                                    to investigate
                                                        investigate their
                                                                    their morphologies,
                                                                          morphologies, as
                                                                                        as shown
                                                                                           shown in
                                                                                                  in
Figure
Figure 2.  SEM images
       2. SEM   images of
                        of the
                           the activated
                               activated adsorbents
                                         adsorbents (AC-WA
                                                    (AC-WA and and AC-CA)
                                                                    AC-CA) revealed
                                                                            revealed rough
                                                                                     rough surfaces
                                                                                            surfaces
caused
caused by
       by pore
           pore generation.
                generation.

            Figure 2. SEM image of altered carbon (AC) such as AC-WR, AC-WA,
                                                                      AC-WA, AC-CR,
                                                                             AC-CR, and
                                                                                    and AC-CA.
                                                                                        AC-CA.

3.2.
3.2. Characteristics
     Characteristics of
                     of CH   Storage by
                        CH44 Storage   by Compressed
                                          Compressed and
                                                      and Adsorbed
                                                           Adsorbed
     Figure
      Figure 3a
             3a shows
                shows thethe CH    storage capacity
                              CH44 storage   capacity as
                                                      as aa function
                                                            function ofof pressure
                                                                          pressure under
                                                                                   under aa compressed
                                                                                            compressed system.
                                                                                                         system.
The  storage  capacity   of CH    increased   with  pressure;   the  storage  capacity was  0.176
The storage capacity of CH44 increased with pressure; the storage capacity was 0.176 g-CH4/mL     g-CH 4 /mL  at
                                                                                                           at 20
20 MPa,
MPa,     which
       which  waswas   beyond
                   beyond    thethe expectation
                                 expectation      (0.131
                                               (0.131 g-CHg-CH   4 /mL)
                                                              4/mL)
                                                                         because
                                                                     because      of the
                                                                              of the     compression
                                                                                     compression     properties
                                                                                                  properties (Z-
(Z-factor of 0.84 at 298  K)  of CH
factor of 0.84 at 298 K) of CH4 [34].4 [34].
3.2. Characteristics of CH4 Storage by Compressed and Adsorbed
Figure 3a shows the CH4 storage capacity as a function of pressure under a compressed system.
The storage capacity of CH4 increased with pressure; the storage capacity was 0.176 g-CH4/mL at 20
MPa,
Appl. which
Sci. 2018, was beyond the expectation (0.131 g-CH4/mL) because of the compression properties
8, 1596 6 of 10(Z-
factor of 0.84 at 298 K) of CH4 [34].
Appl. Sci. 2018, 8, x FOR PEER REVIEW 6 of 10
Figure
Figure 3. (a)
3. (a) Comparison
Comparison of of measured
measured methane
methane storage
storage in the
in the reactor
reactor andand
thethe calculated
calculated methane
methane
amount
amount based
based on on
thethe reactor
reactor volume
volume at different
at different pressures
pressures using
using thethe ideal
ideal gasgas law;
law; andand
(b)(b) comparison
comparison
of methane storage between adsorbed natural gas (ANG) and compressed natural gas (CNG) at
of methane storage between adsorbed natural gas (ANG) and compressed natural gas (CNG) at
different pressures (inset Figure 3b illustrating the ratio for ANG/CNG).
different pressures (inset Figure 3b illustrating the ratio for ANG/CNG).
On the
On the other
other hand,
hand, the
the CH
CH4 storage
storage capacities
capacities ofof the
the ANG
ANG system
system under
under the
the given
given pressure
pressure
4
conditions were up to 20 MPa higher than those of the CNG system (Figure
conditions were up to 20 MPa higher than those of the CNG system (Figure 3b). The CH4 3b). The CH 4 storage
capacitycapacity
storage at a pressure of less than
at a pressure 6 MPa
of less than was
6 MPaover
was two times
over twohigher
times than
higherthat of that
than the CNG
of thesystem
CNG
(Figure 3b), while it became close to the capacity of the CNG system towards a
system (Figure 3b), while it became close to the capacity of the CNG system towards a pressurepressure of 20 MPa.of
The parabolic CH 4 storage trend in the ANG system at a relatively lower pressure strongly indicated
20 MPa. The parabolic CH4 storage trend in the ANG system at a relatively lower pressure strongly
that the number
indicated that theofnumber
active sites that sites
of active adsorb CH
that 4 molecules is one of the most important adsorbent
adsorb CH4 molecules is one of the most important
properties.
adsorbent properties.
3.3. Methane
3.3. Methane Storage
Storage Capacity
Capacity at
at Different
Different Conditions
Conditions
Adsorbents are
Adsorbents are mainly
mainly affected
affected by
by the
the surface
surface area,
area, pore
pore size
size distribution,
distribution, and
and packing
packing density.
density.
These factors
These factors should
should bebe addressed
addressed toto achieve
achieve higher
higher storage
storage capacity
capacity in
in the
the ANG
ANG system
system [4,11,35].
[4,11,35].
Among these
Among these factors,
factors, the
the surface
surface area
area seems
seems to
toprimarily
primarily affect
affectthe
theCH
CH44 storage
storage capacity.
capacity. Figure
Figure 4a
4a
clearlyshows
clearly shows aa positive
positive correlation
correlationbetween
betweenthethe surface
surfacearea
areaand
and the
the CH
CH44 storage
storage capacity,
capacity, as
as shown
shown
in previous studies [7,36,37].
in previous studies [7,36,37].
Figure
Figure 4. Influence of
4. Influence of(a)
(a)the
themethane
methanestorage
storagecapacity
capacity ononthethe surface
surface area
area overover upgraded
upgraded ACs.ACs.
Di-
Di-directional
directional error error bars
bars show
show standard
standard deviation
deviation forfor
thetheCH CH 4 storage
4 storage capacity
capacity andand thethe surface
surface area
area of
of ACs; (b) the unit mass of the adsorbed on the packing density of the AC-WA (3052 m 2 /g); and (c)
ACs; (b) the unit mass of the adsorbed on the packing density of the AC-WA (3052 m /g); and (c) the 2
the differential
differential temperature
temperature as aasfunction
a function of adsorption
of adsorption timetime with
with each
each adsorbed
adsorbed pressure
pressure (●:( 2.0
: 2.0 MPa,
MPa, ○:
#: H 4 2
5.0 MPa, ▼: 6.0 MPa, △: 7.0 MPa, ■: 20 MPa), with a flow rate of 0.5 L/min over AC-WA (3052 m2/g).
5.0 MPa, : 6.0 MPa, : 7.0 MPa, : 20 MPa), with a flow rate of 0.5 L/min over AC-WA (3052 m /g).
By using upgraded ACs (AC-WA) in ANG experiments at 3.5 MPa in this study, the CH4 storage
capacity of upgraded samples increased by 59.6% for AC-WR (0.273 g-CH4/g-ACs) compared with
the low-grade sample (0.171 g-CH4/g-ACs). However, its capacity did not show a positive
relationship with the packing density (Figure 4b). As mentioned previously, the increase in theAppl. Sci. 2018, 8, 1596 7 of 10
By using upgraded ACs (AC-WA) in ANG experiments at 3.5 MPa in this study, the CH4
storage capacity of upgraded samples increased by 59.6% for AC-WR (0.273 g-CH4 /g-ACs) compared
with the low-grade sample (0.171 g-CH4 /g-ACs). However, its capacity did not show a positive
relationship with the packing density (Figure 4b). As mentioned previously, the increase in the number
of adsorption sites could lead to the enhanced CH4 storage capacity in the ANG tank. However,
this adsorption process entails an exothermic reaction, so the decreasing patterns of CH4 storage
capacity in Figure 4b could be explained by the increase in packing density. The heat control of
adsorption plays an important role in gas storage because it significantly affects adsorption rates.
Experimental and modeled results from Yue et al. revealed that the temperature induced by the heat
of adsorption at the beginning of the adsorption experiment increased sharply and reached up to
14 K of temperature difference using a coal sample [28]. A few studies on the heat of adsorption
according to various pressures, and even on CH4 stored under compression, were reported in the
literature. The temperature difference (∆T) inside the reactor decreased as the pressure decreased,
as shown
Appl. Sci.in Figure
2018, 4c. PEER
8, x FOR At the beginning of adsorption, the rapid increase in ∆T influenced the CH74of 10
REVIEW
adsorption capacity.
HeatHeat transfer
transfer accompanied
accompanied adsorption.
adsorption.Thus,
Thus,thethe
temperature
temperature of of
thethe
adsorbent
adsorbent bedbedhadhad
a a
significant
significant influence
influence on the ANG
on the ANG storage system.
storage system.We Weinvestigated the the
investigated CHCH 4 storage as aasfunction
4 storage of of
a function
adsorption
adsorption temperature,
temperature, as shown
as shown in Figure 5. The
in Figure results
5. The showed
results thatthat
showed the the
CHCH4 capacity
4 capacityin AC-WA
in AC-WA
increased
increased at low adsorption
at low temperatures.
adsorption temperatures. TheThe
residual
residualamount of CH
amount after
of 4CH atmospheric
4 after atmospheric pressure
pressure
(101(101
kPa)kPa)desorption
desorption showed
showed thatthat
thethe
residual
residualCHCH4 increased
4 increasedfrom
from 15 to
15% 20%
to as
20% the
as temperature
the temperature
decreased.
decreased. In In
thethevacuum
vacuum desorption,
desorption, residual
residualCH CH4 increased
4 increasedfrom
from5 5%to 10% as the
to 10% temperature
as the temperature
decreased.
decreased. TheThe residues were
residues dependent
were dependent on both the the
on both desorption temperature
desorption temperature andand
pressure.
pressure.
Figure 5. Methane
Figure storage
5. Methane and and
storage residual capacity
residual as a as
capacity function of adsorption/desorption
a function temperature
of adsorption/desorption temperature
for AC-WA. All adsorption
for AC-WA. experiments
All adsorption werewere
experiments performed
performedat 3.5atMPa and and
3.5 MPa withwith
12.0 12.0
g of g
AC.
of AC.
3.4. Gas Delivery
3.4. Gas Delivery
Previous research has only addressed the enhancement of storage efficiency without considering
Previous research has only addressed the enhancement of storage efficiency without considering
gas delivery, which is the amount of gas available under certain circumstances using porous adsorbents.
gas delivery, which is the amount of gas available under certain circumstances using porous
The CH4 storage capacity is not equal to useable gas capacity due to the strong interaction with the
adsorbents. The CH4 storage capacity is not equal to useable gas capacity due to the strong interaction
adsorbents [36]. To provide intensive research, we confirmed that gas delivery after adsorption
with the adsorbents [36]. To provide intensive research, we confirmed that gas delivery after
depended on the discharge rates (0.1 L/min, 0.5 L/min) at 0.4 MPa after adsorption at 10 MPa
adsorption depended on the discharge rates (0.1 L/min, 0.5 L/min) at 0.4 MPa after adsorption at 10
(Figure 6).
MPa (Figure 6).Previous research has only addressed the enhancement of storage efficiency without considering
gas delivery, which is the amount of gas available under certain circumstances using porous
adsorbents. The CH4 storage capacity is not equal to useable gas capacity due to the strong interaction
with the adsorbents [36]. To provide intensive research, we confirmed that gas delivery after
adsorption depended on the discharge rates (0.1 L/min, 0.5 L/min) at 0.4 MPa after adsorption8 at
Appl. Sci. 2018, 8, 1596
10
of 10
MPa (Figure 6).
of delivery
Figure 6. Variation of delivery capacity
capacity with
with specific
specific flow
flow rate
rate for
for constant
constant pressure
pressurecharging.
charging.
AA CNG
CNG experiment
experimentwas
wasconducted
conductedatat0.5
0.5L/min
L/min for
for comparison.
comparison. The
The accessible
accessible CH
CH44 varied
varied with
with
different
differentdischarge
dischargerates.
rates. Useable
Useablemasses
massesof
ofCH
CH44 after
after delivery
delivery of
of ANG
ANG were
were much
much higher
higher than
than those
those
in
in the
the CNG
CNG system.
system. For
For instance,
instance, the
the mass
mass of
of available
availableCH
CH44 in
in the ANG
ANG system
system was
was 6.8%
6.8% higher
higher than
than
in the CNG system at a constant flow rate (0.5 L/min, 0.4 MPa). In addition, the storage capacity in the
presence of ACs was 25.4% higher than in the CNG system at the same pressure of 10 MPa (Figure 3b)
and also the useable CH4 in ANG was higher, as mentioned previously. Both the high storage capacity
and the discharging rate of CH4 in the ANG system lead to the high gas delivery.
In the ANG system, deliverable CH4 became greater when the discharge rates decreased. Over 87%
(6.22 L) of total adsorbed CH4 could be delivered at a discharge rate of 0.5 L/min, while over 98% of
CH4 (7.01 L) was available at 0.1 L/min. This was because of the changes in the heat of the carbon
bed during CH4 discharge. During the gas discharge, the temperature of the carbon bed might have
cooled, thereby reducing the CH4 delivery capacity. Zakaria and George also reported that the delivery
capacity was highly influenced by the carbon bed temperature [38]. Thus, a heating system could be
introduced to improve the CH4 delivery capacity during discharge periods.
4. Conclusions
This work aimed to determine the most efficient storage of CH4 gas using an ANG system.
An upgraded adsorbent was applied in the ANG system, and the efficiency was tested under various
conditions, such as temperature, pressure, and discharge flow rate. To upgrade the adsorbents,
ACs were chemically activated with KOH, thereby resulting in a high surface area (3052 m2 /g) with a
micropore volume of 0.58 cm3 /g. The surface area of the ACs increased with increasing CH4 storage.
Among them, AC-WA with a high surface area showed the highest storage value of 0.32 g-CH4 /g-AC.
The heat of adsorption significantly influenced the amount of adsorbed and/or desorbed CH4 in
the ANG system. During the adsorption of CH4 gas, the exothermic temperature should be suppressed
to increase the adsorption amount. The amount of discharged CH4 increased as the temperature
increased. The results also confirmed that CH4 capacity was controlled by heat during both recharging
and discharging conditions. These results could form the foundation for the practical application of
the ANG system.
Author Contributions: S.K., J.E.P. and H.K. conceived and designed the experiments; J.E.P. and S.K. drafted the
manuscript; J.E.P., G.B.L. and S.Y.H. performed the experiments; J.H.K., G.B.L. upgraded the activated carbons;
J.H.K. analyzed the data; B.U.H. and H.K funded this works; S.Y.H., S.K. and J.E.P. wrote and revised the paper.
Funding: This study was supported by the Energy Development Technology Program of the Korea Institute
of Energy Technology Evaluation and Planning (KETEP) granted financial resource from the Ministry of Trade,
Industry & Energy, Republic of Korea (Project No. 20162010104680) and also the National Research Foundation ofAppl. Sci. 2018, 8, 1596 9 of 10
Korea(NRF) and the Center for Women In Science, Engineering and Technology(WISET) Grant funded by the
Ministry of Science and ICT under the Program for Returners into R&D.
Acknowledgments: The authors thank the reviewers for their valuable comments and suggestions,
which improved the technical content and the presentation of the paper.
Conflicts of Interest: The authors declare no conflicts of interest.
References
1. Bartocci, P.; Zampilli, M.; Bidini, G.; Fantozzi, F. Hydrogen rich gas production through steam gasification of
charcoal pellet. Appl. Therm. Eng. 2018, 132, 817–823. [CrossRef]
2. Hawkes, F.R.; Dinsdale, R.; Hawkes, D.L.; Hussy, I. Sustainable fermentative hydrogen production:
Challenges for process optimisation. Int. J. Hydrog. Energy 2002, 27, 11–12. [CrossRef]
3. Nikolaidis, P.; Poullikkas, A. A complarative overview of hydrogen production processes. Renew. Sustain.
Energy Rev. 2016, 67, 597–611. [CrossRef]
4. Lozano-Castello´a, D.; Alcaniz-Monge, J.; de la Casa-Lillo, M.A.; Cazorla-Amoro´s, D.; Linares-Solano, A.
Advances in the study of methane storage in porous carboneous materials. Fuel 2002, 81, 1777–1803.
[CrossRef]
5. Ou, X.M.; Zhang, X.L.; Zhang, X.; Zhang, Q. Life cycle GHG of NG-based fuel and electric vehicle in China.
Energies 2013, 6, 2644–2662. [CrossRef]
6. Sapag, K.; Vallone, A.; Blanco, A.G.; Solar, C. Adsorption of methane in porous materials as the basis
for the storage of natural gas. In Natural Gas; Intech Open: London, UK, 2010; Chapter 10; pp. 205–244,
ISBN 978-953-307-112-1.
7. Policicchio, A.; Filosa, R.; Abate, S.; Desiderio, G.; Colavita, E. Activated carbon and metal organic framework
as adsorbent for low-pressure methane storage application: an overview. J. Porous Mater. 2016, 24, 905–922.
[CrossRef]
8. Moreno-Pirajan, J.C.; Bastidas-Barrance, M.J.; Giraldo, L. Preparation of activated carbons for storage of
methane and its study by adsorption calorimetry. J. Therm. Anal. Calorim. 2017, 131, 259–271. [CrossRef]
9. Choi, P.-S.; Jeong, J.-M.; Choi, Y.-K.; Kim, M.-S.; Shin, G.-J.; Park, S.-J. A review: Methane capture by
nanoporous carbon materials for automobiles. Carbon Lett. 2016, 17, 18–28. [CrossRef]
10. He, Y.B.; Zhou, W.; Qian, G.D.; Chen, B.L. Methane storage in metal-organic frameworks. Chem. Soc. Rev.
2014, 43, 5657–5678. [CrossRef] [PubMed]
11. Alhasan, S.; Carriveau, R.; Ting, D.S.K. A review of adsorbed natural gas storage technologies. Int. J.
Environ. Stud. 2016, 73, 343–356. [CrossRef]
12. Vasiliev, L.L.; Kanonchik, L.E.; Mishkinis, D.A.; Rabetsky, M.I. Adsorbed natural gas storage and
transportation vessels. Int. J. Therm. Sci. 2000, 39, 1047–1055. [CrossRef]
13. Benaddi, H.; Bandosz, T.J.; Jagiello, J.; Schwarz, J.A.; Rouzaud, J.N.; Legras, D.; Beguin, F.
Surface functionality and porosity of activated carbons obtained from chemical activation of wood. Carbon
2000, 38, 669–674. [CrossRef]
14. Ros, A.; Lillo-Rodenas, M.A.; Fuente, E.; Montes-Moran, M.A.; Martin, M.J.; Linares-Solano, A. High surface
area materials prepared from sewage sludge-based precursors. Chemosphere 2006, 65, 132–140. [CrossRef]
[PubMed]
15. Srinivas, G.; Burres, J.; Yildirim, T. Graphene oxide derived carbons (GODCs): Synthesis and gas adsorption
properties. Energy Environ. Sci. 2012, 5, 6453–6459. [CrossRef]
16. Makal, T.A.; Li, J.-R.; Lu, W.; Zhou, H.-C. Methane storage in advanced porous materials. Chem. Soc. Rev.
2012, 41, 7761–7779. [CrossRef] [PubMed]
17. Yang, K.; Zhu, L.; Yang, J.; Lin, D. Adsorption and correlations of selected aromatic compounds on a
KOH-activated carbon with large surface area. Sci. Total Environ. 2018, 618, 1677–1684. [CrossRef] [PubMed]
18. Chen, Y.; Liu, C.; Li, F.; Cheng, H.-M. Pore structures of multi-walled carbon nanotubes activated by air,
CO2 and KOH. J. Porous Mater. 2006, 13, 141–146. [CrossRef]
19. Virla, L.D.; Montes, V.; Wu, J.; Ketep, S.F.; Hill, J.M. Synthesis of porous carbon from petroleum coke using
steam, potassium and sodium: Combining treatments to create mesoporosity. Microporous Mesoporous Mater.
2016, 234, 239–246. [CrossRef]Appl. Sci. 2018, 8, 1596 10 of 10
20. Lu, C.L.; Xu, S.P.; Liu, C.H. The role of K2 CO3 during the chemical activation of petroleum coke with KOH.
J. Anal. Appl. Pyrolysis 2010, 87, 282–287. [CrossRef]
21. Patil, K.H.; Sahoo, S. Charge characteristic of adsorbed natural gas storage system based on MAXSORIII.
J. Nat. Gas Sci. Eng. 2017, 52, 267–282. [CrossRef]
22. Romanos, J.; Beckner, M.; Rash, T.; Firlej, L.; Kuchta, B.; Yu, P.; Suppes, G.; Wexler, C.; Pfeifer, P.
Nanospace engineering of KOH activated carbon. Nanotechnology 2012, 23, 015401. [CrossRef] [PubMed]
23. Hui, T.S.; Zaini, M.A.A. Potassium hydroxide activation of activated carbon: A commentary. Carbon Lett.
2015, 16, 275–280. [CrossRef]
24. Mota, J.P.B.; Rodrigues, A.E.; Saatdjian, E.; Tondeur, D. Dynamics of natural gas adsorption storage systems
employing activated carbon. Carbon 1997, 35, 1259–1270. [CrossRef]
25. Chang, K.J.; Talu, O. Behaviour and performance of adsorptive natural gas storage cylinders during discharge.
Appl. Therm. Eng. 1996, 16, 359–374. [CrossRef]
26. El-Sharkawy, I.I.; Mansour, M.H.; Awad, M.M.; El-Ashry, R. Investigation of Natural Gas Storage through
Activated Carbon. J. Chem. Eng. Data 2016, 11, 258–274. [CrossRef]
27. Ybyraiymkul, D.; Ng, K.C.; Kaltayev, A. Experimental and numerical study of effect of thermal management
on storage capacity of the adsorbed natural gas vessel. Appl. Therm. Eng. 2017, 125, 523–531. [CrossRef]
28. Yue, G.W.; Wang, Z.F.; Tang, X.; Li, H.J.; Xie, C. Physical Simulation of Temperature Influence on
Methane Sorption and Kinetics in Coal (II): Temperature Evolvement during Methane Adsorption in Coal
Measurement and Modeling. Energy Fuels 2015, 29, 6355–6362. [CrossRef]
29. Li, H.; Wang, K.H.; Sun, Y.J.; Lollar, C.T.; Li, J.; Zhou, H.-C. Recent advances in gas storage and separation
using metal-organic frameworks. Mater. Today 2018, 21, 108–121. [CrossRef]
30. DeSantis, D.; Mason, J.A.; James, B.D.; Houchins, C.; Long, J.R.; Veenstra, M. Techno-economic analysis of
metal-organic frameworks for hydrogen and natural gas storage. Energy Fuels 2017, 31, 2024–2032. [CrossRef]
31. Lee, G.B.; Jung, H.S.; Hong, B.U.; Kim, S.H.; Choi, S.S. Optimization of washing process for the recycling
of potassium in the manufacturing of activated carbon. J. Korean Org. Resour. Recyc. Assoc. 2017, 25, 63–71,
(Korean with English abstract).
32. Jian, A.; Balasubramanian, R.; Srinivasan, M.P. Hydrothermal conversion of biomass waste to activated
carbon with high porosity: A review. Chem. Eng. J. 2016, 283, 789–805. [CrossRef]
33. Molina-Sabio, M.; Rodriguez-Reinoso, F. Role of chemical activation in the development of carbon porosity.
Colloid Surf. A 2004, 241, 15–25. [CrossRef]
34. Yang, S.L. Natual gas physical properties under high pressure. In Fundamental of Petrophysics, 2nd ed.;
Springer: Berlin, Germany, 2017; pp. 34–35, ISBN 978-3-662-55028-1.
35. Travis, W.; Gadipelli, S.; Guo, Z.X. Superior CO2 adsorption from waste coffee ground derived carbons.
RSC Adv. 2015, 5, 29558–29562. [CrossRef]
36. Judd, R.W.; Gladding, D.T.M.; Hodrien, R.C.; Bates, D.R.; Ingram, J.P.; Allen, M. The Use of a Natural Gas
Technology for Large Scale Storage. 1992; pp. 575–579. Available online: http://web.anl.gov/PCS/acsfuel/
preprint%20archive/Files/43_3_BOSTON_08-98_0575.pdf (accessed on 1 July 2018).
37. Kumar, K.V.; Preuss, K.; Titirici, M.-M.; Rodríguez-Reinoso, F. Nanoporous Materials for the Onboard Storage
of Natural Gas. Chem. Rev. 2017, 117, 1796–1825. [CrossRef] [PubMed]
38. Zakaria, Z.; George, T. The performance of commercial activated carbon absorbent for adsorbed natural gas
storage. Int. J. Recent Res. Appl. Stud. 2011, 9, 225–230.
© 2018 by the authors. Licensee MDPI, Basel, Switzerland. This article is an open access
article distributed under the terms and conditions of the Creative Commons Attribution
(CC BY) license (http://creativecommons.org/licenses/by/4.0/).You can also read