Modeling Based Investigation of Ultrafine SAPO-34 Core-shell Adsorbent in Cyclic Adsorption Process for Purification of Natural Gas from CO2
←
→
Page content transcription
If your browser does not render page correctly, please read the page content below
Avestia Publishing 90
International Journal of Theoretical and Applied Nanotechnology
Volume 1, Issue 1, Year 2012
Journal ISSN: 1929 - 1248
Article ID: 014, DOI: 10.11159/ijtan.2012.014
Modeling Based Investigation of Ultrafine SAPO-34
Core-shell Adsorbent in Cyclic Adsorption Process for
Purification of Natural Gas from CO2
Saeed Mahzoon, Shohreh Fatemi, S. Jalal Hashemi
School of Chemical engineering, College of Engineering,
University of Tehran, Enghlab Ave., Tehran, Iran
saeed_mahzoon@alumni.ut.ac.ir; shfatemi@ut.ac.ir; jhahemi@ut.ac.ir
Abstract- Core-shell nano-adsorbents are a novel class of © Copyright 2012 Authors - This is an Open Access article
materials where a solid inert material and a selective ultrafine published under the Creative Commons Attribution
layer are housed in a single particle. In this work, the dynamic License terms (http://creativecommons.org/licenses/by/2.0).
adsorption of CH4- CO2 mixture was modelled and studied in Unrestricted use, distribution, and reproduction in any medium
the packed bed of conventional and core-shell adsorbents made are permitted, provided the original work is properly cited.
from SAPO-34, comparatively. The dynamic adsorption model
with a packed bed of SAPO-34 fine layer on the inert mullite
particles revealed great potential of this kind of adsorbents in 1. Introduction
increasing the efficiency of the adsorption processes. It was Because of the undesirable effects of CO2 in gaseous
observed that core-shell adsorbent affected on both shape of mixtures, separation of carbon dioxide from methane is an
mass transfer zone and breakthrough time because of important technical challenge in economic and
decreasing the intraparticle resistance. It is also observed using environmental affairs. CO2 is present in atmosphere, natural
core-shell adsorbent reduces the useless bed length at the gas and by-products of industrial processes. The presence of
breakthrough time by 22%. The dynamic model was CO2 decreases the energy content of natural gas and because
implemented to a four- step cyclic adsorption process of of its acidic property in the presence of water, CO2 causes
pressure swing adsorption for purification of methane from a corrosion in storage and transportation systems. Therefore,
mixture of CO2 and CH4 with the so-called core-shell adsorbent according to the increasing trend in consumption of natural
and the results of methane recovery and its purity was gas, containing CH4 as the major component, removal of CO2
compared with the PSA model using SAPO-34 particles. It was has a vital role in the industries dealing with natural gas
concluded that core-shell adsorbents in PSA process increases processing (Baker, 2002).
both the purity and recovery of methane by 4% and 17% For the separation of CO2 from natural gas, several
respectively, compared to the particles of SAPO-34. technologies, such as absorption, cryogenic distillation,
membrane separation, and adsorption, have been used.
Keywords: Core-shell Nano-Adsorbent, Dynamic Adsorption Among several technologies, adsorption-based methods are
Model, Cyclic Adsorption Process, Pressure Swing Adsorption promising because of their simple and easy control, low
operating and capital investment costs, and superior energy
efficiency (Bae et al., 2008).
Corresponding author: Tel.: + 98 21 61112229; Fax: + 98 21 66967784.
E-mail: shfatemi@ut.ac.ir (S. Fatemi).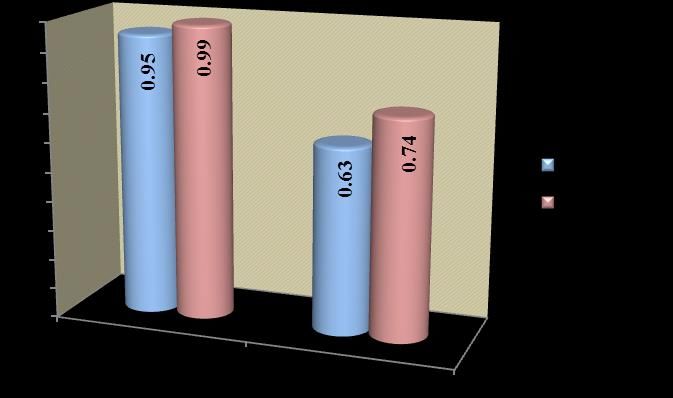
91

      Gas separation based on adsorption has been well                 Adsorption process is an economic and effective method
developed, in which the selection of a sound adsorbent is the     with wide usage in separation of gaseous mixtures. As a
key for specific separation. Although materials for gas           consequence of this applicative interest, a great amount of
adsorptive separation have been established and a diverse         work has been devoted to the modeling of these processes
range of useful sorbents are available for CO2 separation,        such as Siahpoosh et al. (2009) and Zheng et al. (2010). The
there is still plenty of room to optimize the performance of      dynamic mathematical models are required to simulate the
these materials and investigate a wider range of new              gas adsorption processes, mainly to study the behavior of the
sorbents (Li Jian et al., 2011). A variety of solid physical      new adsorbents during adsorption-desorption cycles and
adsorbents have been considered for CO2 capture including         optimization purposes. Proper modeling of adsorption units
microporous and mesoporous materials (carbon-based                requires good understanding of the simultaneous mass,
sorbents such as activated carbon and carbon molecular            momentum and heat transfer which occur in the adsorption
sieves, zeolites, and chemically modified mesoporous              bed. Modeling of these phenomena needs the simultaneous
materials), metal oxides, and hydrotalcite-like compounds,        solution of partial differential equations coupled with
amongst others (D’Alessandro et al., 2010). Recently, silico-     algebraic equations. Analytical solutions of the mathematical
alumino-phosphates have been recognized as a new family of        model are only available when approximations are used;
zeolitic-like materials that have potential applications in       otherwise, numerical solutions should be employed.
separations, gas storage, and catalysis (Ashraf et al., 2011).         Lots of works are done in modeling of dynamic gas
      Silicoaluminophosphates (SAPO) called zeo-type              adsorption in the packed columns with conventional
molecular sieves, are from ALPOs categories and have similar      adsorbents rather than core-shell ones. Li and Xiu (2004)
structure to zeolites except than substitution of Si instead of   derive analytical solutions to predict breakthrough and
Al in their cages. SAPO molecular sieves have excellent           elution curves for fixed-bed columns packed with inert core
efficiency in catalytic and separation processes such as          adsorbents regarding linear adsorption isotherm where the
adsorption and membrane processes. The kinetic diameter of        axial dispersion, mass transfer and intraparticle diffusion are
the gas component is the key parameter in its ability to          considered. Shams (2001) modeled the transient behavior of
diffusion into the pores of the adsorbents. Within many types     adsorption/desorption from a fixed-bed packed with thin-
of SAPOs, SAPO-34 with a three-dimensional structure and          film-coated spherical particles/hollow spheres when axial
pore diameter of 0.38 nm is one of the best candidates for        dispersion and external mass transfer resistance are
selective adsorption of CO2, with 0.33 nm kinetic diameter,       negligible.
from CH4, with 0.38 nm diameter (Ashraf et al., 2010).                 In this research, the mathematical modeling of the
      Now, various types of column packing are available and      packed bed with core-shell zeolitic particles that have been
one of the new packing materials used is made of core-shell       recently prepared (Ashraf Talesh et al., 2011) is modeled for
particles. These particles are made of a non-selective solid      separation of CO2 from natural gas. The assumptions of the
core surrounded by a porous selective thin layer as the shell     model are axial dispersion bed and variable velocity of gas,
(Kostka et al., 2011). Horváth and Lipsky suggested the use of    with macropore diffusion resistance with nonlinear
core-shell particles instead of fully porous particles as         equilibrium model of binary gas component at the shell side
packing materials for chromatographic columns and                 of the particle, with no adsorption capacity at the core side,
demonstrated the value of the concept by reporting                and non-isothermal conditions. Furthermore, a comparison
important analytical results in the ion-exchange analysis         between the breakthrough curves, purity and recovery
and/or the purification of nucleosides (Guiochon and Gritti,      derived by model from core-shell adsorbents would be taken
2011). Ever after, the experimental and theoretical analysis      place with conventional one to figure out efficiency of the
of the efficiency of chromatographic columns packed with          core-shell particles in improvement of CO2 separation from
core-shell particles were discussed in literatures such as        natural gas.
Kostka et al. (2011) and Gritti et al. (2011). Guiochon and
Gritti (2011) reviewed the origin, purpose, development and       2. Mathematical Modeling
properties of columns packed with core-shell particles to         2. 1. Simulation of the Fixed Bed Adsorption
explore their perspectives.                                             In this model we consider an adsorption column packed
      The advantage of inert core adsorbents is increasing        with conventional or core-shell particles. The model applied
density by the incorporation of heavier inert core for stable     to describe the fixed-bed dynamics is derived from the mass,
expansion at high flow rate in expanded bed. These types of       energy and momentum balances, including the following
core-shell adsorbents have been recently used in expanded         assumptions:
bed to capture bio-macromolecules directly from crude
particle-containing feedstock (Jahanshahi et al., 2002).              i. The gas phase behaves as an ideal gas mixture.
Recently, Ashraf Talesh et al. (2011) have reported                  ii. The flow pattern is described with the axially
fabrication of a kind of core-shell adsorbent for CO2                   dispersed plug flow model.
separation from natural gas.                                        iii. Total concentration does not vary verses the time.
92
iv. The internal mass transfer rates are assumed to be Where C p ,i is the pore concentration of component i, and
governed by multi-component molecular diffusion qi is the solid concentration of component i which is in
through macropores.
v. Radial concentration and temperature gradients are equilibrium with pore concentration, i.e. qi f (Cp ,i ,Tp ) , Dp ,i
negligible. is effective pore diffusivity of component i and r is the radial
vi. The particles are spherical and they are packed distance of the adsorbent.
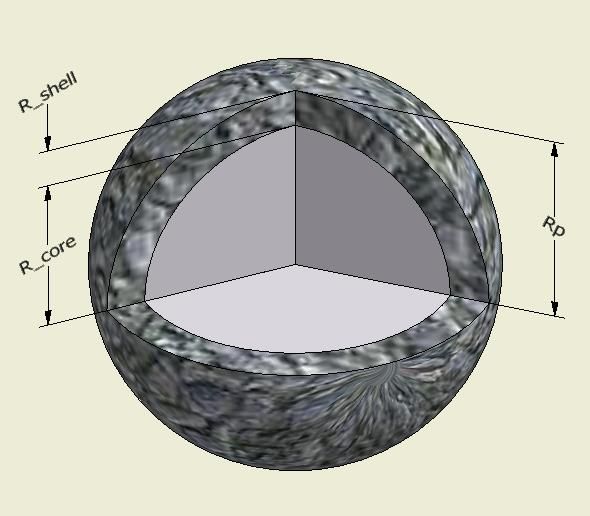
uniformly into the fixed bed. Rc is the radius of inert core, and Rp is the total radius
vii. The core-shell adsorbent consists of a core of uniform of the adsorbent, as illustrated in Fig. (2); for conventional
thickness on the spherical inert particle adsorbents, Rc is equal to zero.
viii. The bed wall temperature is considered constant.
Based on the above assumptions, the fixed-bed model is
described by the equations given below. The transient
material balance for component i of the gas mixture over a
differential cylindrical control volume in the adsorption
column, like as Fig. (1) yields:
Ci 2C (Ci u) 1 (1)
Dax 2i Ni
t z z
This equation was used to find the distribution of gas
composition C i along the bed length, where where Dax is the
axial dispersion coefficient, u is the interstitial velocity, is
the bed void fraction, z is the axial distance from column
entrance and Ni is the source/sink term of component i Fig. 2. Core-shell adsorbent.
caused by adsorption/desorption. Boundary conditions of the equation (3) are:
C p ,i
r Rc : 0 (4)
r
C p ,i
r Rp : Dp ,i K fi (Ci C p ,i ) (5)
r
Ni which appears in equations (1) - (2) was substituted
Fig. 1. Control volume of the adsorption column. by following equation:
The overall mass balance for the bulk gas is given by Eq. Rp3 Rc3 qi C p ,i (6)
(2) Ni ( )( s (1 p ) p )
R3
p t t
C (Cu) 1 m (2)
t
z
N
i 1 i Rp3 Rc3
s is the density of active adsorbent, ( ) is the
Rp3
The following equation expresses the component fractional volume taken up by the shell, C p ,i and q i are the
material balance over a spherical control volume in the average macropore and solid concentration of component i.
adsorbent particles: Because adsorption is an exothermic process, heat is
generated and hence the adsorbent particle temperature
C p ,i qi 2C p ,i 2 C p ,i varies, then the generated heat is transferred to the gas phase
p (1 p ) p Dp ,i ( 2 ) Rc r Rp (3) by convection. The following equations were obtained by
t t r r r
writing the differential
( energy balance in the bed:93
Tg Tg 2Tg constants qm , b and n are derived dependent to the
cv , g C c p ,guC
t z z 2 temperature and shown in Table (1).
4hw
hp ap (1 )(Tg Tp ) (Tg Tw ) (7) 2. 2. Simulation of Cyclic Adsorption
dw The behavior of the individual steps within the cycle is
simulated by varying the boundary conditions of the bed.
Tp The boundary conditions describing the four-step cycles are
(1 p ) s cs hp ap (Tg Tp ) introduced in Table 2. The four steps which makes up each
t cycle are: adsorption, depressurization, regeneration, and
m
pressurization.
N (H
i 1
i ads ,i ) (8)
Table 1. Isotherm parameters
The above equations were used to find distribution of
pellets and gas phase temperatures (Tp ,Tg ) along the bed. B D F
q A [mmol. gr ] 1
b C exp( )[bar 1 ] nE
where Cv , g is the molar specific heat at constant volume for
m
T T T
the gas phase, C p , g is the molar specific heat at constant
A B C D
pressure for the gas phase, is the thermal axial dispersion [mmol. gr 1 ] [mmol. gr 1 .K ] [bar 1 ] [bar 1 .K ] E F
coefficient, hp is the convective heat transfer coefficient
between the gas and pellets, hw is the convective heat
transfer coefficient between the gas and column wall, C s is CO2 -15.12 5975 0.088 608 -10.58 3523
the solid specific heat, Hads ,i is the adsorption enthalpy for
6.314
the component i, at zero coverage, dw is the bed diameter, CH4 0.8647 704.2
e-5
2155 -0.0248 324.2
and Tw is the wall temperature which kept constant.
Ergun's law is used to estimate locally the bed pressure
drop: Table 2. Boundary conditions for four steps in an adsorption cycle.
P 150(1 )2
9.87 106 [ u Boundary
z dp2 2 Z=0 Z=L
(1 ) 2 yi
Dax ,i z u( yi yi ,F * )
1.75 u ] (9) yi
dp
T z 0
Adsorption z u(T TF )
T 0
u uF z
and are viscosity and density of gas phase, p pH
respectively. yi yi
The extended Langmuir-Freundlich isotherm for multi- z 0 z 0
component adsorption was used to find equilibrium T T
Depressurization 0 0
concentrations: z z
p(t ) pL ( pH pL )exp( k pres t ) u 0
qm ,i (bi Pi )1/ni yi
qi* m Dax ,i z u( yi yi ,F )
yi
1 (b j Pj )
1/n j 0
(10)
z T
Regeneration z u(T TF )
j 1 T 0
z
u uF
p pL
The adsorption equilibrium data of pure carbon dioxide yi yi
and pure methane on conventional and core-shell SAPO-34 at Dax ,i z u( yi yi ,F ) z 0
different temperatures (Ashraf Talesh et al. 2011) were used Pressurization
T
u(T TF )
T
0
to drive parameters of isotherm equations. The parameters of z z
p(t ) pH ( pL pH )exp( kpres t ) u 0
single adsorption isotherm were implemented in the
extended isotherm for the binary adsorption equilibrium. The *: subscript F indicates the inlet flow in each step94
2.3. Model Parameters between gas phase in the bed and pellets is evaluated with
The model parameter evaluation is an important aspect the following correlations (Dantas et al, 2011):
included in the basic information required for modelling the
adsorption process. The transport parameter values required Nup 2 1.1Re0.6 Pr1/3 (13)
in the mathematical model are summarized in this section.
Molecular diffusivities were calculated by Chapman-Enskog
Nup k g (14)
equation (Reid et al., 2001). An average pore diameter of 0.38 hp
nm was considered for SAPO-34 (Hong et al., 2007) and dp
employed for calculating Knudsun diffusivities. Effective pore
diffusivities were calculated using Bosanquet relationship
(Yang, 1987). The film mass transfer coefficient was
Nup is the particle Nusselt number. The transport
evaluated with the following correlation (Delgado et al., parameter values required in the mathematical model are
2006): summarized in Table (3), based on the feed condition.
us 0.765 0.365 (11) Table 3. Transport parameter values for feed condition.
Kf ( )
Sc 2 3 Re0.82 Re0.386 (m2/s) 0.3
hp (W/m2.K) 24
Re is Reynolds number on the base of particle diameter, hw (W/m2.K) 12
Cp,g (J/mol.K) 36
calculated with the superficial velocity and Sc is the Schmidt CO2 CH4
number of the gas. The axial dispersion coefficient was Dax (m2/s) 1.3E-5 1.3E-5
estimated by the correlation of Wakao et al. (1978). As low Dp (m2/s) 0.8E-7 1.1E-7
Reynolds numbers were used in this work (below 0.45), the Kf (m/s) 0.0053 0.0053
value of the stagnant contribution term taken for this
correlation has an important effect on the bed dynamics and 2.4. Numerical Method
we selected the value corresponding to an inert bed (0.23) for The foregoing models require the numerical solution of a
this parameter, which has previously been observed by other set of partial differential equations accompanied with
authors who have used this correlation for modelling the algebraic equations (overall and component mass balance
fixed-bed adsorption process in the gas phase using similar equations, heat balance and momentum balance equation).
Reynolds numbers (Delgado et al., 2006): The set of differential equations is solved using the method of
lines (Schiesser, 1991). In this method, all the spatial
Dm,i (12) derivatives are replaced by the finite difference method,
Dax ,i (0.23 0.5Re Sc ) whereas the time derivatives left intact. In fact, this is an
explicit time stepping finite difference algorithm in which the
time step determined automatically and adaptively by the
Where Dm ,i is molecular diffusivity of component i. The ODE solver of MATLAB programming. The ODE solver was
viscosity of each pure gas is estimated by the Lucas method, the ODE23tb that is proper for stiff systems which use crude
whereas the viscosity of the mixture is evaluated by the error tolerances (Kiusalaas, 2005). This solver is an Implicit
Reichenberg method (Reid et al., 2001). Rung-Kutta method with a first stage that is a trapezoidal rule
Like the mass axial dispersion coefficient, the one step and second stage that is a backward differentiation
corresponding to thermal axial dispersion was also estimated formula of second order.
with the correlation of Wakao et al. (1978) for low Reynolds
numbers, assuming a solid thermal conductivity/gas thermal 3. Verification of the Mathematical Model
conductivity ratio of 10, resulting in / k g 10 0.5RePr In order to validate the developed model, the calculated
(Delgado et al., 2006), where Pr is the Prandtl number and k g results were compared with the multi-component
experimental data of Ashraf Talesh et al. (2011). In their
is gas thermal conductivity which is calculated by Stiel and work, nano-sized core−shell particles containing an inert
Thodes equation (Reid et al., 2001). The enthalpy of ceramic core and a thin perm-selective zeotype shell ware
adsorption was replaced by 24 and 16 KJ mol for CO2 and studied as a core-shell adsorbent for selective separation of
CH4, respectively (Li et al., 2004), heat capacities of the gases CO2 from methane in natural gas (10% CO2, 90% CH4); and
are calculated according to the Reid et al., (2001). The value their performance were compared with conventional one.
of the wall Nusselt number hw dw k g was set to 5 (Delgado et The characteristics of the adsorbents are shown in Table (4).
al., 2006), and finally the film heat transfer coefficient Adsorption experiments were conducted at 298 K and 1 atm95
pressure with feed flow rate adjusted to 10 (NmL/min) 4. Result and Discussion
(Ashraf Talesh et al., 2011). The developed model can be used as a proper tool for
simulation and sensitivity analysis of the adsorption beds
Table. 4. characteristics of the adsorbents. with core-shell adsorbents. The results of the developed
model are discussed in the following sections.
Adsorbent type conventional core-shell
Average particle diameter
3 3 4.1. Effect of Core-Shell Adsorbent on the Bed
(mm)
Core diameter (mm) - 2.86 Performance
Shell thickness (mm) 1.5 0.07 The shape and size of the core-shell adsorbent were the
SAPO-34 solid density (kg/m3) 2260 same as those of the conventional particles except that it
Average SAPO-34 porosity 0.55 consists of two parts, the inert core and the active layer
coated on the inert part. The effect of core-shell adsorbent on
Fig. (3) shows the breakthrough curves of CO2 and CH4 the breakthrough curve of CO2 is presented in fig. (4). Using
for conventional adsorbents. Similarly Fig. (4) shows the core-shell adsorbent, influenced both the breakthrough time
comparison of calculated results with the experimental and shape of the breakthrough curve.
break-through curves of CO2 at the outlet of the bed for both This figure shows that late breakthrough time is achieved
conventional and core- shell adsorbents. As it can be seen by using core-shell adsorbent, also the sharper S shape would
from these figures, there is a good agreement between the be appeared using core-shell adsorbent. By comparison CO2
calculated results and the experimental data. (The coefficient breakthrough times of conventional and core-shell
of determinations (R2) are 0.998, 0.991 for CO2 and CH4 adsorbents, it could be observed 1.3 times improvement of
breakthrough curves, respectively, on conventional CO2 breakthrough time using core-shell adsorbent. Usually
adsorbent, and it is 0.979 for CO2 breakthrough curve on the breakthrough curves reflect the shape of the mass
core-shell one). transfer zone (MTZ). As mentioned core-shell adsorbent
makes the curve sharper therefore it is concluded that a
shorter MTZ exists inside the bed. It is concluded that the
1
effects of core-shell adsorbent on the breakthrough curve
discussed above, is dependent to the decrease in intraparticle
0.8 diffusion resistance.
Decreasing of useless bed length at breakthrough time is
another advantage of using core-shell adsorbents. According
Mole Fraction
0.6 CO2 (Exp.)
CO2 (Model) to following equation and fig. (5) which describes the loading
CH4 (Exp.)
0.4 CH4 (Model) of the bed at breakthrough time, useless bed length
percentages using conventional and core-shell adsorbents are
obtained 51.1% and 28.3% respectively.
0.2
useless bed length % 100 *
0
0 1000 2000 3000 4000 5000 column average loading @t b (15)
Time ( s ) (1 )
Fig. 3. Breakthrough curve of components for conventional max imum loading of adsorbent
adsorbent.
0.1
It is observed that in using conventional adsorbent,
approximately half of the adsorbent bed would be useless.
While using core-shell adsorbent, the useless bed length at
0.08
the breakthrough time is reduced by 22%.
Mole Fraction
0.06
0.04
Conventional (Exp.)
0.02 Conventional (Model)
Core-shell (Exp.)
Core-shell (Model)
0
0 1000 2000 3000 4000 5000
time ( s )
Fig. 4. Breakthrough curve of CO2.96
In regeneration step, the bed is purged with the recycled
0.5
product to regenerate the adsorbent. In the last step
(pressurization) the bed is pressurized up to high pressure
0.4
with the recycled product and the cycle is allowed to repeat.
Loading ( mmol . gr -1 )
0.3
The performance of a cyclic process is commonly
evaluated according to basic parameters of product purity
0.2
and product recovery defined, respectively, by:
Conventional
Core-shell t feed
0.1
purity
C u
0 CH4 z L dt
(16)
m t feed
0
0 0.2 0.4 0.6 0.8 1 C u
i 1
0 i z L dt
Dimensionless axial distance
Fig. 5. Loading of the CO2 in bed versus dimensionless axial
distance at breakthrough time t feed t purge t press
re cov ery
0
CCH4 u zL dt
0
CCH4 u zL dt
0
CCH4 u z0 dt
t feed (17)
0.5
0
CCH4 u z0 dt
0.4
The values obtained for these simulations at cyclic
Loading ( mmol . gr -1 )
Conventional
0.3
Core-shell
steady state are shown in Fig. (7). It can be seen that using
core-shell nano-adsorbent affected both purity and recovery.
0.2
Core-shell nano-adsorbent increased both purity and
recovery by over 4% and 17% respectively, compared with
0.1
conventional one. It is worth noting that the simultaneous
increasing in purity and recovery is the point of interest in
0
applying these adsorbents which is because of positive effects
0 0.5 1 1.5 2 of core-shell adsorbents on both adsorption and desorption
Time ( s ) 4
Fig. 5. Desorption curves of CO2
x 10
stages compared with conventional adsorbent as discussed in
section 4.1.
Fig. (6) compares desorption curves of conventional and
core-shell adsorbents using the model. As shown, the
regeneration time of the conventional adsorbent is too long.
Analysing the above mentioned figure clarify that the core-
shell adsorbent, that means the lower thickness of the active
shell, the shorter the regeneration time of the bed. Based on
this finding, we can conclude that using inert core adsorbent
is an effective way to reduce the regeneration duration that in
turn causes a higher productivity of the adsorption column.
4.2. Effect of Core-Shell Adsorbent on the Cyclic
Performance
In this section, the simulation results obtained for the
PSA process with respect to cyclic performance are presented Fig. 7. Purity and recovery of cyclic adsorption
comparatively in conventional and core- shell nano-
adsorbents. As mentioned before, this PSA system undergoes 5. Conclusion
a simple four-step cycle; the four steps making up each cycle To enhance the separation efficiency of the light gaseous
are: (1) adsorption, (2) depressurization, (3) regeneration, compounds by adsorption, configuration of the active parts of
and (4) pressurization. During the adsorption step, the feed the adsorbent is a critical object; therefore proper designing
mixture (10% CO2, 90% CH4) flows into the bed at high the adsorbent particles improves the efficiency of the
pressure (PH=10 atm), carbon dioxide continues to adsorb separation and can reduce useless part of the adsorption bed.
preferentially to adsorbent, and purified methane is released In this research, it was observed that using a thin layer of the
through the bed as the product. In depressurization step the active adsorbent on an inert core enhanced the efficiency of
pressure is reduced to low pressure (PL=1 atm) and the CO2-CH4 separation.
adsorbates begin to desorb from the surface of the adsorbent.97
We can conclude that designing and fabricating core- εp adsorbent porosity
shell adsorbents would be a good idea for the cyclic thermal axial dispersion coefficient,
λ
adsorption process to improve the efficiency of the light gases W/ m K
separation. μ bulk gas mixture viscosity, Kg/m s
ρ bulk gas mixture density, Kg/m3
Nomenclature ρs particle density, Kg/m3
C total gas phase concentration, mol/m3
gas phase concentration of component
Ci
i, mol/m3 References
particle average pore concentration of Ashraf Talesh, S. S., Fatemi, S., Davoodpour, M., Hashemi, S. J.,
C p ,i
component i, mol/m3 (2011), Preparation of core-shell SAPO-34 adsorbent on
pore concentration of component i, ceramic particles; improvement of CO2 separation from
Cp,i
mol/m3 natural gas, Separation Science and Technology, 46,
gas mixture molar specific heat at 1138–1143.
Cp,g
constant pressure, J/mol K Ashraf Talesh, S. S., Fatemi, S., Hashemi, S. J., Omrani, P.,
gas mixture molar specific heat at (2010), Adsorption Properties of Carbon Dioxide and
Cv,g
constant volume, J/mol K Methane by Synthesized Fine Particles of SAPO-34
particle specific heat at constant Molecular Sieve, Iran. J. Chem. Chem. Engineering 29, 41–
Cs
pressure (per mass unit), J/kg K 49.
Dax axial dispersion coefficient, m2/s Bae, Y. S., Mulfort, K. L., Frost, H., Ryan, P., Punnathanam, S.,
molecular diffusivity of component i, Broadbelt, L. J., Hupp, J. T., Snurr, R. Q., (2008) Separation
Dm,i
m2/s of CO2 from CH4 using mixed-ligand metal-organic
dp particle diameter, m frameworks. Langmuir 24, 8592–8598.
effective macropore diffusivity of Baker, R. W., (2002), Future in directions of membrane gas
Dp,i
component i, m2/s separation technology, Indian Engineering Chemical
dw bed diameter, m Research, 41, 1393–1411.
film heat transfer coefficient between the D’Alessandro, D. M., Smit, B., Long, J. R., (2010) Carbon
hw
gas and wall, J/s m2 K dioxide capture: prospects for new materials.
film heat transfer coefficient between the Angewandte Chemie International Edition 49, 6058–
hp
gas and particle, J/s m2 K 6082.
ΔHads,i heat of adsorption of component i, J/mol Dantas, T. L. P., Luna, F. M. T., Silva Jr., I. J., Torres, A. E. B., de
Kf film mass transfer coefficient, m/s Azevedo, D. C. S., Rodrigues, A. E., Moreira, R. F. P. M.,
kg gas thermal conductivity, W/m K (2011). Modeling of the fixed bed adsorption of carbon
depletion rate of component i from fluid , dioxide and a carbon dioxide-nitrogen mixture on zeolite
Ni
mol/m3 s 13X. Brazilian Journal of Chemical Engineering 28, 533–
P pressure, Pa 544
particle average solid concentration of Delgado, J. A., Uguina, M. A., Sotelo, J. L., (2006) Fixed-bed
qi
component i, mol/Kg adsorption of carbon dioxide–helium, nitrogen–helium
solid concentration of component i, and carbon dioxide–nitrogen mixtures onto silicalite
qi
mol/Kg pellets. Separation and Purification Technology 49, 91–
solid concentration in equilibrium with 100.
qi*
Cp,i, mol/Kg Gritti, F., Leonards, I., Shock, D., Stevenson, P., Shalikar, A.,
R particle radial position, m Guiochon, G. (2011), Performance of columns packed
Rc core radius, m with the new shell particles, Kinetex-C18, J. of Chromat.
Rp particle radius, m A, 1218, 1589–1603.
t time, s Guiochon, G., Gritti F. (2011), Shell particles, trials,
Tg bulk phase temperature, K tribulations and triumphs, J. of Chromat. A, 1218, 1915–
Tp solid temperature, K 1938.
Tw wall temperature, K Hong, M., Li, S., Falconer, J.L., Noble, R.D., (2007) Ion-
u interstitial velocity, m/s Exchanged SAPO-34 zeolite crystals and membranes.
yi mole fraction of component i Microporous Mesoporous Materials 106, 140–146.
z axial position, m Jahanshahi, M., Sun, Y., Santos, E., Pacek, E., Franco, T. T.,
Greek Nienow, A., Lyddiatt, A. (2002), Operational
letters intensification by direct product sequestration from
ε bed porosity cell disruptates-Application of a pellicular adsorbent in a98
mechanically integrated disruption-fluidized bed
adsorption process, Biotechnology and bioengineering
80, 201–212.
Kiusalaas, J., (2005) Numerical Methods in Engineering with
MATLAB. Cambridge University press.
Kostka, J., Gritti, F., Kaczmarski, K., Guiochon, G. (2011),
Modified equilibrium-dispersive model for the
interpretation of the efficiency of columns packed with
core shell particle, J. of Chromat. A., 1218, 5449–5455.
Li Jian, R., Ma, Y., McCarthy, C., M., Sculley, J., Yu, J., Jeong, H.K.,
Balbuena, P.B., Zhou, H.K., (2011). Carbon dioxide
capture-related gas adsorption and separation in metal-
organic frameworks. Coordination Chemistry Reviews
255, 1791–1823.
Li, P., Xiu, G., Rodrigues, A. E., (2004), Modeling breakthrough
and elution curves in fixed bed of inert core adsorbents:
analytical and approximate solutions, Chemical
Engineering Science 59, 3091–3103.
Li, S. G., Falconer, J. L, Noble, R. D., (2004) SAPO-34
membranes for CO2/CH4 separation. J. Membrane
Science, 241, 121–135.
Reid, R. C., Prausnitz, J. M., Poling, B. E., (2001) The properties
of gases and liquids, 5th ed., McGraw-Hill, New York.
Schiesser, W. E., (1991) The Numerical Method of Lines.
Academic Press, California, USA.
Shams, K. (2001), Sorption dynamics of a fixed-bed system of
thin-film-coated monodisperse spherical
particles/hollow spheres, Chemical Engineering Science
56, 5383–5390.
Siahpoosh, M., Fatemi, S., Vatani, A. (2009), Mathematical
modeling of single and multi-component adsorption fixed
beds to rigorously predict the mass transfer zone and
breakthrough curves, Iran. J. Chem. Chem. Engineering
28, 25–44.
Zheng, X., Liu, Y., Liu, W. (2010), Two-Dimensional modeling
of the transport phenomena in the adsorber during
pressure swing adsorption process, Indian Engineering
Chemical Research 49, 11814–11824.
Wakao, N., Kaguei, S., Nagai, H., (1978). Effective diffusion
coefficients for fluid species reacting with first order
kinetics in packed bed reactors and discussion on
evaluation of catalyst effectiveness factors. Chemical
Engineering Science 33, 183–187.
Yang, R.T., (1987). Gas separation by adsorption processes.
Butterworth’s, Boston.You can also read