J.P. Morgan 2020 Energy, Power &
Renewables Conference

June 16, 2020
←
→
Page content transcription
If your browser does not render page correctly, please read the page content below
J.P. Morgan 2020 Energy, Power & Renewables Conference June 16, 2020
Cautionary statements
    Forward-looking statements
    The information in this presentation includes “forward-looking statements” within the meaning of               Plans for the Permian Global Access Pipeline, Haynesville Global Access Pipeline and Delhi
    Section 27A of the Securities Act of 1933, as amended, and Section 21E of the Securities Exchange              Connector Pipeline projects discussed herein are in the early stages of development and numerous
    Act of 1934, as amended. All statements other than statements of historical fact are forward-looking           aspects of the projects, such as detailed engineering and permitting, have not commenced.
    statements. The words “anticipate,” “assume,” “believe,” “budget,” “estimate,” “expect,”                       Accordingly, the nature, timing, scope and benefits of those projects may vary significantly from our
    “forecast,” “initial,” “intend,” “may,” “model,” “plan,” “potential,” “project,” “should,” “will,”             current plans due to a wide variety of factors, including future changes to the proposals. Although
    “would,” and similar expressions are intended to identify forward-looking statements. The forward-             the Driftwood pipeline project is significantly more advanced in terms of engineering, permitting
    looking statements in this presentation relate to, among other things, future contracts and contract           and other factors, its construction, budget and timing are also subject to significant risks and
    terms, expected partners and customers, the parties’ ability to complete contemplated                          uncertainties.
    transactions (including, where applicable, to enter into definitive agreements related to those
    transactions), margins, returns and payback periods, future cash flows, production, delivery of LNG,           Projected future cash flows as set forth herein may differ from cash flows determined in
    liquefaction capacity additions, required infrastructure, future costs, prices, financial results, liquidity   accordance with GAAP.
    and financing, including equity funding and debt process, regulatory and permitting
    developments, construction and permitting of pipelines and other facilities, reaching FID, future              We may not be able to complete the anticipated transactions described in the presentation. FID is
    demand and supply affecting LNG and general energy markets and other aspects of our business                   subject to the completion of financing arrangements that may not be completed within the time
    and our prospects and those of other industry participants.                                                    frame expected or at all. Achieving FID will require substantial amounts of financing in addition to
                                                                                                                   that contemplated by the agreements between Tellurian and each of Total and Petronet LNG
    Our forward-looking statements are based on assumptions and analyses made by us in light of our                discussed in this presentation, and Tellurian believes that it may enter into discussions with potential
    experience and our perception of historical trends, current conditions, expected future                        sources of such financing and Total and Petronet LNG in order to achieve commercial terms
    developments, and other factors that we believe are appropriate under the circumstances. These                 acceptable to all parties. Accordingly, each of the final agreements may have terms that differ
    statements are subject to numerous known and unknown risks and uncertainties which may cause                   significantly from those described in the presentation.
    actual results to be materially different from any future results or performance expressed or implied
    by the forward-looking statements. These risks and uncertainties include those described in the “Risk          The financial information included on slides 3, 9, 12, 13, 15, 16, 19, 22 and 23 is meant for illustrative
    Factors” section of our Annual Report on Form 10-K for the fiscal year ended December 31, 2019,                purposes only and does not purport to show estimates of actual future financial performance. The
    and our other filings with the Securities and Exchange Commission, which are incorporated by                   information on those slides assumes the completion of certain acquisition, financing and other
    reference in this presentation. Many of the forward-looking statements in this presentation relate to          transactions. Such transactions may not be completed on the assumed terms or at all. Actual
    events or developments anticipated to occur numerous years in the future, which increases the                  commodity prices may vary materially from the commodity prices assumed for the purposes of the
    likelihood that actual results will differ materially from those indicated in such forward-looking             illustrative financial performance information.
    statements.
                                                                                                                   The forward-looking statements made in or in connection with this presentation speak only as of the
                                                                                                                   date hereof. Although we may from time to time voluntarily update our prior forward-looking
                                                                                                                   statements, we disclaim any commitment to do so except as required by securities laws.

2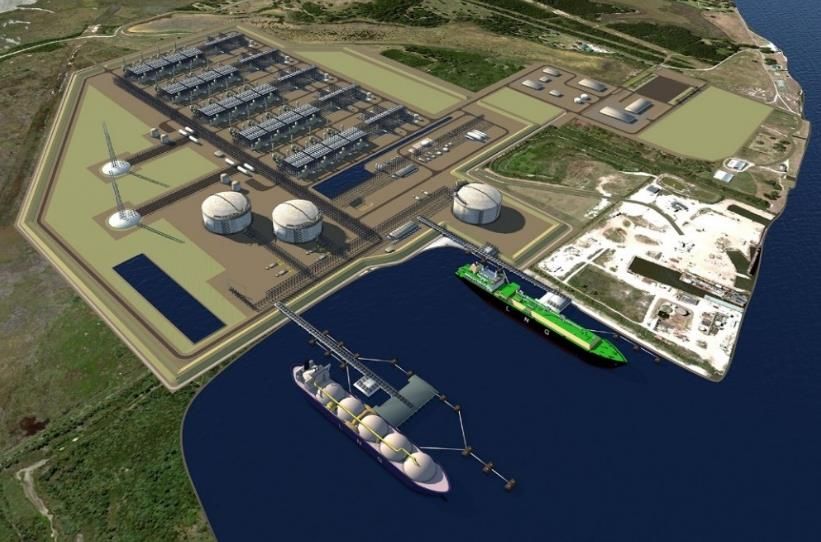
Tellurian value proposition (Nasdaq: TELL)
    Developing a global natural gas business around Driftwood LNG

        Our business

        ◼ Develop Driftwood LNG: a 27.6 mtpa LNG export terminal in Louisiana
        ◼ Backed by a visionary management team that has built ~18% of global LNG capacity
        ◼ LNG exports integrated with upstream production are resilient through the
          commodity cycle
        ◼ Deliver cleaner air, reduce carbon emissions & slow the pace of climate change

        Tellurian investment case
        ◼ ~$2 bn of FCF at full operations of Driftwood LNG
        ◼ ~$6 - $8 cash flow per share to TELL shareholders (1)
        ◼ Implied equity value of ~$15-20/share at FID (2)
    Notes:   (1) See assumptions discussed in note 1 on slide 13.
             (2) NPV of $6-8 cash flow per share at commercial operations in 2026 discounted at 15% for the 40-year life of the plant and assuming no terminal value.
    .

3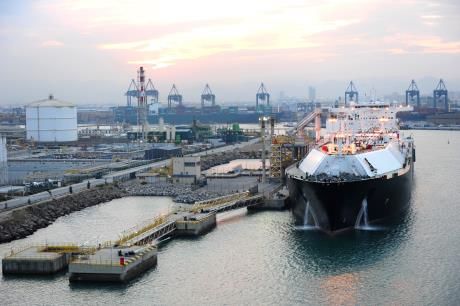
LNG market clears amid demand shock
    COVID-19 has created market turbulence but recent KPIs indicate resilience

                       What to watch for                                            KPI

    Global demand: LNG demand resumes growth trend                Chinese LNG demand is recovering –
    after COVID-19                                                up ~24% y-o-y

    Global supply: Project delays and cancellations               ~147 mtpa in announced FID delays,
    tighten supply/demand balance post-2020                       ~35% of the total market

    LNG pricing: Low global gas prices expected to be             2020 LNG trade growing faster than
    temporary as supply growth slows                              capacity additions

    U.S. gas supply: Ample U.S. gas inventory to supply           Over 50 years of U.S. gas production is
    global demand at sub-$3/mmBtu prices                          economic under $3/mmBtu

4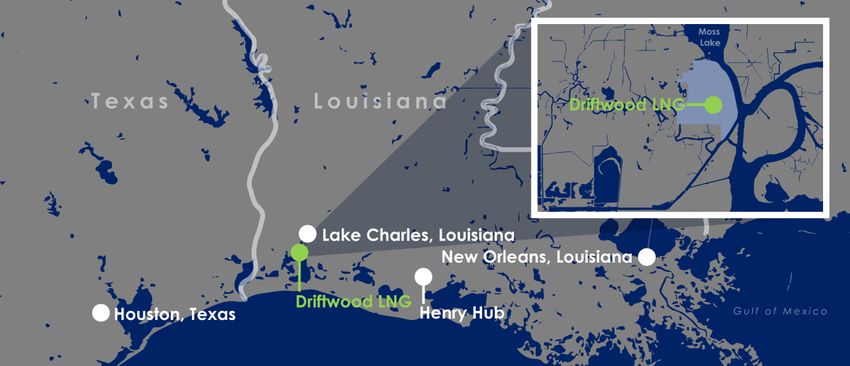
Bright spots emerge in China and Europe
    Chinese demand spiked 24% in May as lockdowns lifted and Europe is absorbing LNG for storage

    Chinese LNG imports                              European LNG imports
    million tonnes/month                             million tonnes/month
      12                                             12

      10                                             10                     2020E                  2019

        8                                     2019    8
                                                                                                   2018
        6                   2020E             2018
                                                      6
                                              2017                                                 2017
        4                                             4

        2                                             2

        0                                             0

    Source:   IHS Markit.

5
LNG trade growing faster than capacity
    Monthly global LNG trade and capacity                                                    LNG production capacity at year end
    million tonnes/month                                                                     Expected % increase over prior year end
                                                                                             million tonnes/month production capacity
      39                                                             2020E export capacity                                        1.3%
      37                                                                                                                          37.8
                                                                                      35.3                           2.8%
      35
                                                                                                                     37.3
                                               2020E LNG trade
      33

      31

      29                                       2019 LNG trade                                           36.3

      27
                                               May 2020: 0.1% increase vs May 2019
      25
                  Jan Feb Mar Apr May Jun                   Jul Aug Sep Oct Nov Dec
                                                                                                        2019         2020         2021

    Sources:   IHS CERA, Tellurian analysis.

6
Entering 5-year starvation; expect rising price
    Global liquefaction capacity additions (mtpa)
       ~30 mtpa capacity additions                                               ~146 mtpa capacity additions         ~53 mtpa capacity additions   Limited capacity additions(1)
             1.6% per annum                                                            8.3% per annum                      2.3% per annum                 0.8% per annum

                                                                                                                           Expected delays

                                                                                                          39
                                                                                                                                                    34
                                                                                  26      29      30
                                                                                                                 22
                                                                                                                                              18
        13                                                                                                            10          10    11
                                                      5              8
                        4                                                                                                    4                            1
                                     (0)                                                                                                                                --
                                                                                                                                                                (5)
                                                                                                                                                                             (14)

      2011 2012 2013 2014 2015 2016 2017 2018 2019 2020 2021 2022 2023 2024 2025 2026 2027 2028 2029 2030
      JKM annual average:
     $14.04         $15.12         $16.54         $13.85          $7.45          $5.73   $7.13   $9.74   $5.49
    Sources:   Wood Mackenzie, Tellurian analysis.
    Note:      (1) Capacity additions for projects that have reached FID only.

7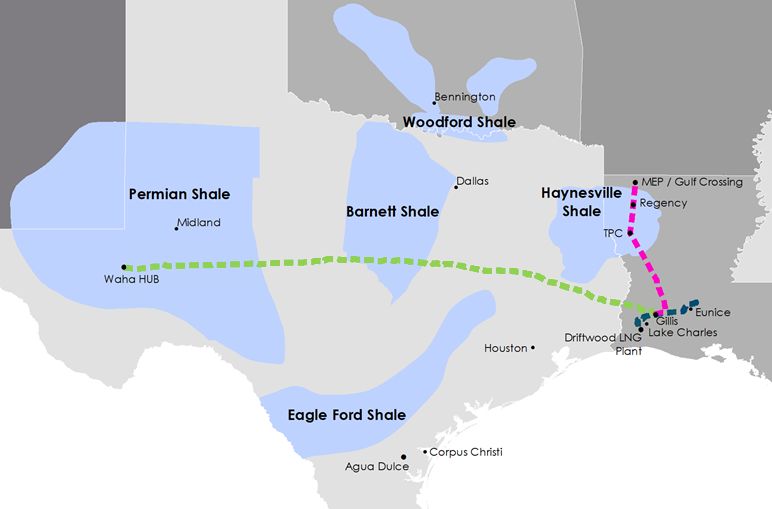
>100 mtpa additional construction needed
    Recent demand growth rates imply the world will have LNG capacity constraints by 2021
    mtpa                                                                                                                                                      Liquefaction capacity
                                                                                                                                                              required by 2025(1)
     900
     800                         9.3% p.a. growth rate                                                                                               8.0%(2)                          ~175 mtpa
     700
                                                                                                                                                     6.6%(3)
     600                                                                                                                                                                              ~130 mtpa
     500
     400
     300
     200                                                                                                                                                         Under construction(4)

     100                                                                                                                                                         In operation

          0
                    2015 2016 2017 2018 2019 2020 2021 2022 2023 2024 2025 2026 2027
    Sources:   Wood Mackenzie, Tellurian Research.                          (4) Assumes 112 mtpa of projects under construction coming online by 2025, including Portovaya, Petronas FLNG 2, Coral FLNG, Petronas
    Notes:     (1) Assumes 86.5% utilization rate.                              FLNG 2, Tortue LNG, LNG Canada, Calcasieu Pass, Mozambique LNG, Golden Pass LNG, Arctic LNG 2 and NLNG T7.
               (2) Assumes 8.0% annual demand growth rate from 2020-2025.
               (3) Assumes 6.6% annual demand growth rate from 2020-2025.

8
U.S. gas to remain competitive worldwide
    Almost 50 years' worth of natural gas resources are available for less than $3/mmBtu(1)

                                                                                                                                                               Associated
                                                                                                                                                                                 Dry gas
                                                                                                                                                                  gas
                                                                                                                                                                               resources,
                                                                                                                                                               resources,
                                                                                                                                                                                   Tcf
                 > 800 Tcf economic sub-$3                                                                                                                         Tcf

               breakeven from dry gas basins                                                                                       693
                                                                                                                             Appalachia

                                                                                                                                                     ▪ U.S. natural gas resources remain
                                                                                                                                                       plentiful and low-cost
                                                  114
                                             Anadarko
                                                                                                                                                     ▪ Basin optionality enables optimized
                                                                                                                                                       gas supply in all commodity price
                  547
                                                                                                                                                       environments
                Permian                                                          127
                                                                           Haynesville
                                                                                                                                                     ▪ Tellurian Haynesville upstream
                                                  53                                                                                                   hedge strategy validated by low
                                                Eagle                                                                                                  U.S. oil prices and drop in associated
                                                 Ford
                                                                                                                                                       gas production
    Sources:   RSEG, Pointlogic.
    Note:      (1) Includes both dry and associated gas production breakeven at less than $3/mmBtu assuming $60/bbl WTI price. All breakevens on a
                   half-cycle basis and PV10 breakeven. Based on assumption of 92 bcf/d production p.a.

9
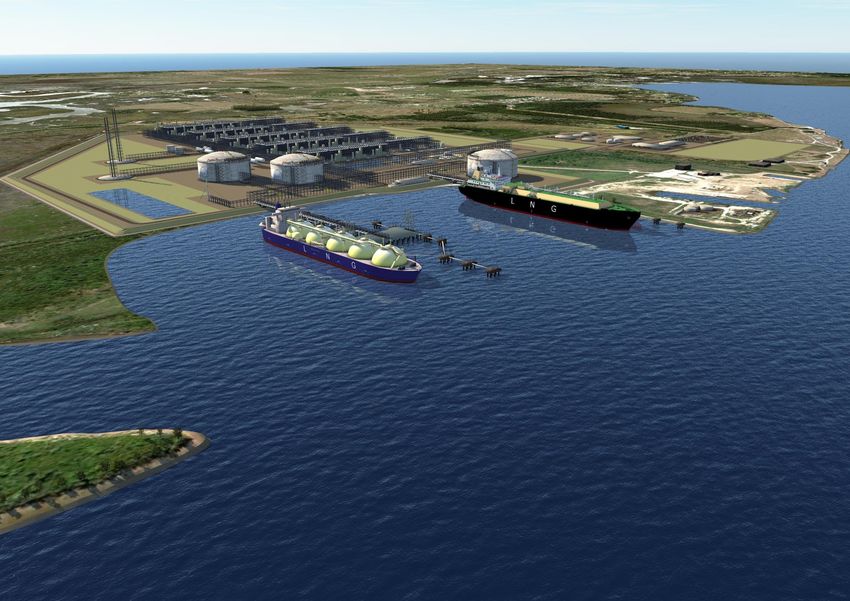
Driftwood LNG terminal
       Driftwood LNG terminal
       Land                                       ▪ ~1,000 acres near Lake Charles, LA

       Capacity                                   ▪ ~27.6 mtpa

                                                  ▪ Up to 20 trains of ~1.38 mtpa each
       Trains                                     ▪ Chart (GTLS) heat exchangers
                                                  ▪ BH LM6000 PF+ gas turbines

                                                  ▪ 3 storage tanks
       Storage
                                                  ▪ 235,000 m3 each

       Marine                                     ▪ 3 marine berths

                                                  ▪ ~$560 per tonne
       EPC Cost
                                                  ▪ ~$15.5 billion(1)
                                                                                                                              Artist rendition

     Note:   (1)   Engineering, procurement and construction costs before owners’ costs, financing costs and contingencies.

10
Integrated platform delivers certainty of low-cost LNG
Gas supply & midstream
▪ Recent U.S. oil & gas price volatility underscores importance of cost certainty
▪ Waha and Henry Hub price fluctuations show basin diversity is key for supply
▪ Tellurian team has deep experience & relationships in U.S. upstream & midstream gas
development
Liquefaction
▪ Bechtel EPC is a tested model that provides cost & timeline certainty to our partners
▪ Tellurian management team + Bechtel partnership has built ~18% of global LNG
capacity in service
▪ ~30% engineering completion to date de-risks construction timeline
Equity model
▪ Equity model provides true cost transparency and full partner alignment
▪ Asset ownership appreciation vs exposure to cost inflation on gas supply
11Driftwood expects to deliver LNG FOB at $3-4/mmBtu
Integrated operations deliver lower costs
Gas
sourcing $2.00/mmBtu
+ $0.75/mmBtu
LNG
plant +
pipeline(1) $3.50/mmBtu
Average cost on the water
Debt
service(2) + $0.75/mmBtu
Notes: (1) Includes operating expenses for Driftwood LNG plant and Driftwood pipeline, G&A and management fee.
(2) ~$14 billion of project finance debt amortized over 20-year period.
12Positioned to deliver $6-8/sh of cash flow (1)
Tellurian ownership structure(2) Illustrative cash flow calculation to Tellurian
~13.6 mtpa
~49% LP ownership
mmBtu
52
100% GP ownership
x conversion
Driftwood Holdings
x $3.50 margin
billion annual
= $2.5
Production Pipeline LNG
Company Network Terminal cash flow(3)
Notes: (1) Annual cash flow per share based on the following assumptions, among others: (a) projected $2.5 billion annual cash flow to Tellurian preferred stock issued to Bechtel and conversion of outstanding stock options and warrants for ~35 million shares.
at the midpoint of the range, (b) less estimated interest expense of ~$200 million related to Tellurian Marketing’s acquisition of 2 mtpa of (2) Pro forma construction ownership, including $7 billion investment from equity partners and final investment decision on five plants.
capacity at Driftwood Holdings funded by $1 billion in convertible debt with terms of 11% paid-in-kind (“PIK”) interest during (3) Before estimated ~$200 million interest expense related to $1 billion convertible debt financing.
construction and 11% cash interest after construction and (c) ~329 million shares outstanding after issuance of ~20 million shares
pursuant to Total common stock purchase agreement dated April 3, 2019, conversion of ~6.1 million shares of existing convertible
13On path to deliver LNG from Driftwood
Fully-
FERC & DOE
Premier site wrapped EPC Financing Construction
approval
contract
Complete Value creation catalysts
▪ LNG market recovery from COVID-19
with JKM approaching $5/mmBtu
▪ Announce commercial agreements
▪ Secure project financing
▪ Final investment decision (Phase I)
14Investor focus areas post COVID-19
Market is making progress on several fronts after COVID-19 disruption
LNG market implications Commercial & competitive Financial
▪ Clear benefit of integrated
▪ Improved liquidity: ~$50 mm
▪ LNG demand recovering model to reduce HH price
capital infusion
exposure
▪ Reinforced balance sheet:
▪ 2016-2020 LNG supply bulge ▪ Fully-permitted; shovel-ready
$100 mm pro-forma cash on
is over project
hand
▪ Low LNG pricing is inducing ▪ Exploring ways to reduce cost ▪ Development spend: Have cut
demand at Driftwood level corporate overhead by ~50%
▪ U.S. gas supply is ample ▪ Low-cost LNG on the water ▪ 18-month extension of debtKey investment highlights
✓Driftwood LNG and pipeline are shovel ready, all permits secured
✓Engineering 30% complete, >$150 mm invested
✓At full operations, projected $6-8/share in cash flow(1)
✓Implied equity value of ~$15-20/share at FID(2)
Note: (1) Annual cash flow per share based on the following assumptions, among others: (a) projected $2.5 billion annual cash flow to Tellurian (2) NPV of $6-8 cash flow per share at commercial operations in 2026 discounted at 15% for the 40-year life of the plant and assuming no
at the midpoint of the range, (b) less estimated interest expense of ~$200 million related to Tellurian Marketing’s acquisition of 2 mtpa terminal value.
of capacity at Driftwood Holdings funded by $1 billion in convertible debt with terms of 11% paid-in-kind (“PIK”) interest during
construction and 11% cash interest after construction and (c) ~329 million shares outstanding after issuance of ~20 million shares
pursuant to Total common stock purchase agreement dated April 3, 2019, conversion of ~6.1 million shares of existing convertible
preferred stock issued to Bechtel and conversion of outstanding stock options and warrants for ~35 million shares.
16Driftwood project & financial details 17
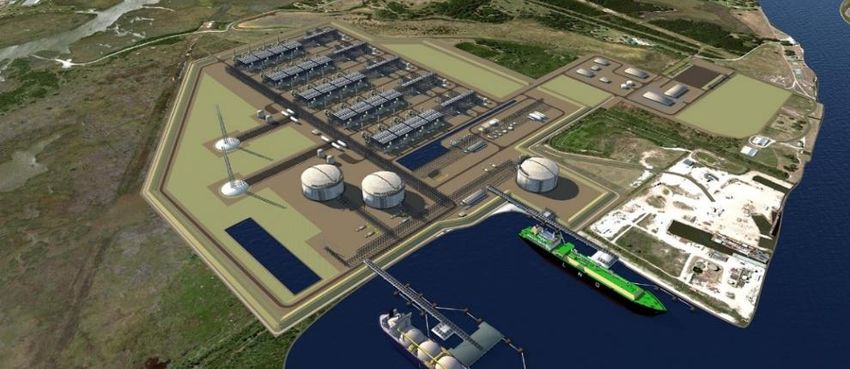
Driftwood LNG’s ideal site for exports
        Access to pipeline
        infrastructure

        Access to power and water

        Support from local
        communities

        Site size over 1,000 acres

        Insulation from surge, wind and
        local populations
                                                                                  Artist rendition
        Berth over 45’ depth with
        access to high seas               ✓ Fully permitted       ✓ 30% engineering complete
                                          ✓ EPC contract signed   ✓ Shovel ready project

18
Bechtel LSTK secures project execution
Driftwood EPC contract costs ($ per tonne)
$710 Increase from price refresh
◼ Leading LNG EPC contractor
~$560 ― 44 LNG trains delivered to 18
$500 $510
customers in 9 countries
$390 ― ~30% of global LNG liquefaction
$700
capacity (>125 mtpa)
~$550
$490 $500
$380
◼ Tellurian and Bechtel relationship
― 16 trains(1) delivered with Tellurian’s
executive team
Phase 1 Phase 2 Phase 3 Phase 4 Total ― Invested $50 million in Tellurian Inc.
Capacity 11.0 5.5 5.5 5.5 27.6
(mtpa) ◼ Price refresh in April 2019 resulted in ~2%
Plants 1&2 Plant 3 Plant 4 Plant 5 increase after ~24 months
Sources: Tellurian-Bechtel agreements; Bechtel website.
Note: (1) Includes all trains from Sabine Pass LNG, Corpus Christi LNG, Atlantic LNG, QCLNG and ELNG.
19Pipeline network 1 Driftwood Pipeline(1)
▪ Capacity (Bcf/d) 4.0
~1,000 miles of pipe ▪ Cost ($ billions) $2.3
▪ Length (miles) 96
▪ Diameter (inches) 48
▪ Compression (HP) 274,000
▪ Status FERC approval complete
2 Haynesville Global Access Pipeline(1)
▪ Capacity (Bcf/d) 2.0
▪ Cost ($ billions) $1.4
▪ Length (miles) 200
2
4 ▪ Diameter (inches) 42
▪ Compression (HP) 23,000
▪ Status Binding open season complete
3 3 Permian Global Access Pipeline(1)
▪ Capacity (Bcf/d) 2.0
▪ Cost ($ billions) $4.2
1 ▪ Length (miles) 625
▪ Diameter (inches) 42
▪ Compression (HP) 258,000
▪ Status Submitted pre-filing review with FERC
4 Delhi Connector Pipeline
▪ Capacity (Bcf/d) 2.0
▪ Cost ($ billions) $1.4
▪ Length (miles) 180
▪ Diameter (inches) 42
▪ Compression (HP) 72,000
Note: (1) Included in Driftwood Holdings at full development.
▪ Status Binding open season complete
20Driftwood pipeline: fully permitted
Driftwood pipeline route map
CS 03 Mamou
▪ 96-mile, up to 48”
CGT diameter pipeline
Transco
T E X A S
▪ Three compressor
Trunkline Texas Gas TETCO 2 stations totaling 274,000
LOUISIANA ANR
hp
CS 01 Gillis Tennessee Gas
▪ ~4 bcf/d capacity
CS 02 Basile Florida Gas &
Pine Prairie
▪ 15 meter stations
TETCO 1 Egan
▪ 14 interconnects,
including Transco, TETCO,
Cameron Pipeline
Compressor station
TGP and Trunkline
KMLP
Creole Trail
Driftwood LNG Meter station ▪ Connecting pipelines
DWLNG
facility provide access to >30
Driftwood pipeline
bcf/day of flowing gas
Interconnect
▪ FERC approved
Note: All locations approximate.
21Value to Tellurian Inc.
Every $1.00 reduction in gas costs or increase in LNG price adds $2.16/share in cash flow in 5-plant case
Base case 3 Plants 5 Plants
USGC netback Cost of LNG(1) Margin Cash flows(2)(3)(4)
($/mmBtu) ($/mmBtu) ($/mmBtu) $ millions ($ per share)
Tellurian capacity 6.6 mtpa 13.6 mtpa
$5.00 $3.50 $1.50 $340 ($1.04) $880 ($2.68)
$7.00 $3.50 $3.50 $1,030 ($3.13) $2,300 ($7.00)
$9.00 $3.50 $5.50 $1,710 ($5.20) $3,710 ($11.29)
$11.00 $3.50 $7.50 $2,400 ($7.30) $5,130 ($15.61)
Notes: (1) $3.50/mmBtu cost of LNG FOB Gulf Coast assumes $2.00/mmBtu cost of gas at Driftwood LNG terminal. and conversion of outstanding stock options and warrants for ~35 million shares.
(2) Annual cash flow equals the margin multiplied by 52 mmBtu per tonne; does not reflect potential impact of management fees paid to (4) Assumes Tellurian Marketing acquires 2 mtpa of capacity at Driftwood Holdings, financed by $1 billion in convertible debt funding with
Tellurian nor G&A. 11% paid-in-kind (“PIK”) interest during construction and 11% cash interest after construction.
(3) Annual cash flow per share based on ~329 million shares outstanding after issuance of ~20 million shares pursuant to Total common
stock purchase agreement dated April 3, 2019, conversion of ~6.1 million shares of existing convertible preferred stock issued to Bechtel
22Returns to Driftwood Holdings’ partners
U.S. Gulf Coast netback price ($/mmBtu)
$5.00 $7.00 $9.00 $11.00
Driftwood LNG, FOB U.S. Gulf Coast
$(3.50) $(3.50) $(3.50) $(3.50)
($/mmBtu)
Margin
$1.50 $3.50 $5.50 $7.50
($/mmBtu)
Annual partner cash flow(1)
$80 $180 $285 $390
($ millions per tonne)
Cash on cash return(2) 16% 36% 57% 78%
Payback(3)
6 3 2 1
(years)
Notes: (1) Annual partner cash flow equals the margin multiplied by 52 mmBtu per tonne.
(2) Based on 1 mtpa of capacity in Driftwood Holdings; all estimates before federal income tax; does not reflect potential impact of
management fees paid to Tellurian.
(3) Payback period based on full production.
23Tellurian agreements with Total
Driftwood equity investment and SPA Tellurian Marketing investment in Driftwood
▪ On July 10, 2019, Total agreed to make a $500 million ▪ Tellurian Marketing to purchase an equity interest(2) in
equity investment in Driftwood project and to purchase Driftwood project and 2 mtpa of LNG with anticipated
1 mtpa of LNG private equity funding
▪ Total also agreed to purchase 1.5 mtpa of LNG from ― Tellurian’s LNG volumes from Driftwood project will
Tellurian Marketing’s LNG offtake volumes from the increase to 13.6 mtpa at full development
Driftwood LNG export terminal
― FOB, minimum term of 15 years
― Price based on Platts Japan Korea Marker (“JKM”)
Common stock purchase agreement with Total
▪ Total to purchase ~20 million additional shares in
Tellurian for $200 million upon(1):
― Final investment decision (“FID”)
― Tellurian’s purchase of 7.2% of Driftwood equity
Notes: (1) Common stock purchase agreement executed with Total Delaware, Inc. at $10.064/share.
(2) Tellurian Marketing to purchase 7.2% equity interest in Driftwood project.
24Contact us
▪ Matt Phillips Social media
Director, Investor Relations & Finance
+1 832 320 9331 @TellurianLNG
matthew.phillips@tellurianinc.com
▪ Joi Lecznar
SVP, Public Affairs & Communication
+1 832 962 4044
joi.lecznar@tellurianinc.com
25LNG market updates 26
Global energy needs require natural gas
     The shifting landscape of energy consumption                                                                                            Drivers of shifting landscape
     8
     Tonnes oil equivalent/capita                                                                                                      35%
                                                                                                                                           ▪ Non-OECD energy consumption growth rate was
             31%
     7                                                                                                                                 30%   ~13x that of OECD’s over the past decade
      6
                                             23%
                                                                                    2030 target for                              24% 25% ▪     Despite massive energy growth, natural gas is
                                                                                  gas’ share in both                                           just 22% of non-OECD’s energy mix, while coal’s
      5                                                          19%              India and China’s
                                                                                                                                       20%     share is 36%
                                                                                      energy mix
      4                                                                                                                                        ― If gas moved to just 25%, over 200 mtpa of LNG
                     7.0                                                             15%       15%
                                                                                                                                       15%       would be required to meet demand(1)
      3
                                                              4.3                                          7%                          10% ▪   Population and economic growth to encourage
      2                                   4.0                                          6%                                                      further energy consumption growth in Asia
      1                                                                                                 2.3                            5%
                                                                                                                             0.9             ▪ 9 of 10 world’s most polluted cities located in just
                                                                                   0.6
       -                                                                                                                               0%      two Asian countries (India & China)
                    U.S.             Europe                   JKT                India               China               Rest of
                                                                                                                          Asia               ▪ A drive towards cleaner energy sources will
                                      2018 energy consumption per capita
                                      Gas’ share of 2018 total energy mix
                                                                                                                                               require both natural gas and renewables
     Sources:   BP Statistical Review of World Energy, Tellurian Research
     Note:      (1) Based on total 2018 energy demand for non-OECD countries and 0.855 mtpa LNG per 1 million tonnes oil equivalent.

27
China & India: ~90 mtpa growth potential
LNG demand growth (2019-2025) Key growth drivers
mtpa
▪ Infrastructure:
― ~2x growth in India’s pipeline grid by 2025
― ~2x growth in India’s regas capacity by 2025
― ~1.5x growth in China’s pipeline grid by 2025
45.5 43.3 ― ~2x growth in China’s regas capacity by 2025
▪ Policy:
21.0 ― India and China’s infrastructure growth allows
15.3
each to remain on track to reach their targets
of 15% for gas’ share in the energy mix by 2030
India China
▪ Latent demand:
Based on consultant forecast(1)
Based on existing and planned infrastructure(2) ― India and China’s total latent demand for
Sources: BP Statistical Review of Energy, WoodMac, SIA, Tellurian Research.
cleaner energy is equivalent to ~885 mtpa(3)
Notes: (1) Based on WoodMac’s LNG demand outlook for both India and China.
(2) Based on existing, firm and likely regas capacity in addition to downstream pipeline infrastructure projects, per project sponsors.
(3) Based on 2018 coal-fired power generation.
28India’s targets suggest even higher gas use
India natural gas demand – primary sources India’s gas demand drivers
mtpa
(1) ▪ Prime Minister Modi has set a target of 15% for
Incremental supply required for 15% target natural gas’ share of India’s energy mix by 2030
Uncontracted LNG 153
Contracted LNG ▪ ~$100 billion in energy infrastructure investment
Indigenous Production currently underway(2)
75
▪ Industrial use will lead gas demand growth as
India seeks food security for ~1.3 billion people
70
― India seeks to become a self-reliant supplier of urea,
15 28
48 triggering a revival of closed fertilizer plants and the
41 7 23 conversion of naphtha-based plants to gas
15
8
14 19
32 36 ▪ India’s build-out of city gas distribution networks
19 21 is expected to connect an incremental ~35
2018 2020 2025 2030 million homes to the national gas grid
Sources: Wood Mackenzie, BP Energy Outlook 2019 Edition.
Notes: (1) Based on BP Energy Outlook’s estimate of India’s total primary energy consumption and Prime Minister Narendra Modi’s 15% target for
natural gas’ share of India’s total primary energy consumption by 2030; 52.17 mmBtu per tonne of LNG.
(2) Per India Oil Minister Dharmendra Pradhan.
29India is rapidly building out gas infrastructure
Sharp increase in LNG and gas-related infrastructure will tap into significant latent gas demand
India’s emerging regas & gas transport infrastructure India’s regasification capacity buildout
mtpa
Existing
Under construction
78
Likely in-service
69
21
57 12
19
57 57
38
Today 2025 2030
Sources: Wood Mackenzie, BP Energy Outlook 2019 Edition, Tellurian Research.
30New Asian markets grow ~41 mtpa by 2025
Emerging markets could add the equivalent of another South Korean market by 2025
LNG demand by region
▪ Bangladesh, Malaysia, Pakistan, Thailand: mtpa
― > 32% gas market penetration, declining 600
indigenous gas production and strong
economic growth increase the call for 500
imports 400
▪ Philippines, Taiwan, Vietnam, Indonesia: 300
―JKM growing as price reference for Asia
Spot and short-term LNG trade JKM swaps cleared
Total trade (mtpa) mtpa equivalent
Share of total trade (%) 106
119
34%
99
32%
78
75
70 68 27% 35
65
28%
59
29% 28%
28%
25% 10
0 0 0 1 3
2012 2013 2014 2015 2016 2017 2018 2019 2012 2013 2014 2015 2016 2017 2018 2019
Sources: Platts, GIIGNL.
32ESG 33
Environmental and social leadership
     Driftwood LNG project expected to reduce lifecycle carbon emissions and support local communities

     Lifecycle emission reduction        Sustainable development           Social engagement
     ▪ Provide an outlet for currently   ▪ Liquefaction facility to have   ▪ Extensive community outreach
       flared natural gas in the U.S.      near zero methane emissions       and support programs

     ▪ Replace coal and oil in      ▪ Use the latest equipment,     ▪ Create 350 permanent and
       emerging markets to reduce     technology and monitoring       6,400 construction jobs
       carbon emissions and improve   systems to minimize emissions
       air quality                                                  ▪ Fund climate change research
                                    ▪ Conduct green completions in    at Columbia University
     ▪ Facilitate growth of           upstream operations
       renewables by providing
       energy reliability

34
LNG’s role in the energy transition
Today: Reduce carbon intensity, improve air quality Future: Net zero carbon emissions
▪ Increasingly cost-competitive with coal
▪ Reduces carbon emissions by up to 50%
▪ Reduces SOx, NOx and particulate matter
Facilitates coal-to-gas Carbon capture,
switching utilization and storage
▪ Grid reliability
▪ Seasonal storage
▪ High-temperature heat for industry
Supports growth of ▪ Winter heating for buildings
renewables
Carbon offsets
▪ Long-haul LNG trucking in areas without electrification
▪ LNG-powered vessels support IMO 2020 compliance
Cleaner heavy
transportation fuel
35You can also read