IR PRESENTATION Hannes Niederhauser, CEO Richard Neuwirth, CFO - August 2021 - S&T Investor Relations
←
→
Page content transcription
If your browser does not render page correctly, please read the page content below
IR PRESENTATION

Hannes Niederhauser, CEO
Richard Neuwirth, CFO

August 2021

21.6%
S&T AT A GLANCE                                                             42.4%                                            GERMANY
                                                                            REST OF
                                                                            EUROPE
                                                                                                                             EMPLOYEES
                                                                                                                             1,119                                       ASIA
                NORTH AMERICA
                                                                                                     85%          *
                                                                            EMPLOYEES                1,062 Mio.              9.6%                     5%*                EMPLOYEES
                                                                                                                                                                         214
                EMPLOYEES
                300                           10%*
                                                 126 Mio.
                                                                            2,806
                                                                                                                             AUSTRIA                    67Mio.

                                                                                                                             EMPLOYEES
                                                                                                                             588

                                                                                      3.6%                            7.8%
                                                                                                                      POLAND
                                                                                      SLOVENIA

                                                                                                                      EMPLOYEES
                                                                                      EMPLOYEES                       327
                                                                                      713

 01 S&T PROVIDES GLOBAL IOT 4.0 TECHNOLOGY                                                                    03      S&T IN FIGURES
           > IoT solutions for Industrial, Medical, Transportation and Communication                                  > FY 2020: EUR 1,255 Mio. revenue and EUR 130.0 Mio. EBITDA
           > IoT grows fast: The whole Industry 4.0 market is expected to grow at a                                   > FY 2020: EUR 140.8 Mio. record cash flow
              CAGR of ~15% by 2022*                                                                                   > 6,067 employees in 33 countries (as of December 31st, 2020)

 02 S&T IS AN IT SERVICE PROVIDER WITH REGIONAL FOCUS                                                         04      MEMBER OF THE TECDAX® & SDAX®
           > Germany, Austria, Switzerland (DACH)                                                                     > Headquarter in Linz, Austria, listed in Frankfurt, Germany
           > Eastern Europe                                                                                           > ~ EUR 1,404 Mio. market cap as of July 31st, 2021

* Revenues in % of S&T Group total revenues based on location of revenue generating S&T subsidiary                                                                                    2
** Source: IMS Report, ABI Research, Oracle, Markets and Markets Analysis
HIGH- AND LOWLIGHTS 2021

HIGHLIGHTS                                                              LOWLIGHTS

›   H1-2021:                                                            ›   Strong order intake only partially converted to revenues -> Chip
    › Growth of 11.5% in revenues and 12.2% in EBITDA vs H1-2020            shortage impact: EUR 38.3 Mio. of not delivered orders as of
                                                                            30/6/201
›   30 cent record dividend for 2020
                                                                        ›   North America weak due to FX, avionics and chip shortage
›   Strong order intake in Q2-2021 of EUR 406 Mio.
                                                                        ›   Refrain in 2021 from major acquisitions due to excessive valuations
›   2021: EUR 14 Mio. in share buybacks (currently EUR 42 Mio. spent)

                                                                                                                                                  3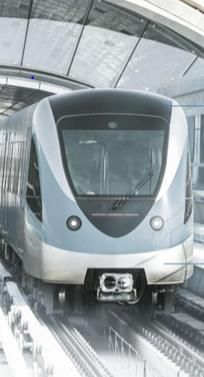
GLOBAL CHIP-SHORTAGE
UPDATE

GENERAL DEVELOPMENT & OUTLOOK                                              WHAT EFFECT DOES THIS HAVE ON S&T?
›   Lack of investments into expensive chip factories during pandemic      ›   Chip shortage impact is growing:
                                                                               › EUR 10.2 Mio. of not delivered orders in Q1
›   Strongly increasing chip demand driven
                                                                               › EUR 38.3 Mio. of not delivered orders in Q2
    › Recovery and and catch up of the industry after end of pandemic
                                                                               › Our revenues are delayed but not lost (hard to replace)
    › Public economy stimulation programs
                                                                           ›   We redesign products to replace critical chips
›   Main problem for “cheap” chips
                                                                           ›   We increased inventory by 19 Mio. in Q2 for
›   Suppliers claimed to solve most problems in Q2 but failed: 23% of
    deliveries are delayed                                                     › emergency stock of critical chips
                                                                               › Semi-finished products
›   Chip makers increased capacities 17% in 2021 but demand grows faster
                                                                           ›   We sourced chips on the spot market and accepted price increases of
›   Outlook:                                                                   4.2 Mio. EUR (6%) in Q2
    › Crisis will stay until H1/2023
                                                                           ›   Appr. 80% of those price increases we can pass on to our customers –
    › Chip prices increase during the crisis
                                                                               in 2021 an EBITDA impact of EUR 3 Mio. will remain

                                                                                                                                                      4
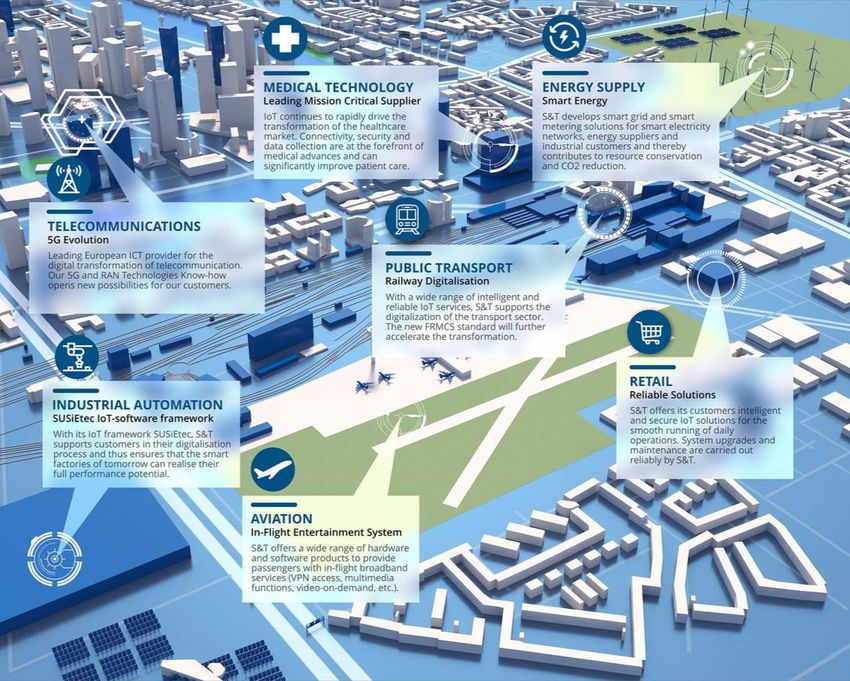
DIGITALIZATION - the next big thing

                      SMART TRAINS          WHAT WE DO
                      SMART CARS            › We make machines/equipment/grids intelligent
                      SMART ENERGY
                                            › We enable machines to talk to each other
                      SMART FACTORY
                      SMART ROBOTS          › Focus: expensive machines > 100 TEUR with low volumes
                      SMART MEDICALS        › Our products are integral parts of machines in various
                      SMART TRANSPORT         vertical markets based on similar technology
                      SMART LOGISTICS
                      SMART HOMES
                                            › Trend towards Software (75% SW engineers) and complex
                      SMART CITIES            networks offering SLAs and IoTaaS (recurring)
                      SMART CONNECTIVITIY
                                            OUR TECHNOLOGIES
                                            › Real time computing and communication
                                            › Communication: field bus, LAN, WAN, TSN, 5G

                                                                                                       5
THE MARKET

             In Billions                             2020       2025           Growth / yr
             IoT devices (in pcs.)                    20.4          75                 + 31 %
             as of 5G devices (in pcs.)                             32
             IoT market (in USD)                    1,800      3,000                       11%
             TAM Industrial IoT (in USD)                  25        48                     14%

             Main competitors in           Revenue             Machines
                                           (in USD Bn.)        connected to the Internet
             Industrial IoT                                    (IN MIO.)

             Advantech                            1.8
             S&T                                  1.7                                  75

             Curtiss Wright                       1.2
                                                                           20,4
                                                                    6,4
             ABB B&R                              1.1
                                                                  2016     2020       2025
             Beckhoff                             1.0
                                                                                    31%
             Top 5 account for                   27%                              Growth/Year

                                                                                  Source IDC, mgmt est.
                                                                                                 6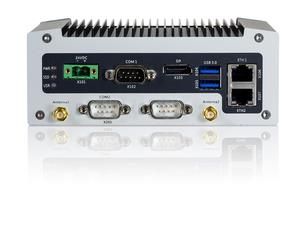
S&T BUSINESS MODEL

              IT SERVICES                                                             IOT SOLUTIONS EUROPE                                         IOT SOLUTIONS AMERICA

      SERVICES EE           SERVICES DACH             INDUSTRIAL       IOT SW   ODM     TRANSPORT   TELECOM   ENERGY      MEDICAL      IOT ASIA           IOT NORTH AMERICA

    REVENUE FC 2021: EUR 580 Mio.                       REVENUE FC 2021: EUR 850 Mio.                                                             REVENUE FC 2021: EUR 135 Mio.
                      MID-TERM TARGETS                                                                                 MID-TERM TARGETS                           MID-TERM TARGETS
                      › EBITDA** > 8%                                                                                  › EBITDA** > 14%                           › EBITDA** > 14%
                      › GM > 30%                                                                                       › GM > 40%                                 › GM > 40%
                      › Growth p.a.: 6%                                                                                › Growth p.a.: 12%                         › Growth p.a.: 12%

S&T started 2011 as an IT Service company, today 75% of profits are derived from IIoT.
                                                                                                                                                                                       7
*               * incl. I/C revenues ; ** before HQ-fee distribution
IT/IOT SERVICES
REVENUE* EBITDA ADJ. EBITDA › Region: 30% DACH + 70% in CEE (mainly EU)
BEFORE HQ FEE** MARGINS*** › We prepare a divestment of IT Services within 3 years
› We started to separate IoT Solutions and IT Services in
current IT Services segment = 1st step
269.1 21.7 › S&T East Europe is the home of several hundred
9.8% engineers crucial for IoT segment
235.5
› Target: improve EBITDA margin to > 9% and focus on
7.4% recurring revenues
12.6
› DACH region: focus on Germany, nearshoring via CEE
FC 2021 EUR 70 Mio. -> 2023: EUR 100 Mio.
6M 2020 | 6M 2021 6M 2020 | 6M 2021 6M 2020 | 6M 2021
We prepare a divestment of IT services within 3 years and started to work on it
* 3rd Party revenue including intercompany revenue in Mio. EUR
** EBITDA before charged management fees from S&T AG (part of IT Services Segment); EBITDA after management fees: MEUR 25.2 (6M 2021), MEUR 16.9 (6M 2020)
*** HQ-fee adjusted EBITDA in % of external revenue 8IOT SOLUTIONS EUROPE
41.5
REVENUE* EBITDA ADJ. EBITDA › Very strong order intake of EUR 521 Mio in H1 results in a
BEFORE HQ FEE** MARGINS*** book to bill of 1.47
› EUR 27.4 Mio of due orders delayed to Q3 as a result of
the chip crisis
35.6 › EBITDA margin diluted by M&A (Iskratel) and sourcing
355.3 34.4 12.3%
costs of chips on allocation
310.4 11.2%
› M2M (IIoT) communication expanded by newly acquired
5G know-how (Iskratel)
› Q2: Strong growth in industrial sector due to growing
IIoT market
6M 2020 | 6M 2021 6M 2020 | 6M 2021 6M 2020 | 6M 2021
“IoT Solutions Europe” could do better in Q2 if sourcing of chips would work the normal way
* 3rd Party revenue including intercompany revenue in Mio. EUR
** EBITDA before charged management fees from S&T AG (part of IT Services Segment); EBITDA after management fees: MEUR 33.0 (6M 2021), MEUR 31.8 (6M 2020)
*** HQ-fee adjusted EBITDA in % of external revenue 9IOT SOLUTIONS AMERICA
REVENUE* EBITDA ADJ. EBITDA › Weak results in H1-2021 based on:
BEFORE HQ FEE** MARGINS*** › EUR 10.9 Mio. delayed shipments (chip shortage)
› EUR 4.9 Mio. on FX, USD lost 10.0% yoy
06 › Avionics only EUR 5.8 Mio. in H1 (FY plan 22 Mio.)
› 225 TEUR A/R write-off in avionics
6.2%
05 › H2 will improve significantly based on delayed
66.9 4.9 shipments
04
› FC 2021: 135 Mio. vs EUR 152 Mio. (2020)
52.7
03 › 10% cost reductions will save profits in H2
› Mid term: 14% adjusted EBITDA Margin
02
› R&D center for autonomous driving and avionics
01 › Strong order intake of 72 Mio. in H1
1.0
0.2%
00 0.0%
6M 2020 | 6M 2021 6M 2020 | 6M 2021 6M 2020 | 6M 2021
“IoT Solutions America” hit by chip crisis, USD development and Avionics -> cost reductions implemented for H2
* 3rd Party revenue including intercompany revenue in Mio. EUR
** EBITDA before charged management fees from S&T AG (part of IT Services Segment); EBITDA after management fees: MEUR 0.08 (6M 2021), MEUR 3.3 (6M 2020)
*** HQ-fee adjusted EBITDA in % of external revenue 10TECHNOLOGY
PRODUCTS AND PRODUCT LIFECYCLE
OUR IOT TECHNOLOGY STACK
EDGE DEVICES GATEWAYS / PLC FOG CLOUD
EMBEDDED SOFTWARE IOT INTERFACE ON PREMISE COOPERATION WITH
CUSTOMIZED SECURITY COMPUTING MICROSOFT AZURE
& STORAGE
“REAL-TIME NETWORKS” OUTSIDE THE FACTORY
Profit
PRODUCT LIFECYCLE – IOT PRODUCTS Design Win
> Single Source for whole Product (av. 5 yrs.) Highest Margin
> Losses profit in engineering phase (appLifecyclerox. 2 yrs.)
R&D Cost
> R&D Cost: ~40% paid, ~10% capitalized, ~50% expensed Years
5
R&D Phase (1-2 yrs.) Deployment Phase (2-5 yrs.) Service Phase (4-10 yrs.)
11TECHNOLOGY: CONNECTIVITY DRIVES GROWTH
In Mio. EUR
IOT SOFTWARE - SUSIETEC EXCELLENT POOL OF ENGINEERS
58 2021
SUSiEtec IoT software framework: Enabling machine learning (AI) > Cost efficient (40k p.a.) in-house
› Improve software product portfolio: Embedded SW, Soft PLC, TSN (real time networks)
resources in Eastern Europe
100 2023
› EUR 100 Mio. software revenues planned by 2023, triggering add. 250 Mio. IoT products > 2020: EUR 184.1 Mio. R&D costs
(14.7% of revenues) as of ~40%
In Mio. EUR
paid by customers
5G IOT WAN NETWORKS 2021 > Total 6,138 employees (30.6.2021)
122
5G enables WAN networks for machines at high data bandwidth
› Iskratel is specialist for 5G, many synergies with SUSiEtec 200 2023
› Build up networks with IoT SW and our edge devices
929
In Mio. EUR
TRAIN CONTROL SYSTEMS 2021
114
Mission critical control systems for highspeed trains 763
› New standard FRMCS will accelerate migrations and require 4G/5G 160 2023 3,218
› Revenue plan of EUR 140 Mio. until 2023
528
In Mio. EUR
AUTONOMOUS DRIVING 30 2021 Engineering
Real Time driving systems for cars, trucks and machines 700 Field Engineers
Production
› Focus on services and software for niche applications 58 2023
Sales
› Cooperation with Intel (mobile eye) and Foxconn Admin
12KPI´S H1-2021
GOOD RESULTS IN ALL PARAMETERS
REVENUE GROSS PROFIT EBITDA
(in EUR Mio.) (in EUR Mio.) (in EUR Mio.)
600 60
500 600.6 200 233.1 50 58.3
538.7 211.6 52.0
400 150 40
300 30
100
200 20
50
100 10
+ 11.5% + 10.2% + 12.2%
0 0 0
6M 2020 | 6M 2021 6M 2020 | 6M 2021 6M 2020 | 6M 2021
NET INCOME AFTER NCI OPERATING CASH FLOW CASH AND CASH EQUIVALENTS
(in EUR Mio.) (in EUR Mio.) (in EUR Mio.)
30 Cent EPS + 6.7% 32 Cent
27 350
20 22 300
19.6 20.5 17
27.2
250 281.9
15
12
200 243.2
7
10 150
2 - EUR 39.8 Mio.
-3 100
5
-8 -12.6 50
+ 4.6% - 13.7%
0 -13 0
6M 2020 | 6M 2021 6M 2020 | 6M 2021 31.12.2020 | 30.6.2021
11.5% growth after H1 | We reiterate our FY 2021 guidance of min. EUR 1.4 Bn. ( 11.2% growth yoy) @ min. EUR 140 Mio. EBITDA
13S&T GROUP BALANCE SHEET
Mio. EUR 30/06/2021 31/12/2020 30/06/2021 31/12/2020
NON-CURRENT ASSETS 507,1 506,0 CAPITAL AND RESERVES 397,7 409,5
Fixed Assets 470,2 469,3 Equity 397,7 409,5
as of Property, plant and equipment 134,0 135,1 as of Treasury shares -42,3 -26,2
as of Goodwill 202,9 199,5 NON-CURRENT LIABILITIES 371,9 353,8
Other Assets 36,9 36,6 Long-term loans and borrowings 246,9 218,8
CURRENT ASSETS 722,0 740,7 Other Non-Current Liabilities 125,0 135,0
Inventories 179,2 159,9 CURRENT LIABILITIES 459,5 483,4
Trade receivables 191,6 204,5 Trade payables 188,9 210,0
Contract Assets from Customers 30,6 23,6 Contract Liabilities from Customers 68,6 69,7
Cash and cash equivalents 243,2 281,9 Short-term loans and borrowings 57,4 42,8
Other receivables and prepayments 77,4 70,9 Other Current Liabilities 144,6 160,9
Total Assets 1.229,1 1.246,6 Total Liabilities & Equity 1.229,1 1.246,6
Equity Ratio 32,4% 32,8%
Net Cash/Net Debt* -61,2 20,3
Working Capital excluding IFRS 15** 181,9 154,3
Inventory build up by EUR 20 Mio. to cover chip shortage| Factoring reduced by EUR 19 Mio. due to high cash | negative interest
* Definition Net Cash: Cash and cash equivalents less non-current and current financing liabilities (excl. liabilities from leasing according to IFRS 16)
** Definition Working Capital: Inventories plus trade receivables less trade payables (excl. IFRS 15 contract assets and liabilities) 14PEC PROGRAM
IMPROVE CASH CONVERSION AND WORKING CAPITAL
OPERATING CASH FLOW KPI DEVELOPMENT
(IN EUR MIO.) (IN EUR MIO.)
140 20 in EUR Mio. 2018 2019 2020 H1-2021
20.8
140.8
120 Revenue 990 1,123 1,255 600
15
100
14.2 74 days 73 days 68 days 76 days
80 Inventory
(131 Mio.) (147 Mio.) (160 Mio.) (179 Mio.)
83.4 10
60 9.9
61.4 75 days 69 days 59 days 83 days
40
A/R
44.9 5 (202 Mio.) (212 Mio.) (205 Mio.) (192 Mio.)
20 35.5 1.3
26.7 Factoring 56 Mio. (20%) 63 Mio. (23%) 77 Mio. (26%) 58 Mio. (23%)
0 0
2015 2016 2017 2018 2019 2020 Q2-18 Q2-19 Q2-20 Q2-21
WORKING CAPITAL | RATIO IN % OF REVENUE COMMENTS
200 (IN EUR MIO.) 1
15.8% 13.7% 12.3%
150 14.8%* 13.8% 0.8 › Target: operational cash flow to grow in line with EBITDA
156.4 153.9 154.3 0.6 › op. cash flow > 75% of EBITDA
100 121.5 181.
9.6%
119.2
0.4 9 › negative interest on bank accounts → therefore Factoring reduced by
50 0.2 EUR 19 Mio.
45
0 0
154.3 › Inventory increased temporary by EUR 19 Mio. to reduce impact of
2015 2016 2017 2018 2019 2020 31.12.2020 30.06.2021 cover chip shortage
*Kontron as if
15SHAREHOLDER FOCUS
TTS PROGRAM | TRUST – TRANSPARENCY - SHARE
TRUST
› Continuity in communication and guidance TRUST: GUIDANCE TRACK RECORD (EBITDA FC VS ACT)
(in EUR Mio.)
TRANSPARENCY | ADDITIONAL DISCLOSURES
130.0
› Release additional disclosures to increase transparency 135
115
111.7
› More investor meetings (2020: 442 and 6M 2021: 260) 115 100
90.5
95
SHARE / SPEND 50% OF NET PROFIT ON DIVIDEND + SBP 68.1
80
75
› We buy back shares as currency for M&A 50
55 34.4
› S&T is valued at 10 times EBITDA, our M&A targets and peers are
30.4
valued higher → we limit buy backs at EUR 22.50 35
› Less M&A activities due to excessive valuations → we might proceed 15
with SBP -5
2016 2017 2018 2019 2020
› EUR 400 Mio. available funds (cash, lines and cashflow)
DIVIDEND & SHARE BUY BACKS 2019 2020 2021 Comment
Dividend (cent) 16 30 Dividend for FY 2020 = 1.4% dividend yield
Total Dividend (EUR Mio.) 10.6 19.5 2019 no dividend (to get Covid-19 subsidies)
Share Buy backs (EUR Mio.) 14.6 12.2 16.1
TOTAL SPENDINGS (EUR Mio.) 25.2 12.2 35.6
16BACKLOG & OPPORTUNITIES
ORDERS AND DESIGN WINS REMAIN STRONG IN Q2-2021
BACKLOG DEVELOPMENT REMAINS POSITIVE 2021 DESIGN WINS COUNTRY VOLUME EUR
Control systems for high-speed train CZ,LIT,DE,FR,UK 98 Mio.
BOOK-TO-BILL RATIO
1.09 1.47 1.36 1.35 US ministry USA 51 Mio.
1,200
3,000 3,268 Public contracts PL 46 Mio.
1,137
1,000 Machine builder GER 32 Mio.
2,500 2,7
927 02 Autonomous driving USA 22 Mio.
800
2,000
760
TOP CUSTOMERS 2020 COUNTRY VOLUME EUR
600
592 1,500
Medical respiratory machines GER 33 Mio.
400
1,000 Social media compression system USA 25 Mio.
200
239 263 500 Global leader in medical equipment USA 22 Mio.
95 114 Control for high-speed train UK 25 Mio.
0 0
IT services IOT Europe IOT America Backlog Design wins Avionics Entertainment System CN 16 Mio.
31.12.2020 30.06.2021
Top 10 customers account for 19% of Revenues, totally >3000 customers
Record orders of EUR 406 Mio in Q2 = EUR 1.33 new orders on each EUR shipped → strong growth once we manage chip crisis
17GUIDANCE 2021
CONTINUOUS GROWTH IN REVENUES, EBITDA AND EPS
EBITDA / EPS REVENUE
(IN EUR MIO. / CENT) (IN EUR MIO.)
150 > 140 > 1,400
130.0
130 IoT Solutions | America 1,255
111.7
110 100 IoT Solutions | Europe 1,123
90.5 86 991
90 75 IT Services 882
68.1 70
70
468 504
50 43 385
32 36 34.4 33
22.9 28.3
30
10
-10
2014 2015 2016 2017 2018 2019 2020 2021fc 2014 2015 2016 2017 2018 2019 2020 2021fc
Backlog EUR Mio. 12/14 12/15 12/16 12/17 12/18 12/19 12/20 CONTINUOUS GROSS MARGIN AND EBITDA MARGIN GROWTH
Project Pipeline 644 701 1,002 1,105 1,632 2,158 2,702 GM 33.0 % 33.9 % 33.5% 35.7 % 35.0% 36.3% 36.3% > 37%
Scheduled Orders 157 181 306 474 841 841 927 EBITDA 5.9% 6.0% 6.8% 7.7% 9.1% 9.9% 10.4% >10%
Guidance 2021: min. EUR 1,400 Mio. Revenue – min. EUR 140 Mio. EBITDA
18SHORT AND MIDTERM GOALS | VISION 2030
GUIDANCE 2021 AGENDA 2023
Revenue: minimum EUR 1,400 Mio. 5 years plan 2018 2023p Growth
EBITDA: minimum EUR 140 Mio. Revenue 990 Mio. 2,000 Mio. +102%
EPS: minimum 1 Euro EBITDA 90.5 Mio. 220 Mio +143%
EPS 70 cent 175 cent +150%
VISION 2030
SMART Transformation to M&A
Digitalization Technologies 50% GM, 15% EBITDA Strategy Brand Awareness
. . . . .
Based on current forecasts and order backlog we confirm all short, mid and long-term plans
19BUSINESS MODEL TRANSFORMATION OVER 20 YEARS
REVENUES PER PRODUCT GROSS AND EBITDA MARGIN TREND
(in EUR Mio.) 60.0%
800.0
50.0% IoTaaS/SLAs
700.0
600.0 40.0% IoT Products
500.0
400.0
30.0% IT Services
300.0
20.0% IT Products
200.0
100.0 10.0%
0.0
2008 2010 2012 2014 2016 2018 2020 0.0%
2008 2010 2012 2014 2016 2018 2020 2022 2024 2026 2028 2030
IT Products IT Services IOT as of IoT SLAs
GM % EBITDA %
In 2011 S&T was an IT Service company, today IoT products account for 71% of EBITDA – by 2030 IoT business > 90%
20M&A STRATEGY
M&A is a core competence of S&T
M&A VOLUME
› Half of growth by M&A, half by organic growth (in EUR Mio.)
› Key synergies:
› Cross-sell IoT Software to new customers Kontron
M&A
› Benefit from S&Ts efficient R&D: ~3700 FTE @ 40k/y cost 300
› Sufficient cash – EUR 400 Mio. cash, unused credit lines, treasury shares
250
and strong cash flow support -> no capital increase needed for Agenda
2023 200
› 2021 less acquisitions, S&T will not participate in current excessive
150
valuations and wait for lower valuations
100 to high
S&T M&A targets valuations
› Restructuring situations at low price (< 40% of Rev) but high synergies 50
› Dilution in year 1 -> achieve 10% EBITDA in year 2
0
› Regional focus: European Union, no risky countries (e.g. MD, RUS, BY) 2012 2013 2014 2015 2016 2017 2018 2019 2020 2021 2022 2023 2024
› Focus: IoT Europe; Opportunistic: IT Services and IoT America
2021 no major acquisitions planned – we will not participate in excessive valuations
21SUMMARY
ACHIEVEMENTS TARGETS
› Revenue growth of 11.5% in Q2-2021 vs. Q2-2020 › Guidance 2021:
› Revenue > EUR 1.4 Bn. and EBITDA > EUR 140 Mio.
› EBITDA growth of 10.2% in Q2-2021 vs. Q2-2020
› EUR 2 Bn. Revenues at > 11% EBITDA in 2023
› Strong order entry of EUR 810 Mio in H1/2021 (book to bill
› 2030: Transformation to IoT Player, EBITDA > 15%
1.35)
› Ongoing Working Capital improvement
› MDAX membership
RISKS OPPORTUNITIES
› Chip shortage burdens delivery of products › Leading technologies in the growing IIoT market
› US-Dollar development › 5G connectivity for machines
› Attract sufficient engineers to support growth › Growth areas America + China
22APPENDIX
S&T KEY FIGURES
In Mio. EUR 2017 2018 2019 2020 6M 2021
Revenues 882.0 990.9 1,122.9 1,254.8 600.6
Gross Profit 315.0 346.5 407.5 455.8 223.1
Gross Margin 35.7% 35.0% 36.3% 36.3% 38.8%
EBITDA 68.1 90.5 111.7 130.0 58.3
EBITDA Margin 7.7% 9.1% 9.9% 10.4% 9.7%
EBIT before PPA amortization 47.9 67.3 67.2 81.7 31.8
Net Income after NCI 29.4 48.5 49.1 55.6 20.5
EBITDA Interest Coverage Ratio* 9.8 14.5 12.4 14.0 13.6
Net Cash ** 101.8 52.7 29.5 20.3 -61.2
Working Capital *** 121.5 156.4 153.9 154.3 181.9
Equity Ratio 41.2% 43.3% 31.4% 32.8% 32.4%
Operating Cash flow 44.9 35.5 83.4 140.8 -12.6
Employees 3,849 4,248 4,934 6,067 6,138
* Definition EBITDA Interest Coverage Ratio: EBITDA divided by interest expenses (excl. interest expenses related to leasing liabilities according to IFRS 16)
** Definition Net Cash: Cash and cash equivalents less non-current and current financing liabilities (excl. liabilities from leasing according to IFRS 16)
*** Definition Working Capital: Inventories plus trade receivables less trade payables (excl. IFRS 15 contract assets and liabilities)
23APPENDIX
EXPERIENCED MANAGEMENT TEAM
EXECUTIVE
BOARD
HANNES
NIEDERHAUSER
CEO RICHARD PETER MICHAEL CARLOS
NEUWIRTH STURZ JESKE QUEIROZ
COO COO Michael
CFO COO
Services EE Services DACH Riegert
IoT Europe
EVP
Transportation
EXTENDED
MANAGEMENT
BOARD
Robert Steve Zeljko Olga Bernhard Jochen Andy Christoph
Courteau Chen Puljic Sinenko Günthner Gimple Mason Neumann
EVP EVP EVP EVP EVP VP VP VP
America Asia Communication Smart Energy IoT Software ODM Avionics Technology
For our M&A activities we are looking for interested interim managers to support the integration phase of companies.
24INCREASE TRANSPARENCY
ADDITIONAL DISCLOSURES 2021
IN TEUR EBIT ADJUSTMENTS Q2 IN TEUR OP. CASHFLOW ADJUSTMENTS Q2
13,914 STATED EBIT Q2 14,205 STATED OP. CASHFLOW
-363 Expenses stock options -1,704 Increase in A/R factored from 31.03.2021 to 30.06.2021
-208 Damages to our property 405 Cash effect from one time profit effects in Q2
639 Release variable purchase price S&T Smart Energy 12,906 ADJUSTED OP. CASHFLOW
600 Profit on sales of assets (building sold as part of space reduction)
-197 Voluntary paid Corona premium
471 ONE TIME PROFIT EFFECTS
3,979 R&D Capitalization ORGANIC GROWTH
-3,402 R&D Amortization in TEUR Q2-2020 Q2-2021
577 IMPACT R&D CAPITALIZATION Stated revenue 268,595 306,490
12,866 ADJUSTED EBIT M&A adjustment Iskratel -22,623
-2,578 PPA Amortization
M&A adjustment CITYCOMP -8,829
15,444 ADJUSTED EBIT BEFORE PPA
M&A adjustment HCS, Axino -3,467
IN TEUR INTEREST COSTS ADJUSTMENTS Q2 Closing adjustment KAD +541
FX adjust +7,492
-2,450 STATED INTERST
-553 Application of WACC on variable purchase prices ORGANIC GROWTH 4.2%
-1,897 ADJUSTED INTEREST
25INCREASE TRANSPARENCY
ADDITIONAL DISCLOSURES 2021
ACCRUALS ANALYSIS
(in TEUR) P&L impact 2019 2020 H1-2021 Comment
TOTAL ACCRUALS no 84,348 67,319
Accruals added by acquisitions no 57,651 * 2,567 885 * EUR 54 Mio. Kapsch
Accruals used via P&L no -24,238 ** -21,600 ** -6,453 ** EUR 32 Mio. Kapsch
Accruals added via P&L yes 9,190 8,110 1,762
Accruals released via P&L yes -14,086 -2,202 -2,486
P&L impact by accrual changes 4,896 -5,908 724 Q2 isolated: -339 TEUR
RECURRING GEOGRAPHICAL SPLIT Q2-2021
REVENUES* (in %) Revenue EBITDA
(in EUR Mio.) 2019 in % 2020 in % H1-21 in %
Europe 83.1% 93.9%
Recurring
288 25.6 344 27.4 154 35.2 North America 8.1% -0.6%
Revenues
Asia 4.7% 4.1%
* Stated Recurring revenues include Software, SLAs and maintenance (not Hardware sold with SLA,
info to come 12/2021) RUS/BY/MD 4.1% 2.7%
26ESG IMPROVEMENTS & GOALS – 2020,2021 AND BEYOND
COMMUTE & TRAVEL HUMAN DEVELOPMENT AUDIT COMMITTEE
More Information on employee increased audit committee
Promotion of train travel, video-
development programs independency since June 2020
conferencing and Home-office work
DIVERSITY STOCK OPTON PLAN &
PROMOTION OF REMMUNERATION
CLEAN TECHNOLOGIES continue to increase share of women in
New Stock Option Plan for broad employee
Expansion of renewable energy usage, e.g. S&T management positions from 21.6% base established, further initiatives to
own photovoltaic systems up to 25.6% equaling the current gender secure on fair and equal remuneration
distribution in S&T, new female SVB planned (including new targets/MTI)
member
STEP-BY-STEP ESG PLAN COMMUNICATION
IMPROVED COMPLIANCE Intensify communication with
3 years plan to coordinate ESG topics on TRAINING SYSTEM
group level, clear target to improve ESG Group-wide online compliance training “Kleinaktionären”, e.g. new shareholder
Ratings (MSCI to at least BBB). tool to be implemented in 2021 website was set up
Preparation Scope I and II Evaluation ESG-Goals Implementation Stage III
Reporting expansion Implementation Stage II Finalization
ESG-Goal extension Continuous Improvement Process
Improved reporting
ESG-Risk assessment according to recognised
Update Materiality Analysis ESG standards
Stakeholder Dialog
Steps 2021 Steps 2022 Steps 2023 27APPENDIX
THE S&T SHARE - TECDAX® & SDAX® MEMBER; TARGET: MDAX®
SHAREHOLDER STRUCTURE S&T SHARE: A TECDAX® & SDAX® MEMBER
1800 30.00
1600
25.00
1400
Ennoconn Corporation - 26.61% 1200 20.00
Freefloat - 73.4% - includes as follows: 1000
15.00
Allianz Global Investors GmbH - 4.96% 800
BNP Paribas Asset Management - 4.06% 600 10.00
400
Ninety One SA (Pty) Ltd - 3.99% 5.00
200
S&T Treasury Shares - 3.56%
0 0.00
S&T Management - 1.70% 01/01/2016 01/01/2017 01/01/2018 01/01/2019 01/01/2020 01/01/2021
S&T AG TecDAX Index SDAX S&T AG EUR
COVERAGE One new analysts will take on coverage of S&T AG SHARE LIQUIDITY
1,500,000,000
AlsterResearch | Buy: EUR 31.00 Jefferies | Buy: EUR 32.00 1,000,000,000
Commerzbank | Buy: EUR 31.00 Pareto Securities | Buy: EUR 30.00
500,000,000
Hauck & Aufhäuser | Buy: EUR 31.00 Warburg Research | Buy: EUR 29.00
0
Kepler Cheuvreux | Buy: EUR 27.00 2012 2013 2014 2015 2016 2017 2018 2019 2020
SBP I 2021 to purchase max. EUR 10 Mio. with a maximum price of EUR 22.50 per share on track with EUR 7.9 Mio. spent
SBP might be extended in autumn 2021
28DISCLAIMER
This document includes 'forward-looking statements'. Forward-looking statements are all statements, which do not describe facts of the past, but containing the words "believe", "estimate", "expect", "anticipate",
"assume", "plan", "intend", "could", and words of similar meaning. These forward-looking statements are subject to inherent risks and uncertainties since they relate to future events and are based on current
assumptions and estimates of S&T AG, which might not occur at all or occur not as assumed. They therefore do not constitute a guarantee for the occurrence of future results or performances of S&T AG. The actual
financial position and the actual results of S&T AG, as well as the overall economic development and the regulatory environment may differ materially from the expectations, which are assumed explicitly or implicitly in
the forward-looking statements and do not comply to them. Analysts and investors, and any other person or entity that may need to take decisions or prepare or release opinions about the shares / securities issued by
S&T AG are cautioned not to place undue reliance on those forward-looking statements, which speak only as of the date of this document. Past performance cannot be relied upon as a guide to future performance.
Except as required by applicable law, S&T AG undertakes no obligation to revise these forward-looking statements to reflect events and circumstances after the date of this presentation, including, without limitation,
changes in S&T’s business or strategy or to reflect the occurrence of unanticipated events. The financial information and opinions contained in this document are unaudited and are subject to change without notice.
This document contains summarized information or information that has not been audited. In this sense, this information is subject to, and must be read in conjunction with, all other publicly available information,
including if it is necessary, any fuller disclosure document published by S&T AG. None of the Company, its subsidiaries or affiliates or by any of its officers, directors, employees, advisors, representatives or agents shall
be liable whatsoever for any loss however arising, directly or indirectly, from any use of this document its content or otherwise arising in connection with this document.
This document or any of the information contained herein do not constitute, form part of or shall be construed as an offer or invitation to purchase, subscribe, sale or exchange, nor a request for an offer of purchase,
subscription, sale or exchange of shares / securities of S&T AG, or any advice or recommendation with respect to such shares / securities. This document or a part of it shall not form the basis of or relied upon in
connection with any contract or commitment whatsoever.
This document does not constitute an offer to purchase securities in the United States, Canada, Australia, South Africa and Japan. Securities, including the bond of S&T AG may not be sold or offered for sale within the
United States or to or for the account of / in favor of US citizens (as defined in Regulation S under the U.S. Securities Act of 1933 in the current version (the "Securities Act") unless they are registered under the
regulations of the Securities Act or unless they are subject to an exemption from registration. Neither S&T AG nor any other person intend to register the offer or a part thereof in the United States or to make a public
offer of the securities in the United States.
29S&T AG
Industriezeile 35
A-4021 Linz
www.snt.at
IR Contact:
ir@snt.at
+43 (1) 80191 - 1196
30You can also read