THE IMPACT OF GOVERNMENT DUTIES ON HOUSEHOLD INSURANCE - Insurance Council of Australia
←
→
Page content transcription
If your browser does not render page correctly, please read the page content below

THE IMPACT OF GOVERNMENT DUTIES
   ON HOUSEHOLD INSURANCE

   Insurance Council of Australia

           November 2019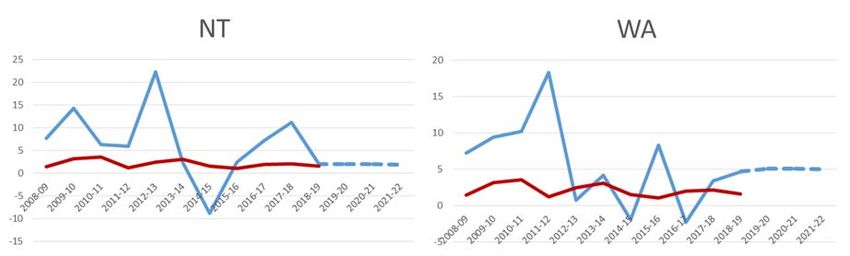
Contents

1.   Introduction ....................................................................................................................... 3
2.   The impact of taxing home and contents policies ............................................................. 5
3.   Decreased affordability contributes to underinsurance and non-insurance ...................... 9
4.   Designing an efficient tax system ................................................................................... 11
       4.1     Stamp duty is a regressive tax ............................................................................ 12
       4.2     Stamp duty reforms ............................................................................................. 12
       4.3     Government reliance on insurance taxation revenue .......................................... 13
5.   Alternative model for revenue collection ......................................................................... 15
6.   Conclusion ...................................................................................................................... 17
7.   Appendix ......................................................................................................................... 18
       7.1 Total insurance taxes and levies collected ........................................................... 18
       7.2 Percentage changes in insurance tax collected ................................................... 19

                                                                                                                                       2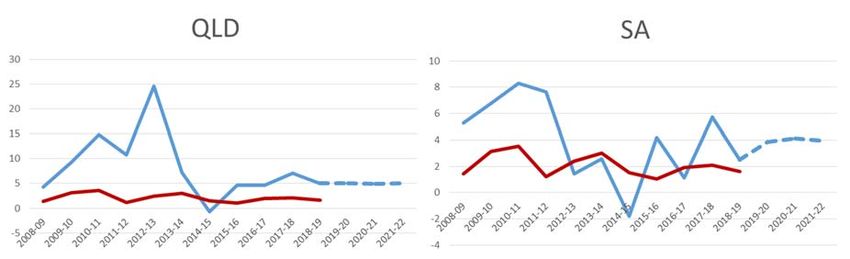
1. Introduction
The Insurance Council of Australia (the Insurance Council) is the representative body of the
general insurance industry in Australia. Its members are responsible for more than 95 per cent
of total premium income written by private sector general insurers. Insurance Council
members, both insurers and reinsurers, are a significant part of the financial services system.
They provide insurance products ranging from those usually purchased by individuals (such
as home and contents, travel and motor vehicle insurance) to those purchased by small
businesses and larger organisations (such as product and public liability, professional
indemnity, commercial property, and directors and officers insurance).
The industry employs about 60,000 people and on average pays out about $151.4 million in
claims each working day. June 2019 Australian Prudential Regulation Authority statistics show
that the private sector general insurance industry generates gross written premium of $48.4
billion a year and has total assets of $128.4 billion.
Through the efficient management of risk, the general insurance industry plays an essential
role in supporting the everyday activities of individual Australians, communities and the
broader operation of the Australian economy. In particular, the industry plays a critical role in
protecting the financial wellbeing of individuals, households, businesses and communities by
restoring their standard of living and helping them recover following natural catastrophes and
other insured events.
The role of the general insurance industry in community recovery is significant not only in
terms of the billions of dollars of claims paid each year, but also because of the evolving risk
mitigation and emergency management initiatives that make for more resilient Australian
communities.
The Insurance Council has been a key participant in the tax reform debate. The economic
case for the abolition of insurance-based taxes (here referring to stamp duties and levies to
fund emergency services) is widely accepted, having been canvassed in numerous federal,
state and territory government reviews and inquiries including:
Australian Competition and Consumer Commission’s Northern Australia Insurance
Inquiry 2018
Australian Government’s Review of Australia’s Future Tax System (the Henry
Tax Review) 2010
NSW Independent Pricing & Regulatory Tribunal (IPART) Review into State Taxation
2008
2009 Victorian Bushfires Royal Commission
NSW Government 2012 review: Funding our Emergency Services
ACT Review of Taxation 2012
GST Distribution Review1
Various Productivity Commission reports.2
1
See GST Distribution Review, Final Report. October 2012.
2
Multiple Productivity Commission reports have recommended the abolishment of insurance-based taxes including Rec 4.8 –
Natural Disaster Funding Inquiry (December 2014); Rec 4.8 – Shifting the Dial: 5 Year Productivity Review (October 2017) and;
Rec 14.3 – Inquiry Report; Competition in the Australian Financial System (August 2018).
3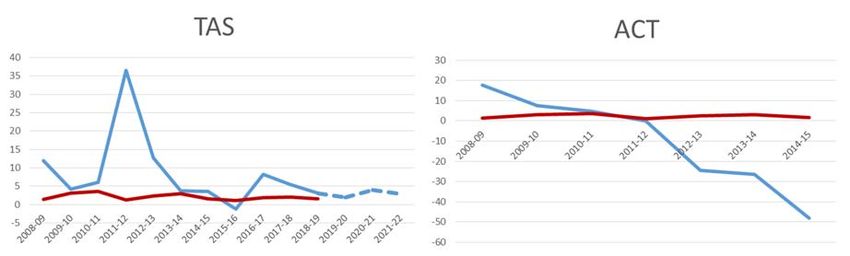
The consensus is that the states and territories would be materially better off if they reformed
their tax regimes so that they were more or wholly reliant on broad-based taxes with minimal
exemptions at the same time as they reduced their reliance on transaction-type taxes,
including insurance duties.

The interests of all states and territories would be best served by abolishing their insurance
duties. The successful shift in states (including Victoria, South Australia and Western
Australia) from funding their emergency services through an insurance levy to a broad-based
property levy shows that reform is feasible and would bring significant social and fiscal
benefits.

Unfortunately, high taxes are a significant disincentive for households to insure. The take-up
of home and contents insurance is consistently lowest in NSW, the jurisdiction with the
highest rate of insurance duties and levies and the only state or territory to still fund
emergency services via a levy on retail insurance premiums.

The ACT’s experience in phasing out its stamp duties on insurance products between 2012
and 2016 shows governments can smoothly transition to other, more efficient and fairer
revenue sources.

A broad-based property levy, subject to safeguards as to its impact, is a more economically
effective and equitable method to fund Australia’s state and territory governments when
compared with transactional insurance duties.

This type of levy would encourage the adequate take-up of insurance and be a more efficient
and certain way of collecting revenue compared with insurance duties, which in essence
penalises policyholders for effectively managing their risks.

State and territory governments have the opportunity, through the reform of their insurance tax
regimes, to strengthen the long-term integrity of their own revenue bases.3

3
 For example, the Productivity Commission’s October 2017 Draft Report on its Inquiry into Australia’s system of horizontal fiscal
equalisation (HFE) underpinning the distribution of GST revenue to the states and territories.
                                                                                                                              4
2. The impact of taxing home and contents policies
Table A below demonstrates in each state and territory the significant increase in premium
from layering of insurance duty on premium before the Goods and Services Tax (GST) is
applied, from 19.9 per cent on a Queensland home insurance policy premium to a substantial
45 per cent in New South Wales (NSW is the only state to retain an additional Emergency
Services Levy or ESL).4 Having phased out insurance duties in 2016, consumers in the ACT
are in a markedly better off position with only the GST charged on premiums. Commercial
premiums are typically significantly higher than for consumer policies, so the impact of these
charges often hits small-to-medium businesses hardest.
Table A: Comparison of insurance duties by states and territories

Tax        General insurance (GI) taxes                                                  Impact of levies, GST and
           (GST of 10% applies to all GI products)                                       stamp duties on final price
                                                                                         paid by consumer5
NSW        Stamp duty*: 9% of the premium. Concessional 5% of premium                    The addition of ESL, GST and stamp
           payable on aviation, disability, hospital and ancillary health benefits,      duties is projected to add in 2020-21
           motor vehicle, occupational indemnity. Concessional 2.5% of premium           more than 50% to the base premium
           paid on crop and livestock.                                                   for a household policy and up to 70% to
                                                                                         a business policy.
           ESL: Historically adds 21% to home and contents premiums and up to
           40% to business premiums.
           Note: NSW is increasing its ESL requirements by $230 million between
           2018-19 and 2021-22 to fund presumptive workers’ compensation
           liabilities for firefighters.
VIC        Stamp duty*: 10% of previous month’s gross premiums.                          The addition of GST and stamp duties
                                                                                         adds 21% to the base premium for a
           Note: Victoria abolished its Fire Services Levy on insurance premiums         household policy.
           in 2013.

QLD        Stamp duty*: 9% of the premium for most GI contracts; 5% of net               The addition of GST and stamp duties
           premiums for workers compensation. 10c flat for CTP.                          adds 19.9% to the base premium for a
                                                                                         household policy.
           Note: The Queensland Government increased its stamp duties on GI
           products by 1.5 percentage points in 2013.
WA         Stamp duty*: 10% of gross premiums; 10% of premiums on CTP.                   The addition of GST and stamp duties
                                                                                         adds 21% to the base premium for a
                                                                                         household policy.

SA         Stamp duty*: 11% of premium.                                                  The addition of GST and stamp duties
                                                                                         adds 22% to the base premium for a
                                                                                         household policy.

TAS        Stamp duty*: 10% of premium.                                                  The addition of GST and stamp duties
                                                                                         adds 21% to the base premium for a
           Note: The Tasmanian Government increased the stamp duty on GI                 household policy.
           products by 2 percentage points in 2012.

NT         Stamp duty*: 10% of premiums.                                                 The addition of GST and stamp duties
                                                                                         adds 21% to the base premium for a
                                                                                         household policy.

ACT        Stamp duty*: Nil.                                                             The addition of GST adds 10% to the
                                                                                         base premium for a household policy.
           Note: The ACT completed the phasing out of its stamp duties on
           insurance products in 2016.
Source: States and territories’ general insurance duty rates retrieved from NSW Treasury, TRP18-01 Interstate Comparison of
Taxes 2017-18, page 22. April 2018. States and territories’ impact of general insurance duties on price (percentage) calculated by
the Insurance Council. NSW Budget papers and ministerial statements.

4
  Under the Australian Accounting Standards, the ESL is considered a component of the insurance premium, alongside the GST
and state duty applied.
5
  Percentages are a calculation of the final effect of all state and territory government charges as a percentage of the insurer’s
base premium.
                                                                                                                                  5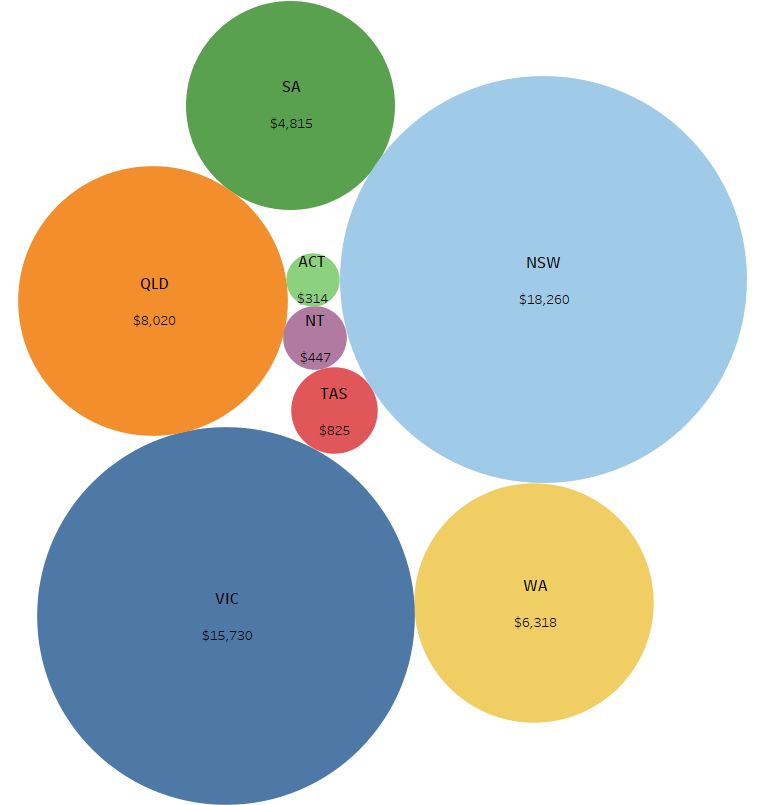
The significant impact of levies, GST and stamp duties on final price paid by consumers for
household policies is represented in Chart 1 below.5
Chart 1: Interstate comparison of insurance duties as a percentage of base premium

The Insurance Council recently conducted an analysis, using the taxation rates in
Table A and drawing data from the past three Australian Bureau of Statistics (ABS)
Household Expenditure Surveys to examine changes in the affordability of and decision
to purchase (take-up) household home and contents insurance in each state and territory
from 2003-2016.6

Chart 2 shows the percentage of total household income (all sources) spent on home and
contents insurance.7 Chart 3 selects food (including takeaway and restaurant) and non-
alcoholic beverages, as a comparative measure of an expenditure class that is relatively
inelastic in demand.8

Separately, Chart 47 observes home and contents insurance take-up over these three survey
years, to show how price growth affects some states more than others.

The survey data shows that the cost of home and contents insurance relative to income
increased significantly, with a notable sharp escalation in the 2015-16 period, for most states
and territories. Household expenditure on food and beverages is shown alongside these
figures to provide some context.

The take-up of home and contents insurance is consistently lowest in NSW, the jurisdiction
with the highest rate of insurance duties and levies and the only state or territory to still fund

6
  Insurance Council conducted this analysis using data extracted from the past three ABS Household Expenditure Surveys: 2003-
04, 2009-10 and 2015-16. The analysis is limited to households residing in a detached or semi-detached dwelling owned by the
occupants outright or by mortgage.
7
  Charts 2 and 4 include households purchasing a combined home and contents policy; home policy; and contents policy. (Exclude
each household that purchased a home or contents policy in isolation).
8
  Household expenditure represented in Charts 2 and 3 is tax inclusive.
                                                                                                                          6
emergency services via the ESL on insurance premiums (see Chart 4 on page 8).
In 2016, the NSW Government announced it would abolish its ESL from 1 July 2017. The
insurance industry spent more than $40 million to help ensure a smooth transition from the
ESL to a property-based tax.9 However, in late May 2017 the NSW Government announced
the postponement of this essential reform, with no date given for resumption of the process.
Insurers were therefore required to continue the collection of ESL on household, small
business and some motor vehicle policies in NSW. The NSW Government’s policy reversal
has led to confusion among insurance customers and fluctuations in premiums, particularly
for commercial insureds, as the ESL was reinstated upon renewals. Furthermore, the NSW
Government committed in 2018 to funding an increase in NSW firefighters workers’
compensation benefits through the ESL. While not questioning the policy reason for the
increase, the Insurance Council regrets that this decision will further reduce the affordability of
premiums in NSW.
Chart 2: Percentage of total household income spent on home and contents insurance
9
Household expenditure represented in Charts 2 and 3 is tax inclusive
7Chart 3: Percentage of total household income spent on food and drink (exc alcohol)
Chart 4: Percentage of households covered by home and contents insurance policies
83. Decreased affordability contributes to underinsurance and non-insurance
According to data from the 2015-16 ABS Household Expenditure Survey, it is estimated that of
the nine million households that could potentially purchase contents insurance, 30 per cent
(about 2.7 million) did not have a contents policy. Of the 5.8 million potential buyers of home
insurance10, 5.7 per cent do not have a building insurance policy. The ABS data estimates are
substantiated in Table B, with similar median percentages of non-insured households
determined from the Insurance Council’s policy-in-force (PIF) dataset.11
Table B12: Rates (percentage) of non-insured households in Australian suburbs from PIF
dataset
1. State 2. Median suburb rate 3. Highest suburb rate 4. Lowest suburb rate
QLD North 5.68% 8.57% 3.61%
QLD South 5.87% 7.84% 3.34%
NSW 6.38% 9.37% 4.21%
VIC 6.12% 8.89% 2.44%
SA 6.23% 6.92% 3.53%
TAS 6.09% 9.09% 2.38%
WA 6.31% 7.93% 3.38%
ACT; NT Not assessed
The Insurance Council also recently conducted a national survey13 that found more than 80 per
cent of Australian homeowners and renters are likely to be underinsured for their home and
contents and 63 per cent of renters do not have contents insurance.
Insurance duty increases the cost of insurance and may deter many householders and small
business owners from taking up the appropriate level of insurance. The current insurance duty
regime imposes a tax on people who protect their property, businesses, motor vehicles and
personal possessions by insuring them.
The non-insured do not pay the insurance duty, while the owners of underinsured assets and
businesses pay less than those fully insured. Apart from operating as a disincentive for owners
of assets to purchase adequate insurance, when duties on the insurance industry are one of
government’s main own-source revenue mechanisms, this raises significant equity concerns.
The disincentive to appropriately insure is exacerbated by the combined effect of GST charged
on insurance premiums and the ESL in NSW, which significantly reduces insurance
affordability and increases the risk that a household or business will underinsure or not
purchase insurance.
10
Potential buyers of home insurance are represented by households residing in a detached or semi-detached dwelling owned by
the occupants outright or by mortgage.
11
The PIF is an ICA collated dataset that contains policy records for approximately 10 million building insurance policies in
Australia that were in-force as at 1 November 2017. This dataset is useful as it represents actual consumer behaviours, rather than
anecdotal information and speculation. The PIF shows, for each address, what the policy holder purchased, including; the sum -
insured, the premium paid, the age of the property and the excess payment preferred for making a claim.
12
Columns 3 and 4 show the percentage of non-insurance in suburbs with highest and lowest rates of non-insurance per state,
respectively.
13
Quantum Market Research for Understand Insurance (the Insurance Council’s financial literacy initiative). April 2016.
9The diminished affordability arising from the imposition of state and territory government stamp
duties on insurance premiums reduces community resilience to insurable catastrophic events.
Exacerbation of non- and underinsurance by insurance duties ultimately increases the
Australian and state and territory governments’ own financial exposure to catastrophic events
through strong political pressure to meet community expectations of recovery assistance.
It has been recently calculated that over the past decade the total economic cost of natural
disasters in Australia averaged $18.2 billion a year and that the total economic cost of natural
disasters will reach $39 billion a year by 2050, a growth rate of 3.4 per cent a year.14
Research from the Insurance Council in 201515 examined the impact of removing state and
territory insurance duties (and the Emergency Services Levy in NSW) on the take-up of house
or contents insurance.
It was found that the removal of all insurance taxes and charges would result in a $643 million
(or 13 per cent) increase in household expenditure each year on pre-tax insurance premium on
house or contents insurance across Australia.
Also in 2015, the Insurance Council commissioned research16 using computable general
equilibrium modelling of the Australian economy17 to determine the economic impact of
removing all insurance-based taxes in all states and territories and replacing them with
commensurate increases in municipal land rates/property taxes. The research found that this
would lead to:
A net increase in real private consumption across Australia of $5.52 billion
A net increase in tax revenue collected by state, territory and local governments
of $575 million after five years if this reform were implemented Australia-wide.
14
Australian Business Roundtable for Disaster Resilience and Safer Communities, Media Release. 21 November 2017.
15
Tooth, R, Sapere Research Group, (research commissioned by the Insurance Council), Analysis of demand for home and
contents insurance, pages 24-30. August 2015.
16
Insurance Council and Deloitte Access Economics. Impact of removing stamp duties on insurance. October 2015.
17
Comparative static computable general equilibrium model of the Australian economy with a representative household to model
the impact of these changes on private consumption (as a proxy for welfare) and government budgets is recent best practice of
modelling the impact of taxes in Australia, according to Cao, L. et al. Understanding the economy-wide efficiency and incidence of
major Australian taxes. The Treasury, Australian Government. 2015; KPMG, CGE analysis of the Current Australian Tax System.
Canberra. 2010; and Deloitte Access Economics, Analysis of state tax reform: Report for Insurance Council of Australia. 2011.
104. Designing an efficient tax system
The effectiveness of a tax in achieving its purpose can be assessed against certain criteria,
firstly by being equitable in terms of both horizontal and vertical equity (meaning that taxpayers
with greater ability to pay, pay more tax). Furthermore, the effective tax should be:
Transparent and simple to understand
Unaffected by the imposition of separate taxes and levies
Structured to minimise non-compliance
Able to provide government/s with sufficient funding to adequately provide
the services expected by the community.
Insurance duties imposed on general insurance policies do not satisfy these characteristics.
Nor do they uphold the effective tax criteria of efficiency, in that the imposition of insurance
duties raises premiums and as a consequence can affect consumers’ choices to purchase
insurance, increasing the likelihood of non-insurance and underinsurance (as discussed in
earlier sections). The Insurance Council conducted an analysis18 of the economic efficiency of
state and territory government taxes to produce the rankings summarised in the chart below.
Chart 5 shows that the change in consumption reduces as tax becomes more efficient. The
efficiency rankings are based on the ratio of the percentage change in real consumption to the
percentage change in tax revenue and then indexed to payroll tax, which is assigned a value
of 1. Accordingly, the higher the ranking the less efficient is the tax.
Chart 5: Australia-wide efficiency rankings of state and territory taxes
Motor Vehicle Tax
Insurance Tax
Conveyance Duty
Payroll
Gambling
Land Tax
Municipal Rates
0 1
% change in consumption / %change in tax revenue
The analysis shows that of the primary sources of taxes and duties collected by state and
territory governments, motor vehicle taxes, insurance taxes and conveyance duty are the
least efficient when compared with the more efficient municipal rates, land taxes, gambling
and payroll taxes.
18
Analysis conducted in 2009 by Deloitte Access Economics in conjunction with the Insurance Council using the Access
Economics General Equilibrium model to assess the efficiency of state government taxes as part of project examining stamp duty
reform. The efficiency of an individual tax in the model is measured by the change in household consumption that comes from
raising an extra dollar of revenue via the tax while at the same time decreasing lump sum taxes by a dollar (equivalent to raising
Government transfers by a dollar). The consumption response is dependent on the size of the demand and supply elasticities
incorporated into the model.
114.1 Stamp duty is a regressive tax
In 2015, the Insurance Council sourced data on average premiums, average sums insured
and the number of policies at the post code level from members and combined this data with
Australian Taxation Office postcode-level income data to determine the average stamp duty
burden19 at the postcode level20.
Analysis of the data demonstrated that as incomes increase, the stamp duty burden tends to
decrease. This reflects the fact that households on higher incomes have a greater propensity
to reduce premiums (for a given sum insured) by adopting self-insurance strategies such as
increased deductibles or implementing household mitigation strategies.
The regressive nature of insurance stamp duties should be an important equity issue for
policy makers.
4.2 Stamp duty reforms
In the past two years the NSW and Victorian governments announced stamp duty exemptions
for several forms of insurance covers.
In NSW, a stamp duty exemption for lenders’ mortgage insurance took effect from 1 July 2017
while exemptions for certain small business and crop and livestock insurance covers took
effect from 1 January 2018.21 In Victoria, stamp duty exemptions for certain crop, livestock and
agricultural machinery insurance covers took effect from 1 July 2017.22
While only a start on reform, the Insurance Council strongly supports the policy goals
underpinning these important exemptions, chiefly as they collectively contribute to helping
address the issue of underinsurance and non-insurance in Australia, which can have a
devastating financial impact on people’s lives.
The Insurance Council’s members have invested significant resources in complying with the
NSW and Victorian stamp duty exemptions. Insurers have been required to implement
extensive changes and needed considerable time to develop, test and implement new
systems, largely reflecting the complexity of the insurance covers that fall within scope of the
exemptions. For example, many crop and livestock risks can be insured under generic
commercial product lines (such as grouped or blanket commercial property covers), rather
than specific, stand-alone agricultural lines. Because of this, insurers have typically needed
to significantly alter systems to apply the exemptions in accordance with the new laws.
Implementing the exemptions has been a challenging experience for industry, particularly in
light of the relatively short timeframes provided by governments and the complex nature of
many of the insurance covers. The Insurance Council believes that more thorough industry
consultation would have helped to facilitate a smoother transition process for all parties
involved. For example, earlier consultation would have provided Insurance Council members
with a better opportunity to identify potential technical challenges and work with governments
on possible solutions. Given these experiences, the Insurance Council encourages all State
19
Stamp duty burden is defined as total stamp duty paid divided by income for each Australian post code.
20
Aggregated member data from Insurance Statistics Australia database for the Insurance Council’s submission in response to the
Australian Government’s Tax Discussion Paper. June 2015.
21
See Revenue NSW website.
22
See Victorian State Revenue Office website.
12and territory governments, in developing any insurance stamp duty exemptions, to consult
early on any proposed changes and provide a sufficient time frame for industry
implementation.
4.3 Government reliance on insurance taxation revenue
The Insurance Council examined the total insurance taxation revenue collected by each state
and territory government over the past 12 financial years (2007-08 to 2018-19) and the
forecasted collections from financial year (FY) 2019-20 to FY2022-2023.
Over the past 12 years, state and territory governments together collected $54.7 billion. NSW
collected the most revenue at $18.2 billion, followed by Victoria ($15.7 billion), reflecting the
higher number of dwellings in each state and the growth in population and new housing
developments. The ACT collected the least ($314 million). This is broken down in Chart 7 (on
page 15).
As illustrated in Chart 6 below, over the past 12 years, each state and territory governments’
insurance taxation revenue has steadily increased. The total insurance taxation revenue
collected in FY2007-08 was $3.41 billion and $5.41 billion in FY2018-19, an increase of 58.6
per cent. This is projected to increase another 22.0 per cent in forecasts to FY2022-23.23 The
only state or territory that experienced any notable decline in collections over these periods is
Victoria in FY2013-14. This occurred due to the abolition of the insurance-based Fire Services
Levy.
23
Estimated percentage increase in total forecasted insurance taxation revenue from FY2018-19 to FY2022-23 for the states and
territories that published forecasted insurance revenue figures (NSW, Victoria, Queensland, WA and SA. ACT abolished stamp
duties in FY2016-17).
13Chart 6: State and territory government insurance duties and levies collected and
forecasted between financial years 2007-2008 and 2022-23 ($ million)
Source: Budget and forecast figures retrieved by the Insurance Council from each respective state and territory’s budget papers,
for all financial years inclusive of 2007-08 to 2018-19 (current).
14Chart 7: State and territory government insurance duties and levies collected between
financial years 2007-2008 and 2018-19 ($ million)
Source: The Insurance Council retrieved budget and forecast dollar amounts from each respective state and territory’s budget
papers, for all financial years inclusive of 2007-08 to 2018-19 (current).
155. Alternative model for revenue collection
Proposals to abolish insurance duties and levies, inevitably raise the question of alternative
sources of revenue. A decision to reform an inefficient tax which is diminishing community
welfare would be justifiable on its economic merits alone.
However, given the practical considerations in forgoing such a significant source of revenue,
an alternative is to replace insurance duties with a commensurate increase in a broad-based
property levy subject to safeguards as to its impact.
The Insurance Council’s research presented earlier found that this would result in an increase
in real private consumption and a net increase in revenue collected by each state and territory
overall. As shown earlier in Chart 5, a broad-based municipal or land tax is highly efficient
when compared with other possible sources of taxation revenue, including taxes on insurance.
The efficiency rankings highlight the scope for economic gain if state and territory governments
were to shift the composition of their taxation revenue away from transaction taxes on
insurance to taxes of a more fixed nature, such as municipal rates and land taxes.24
The Insurance Council respectfully submits that state and territory governments should
implement a tax reform strategy designed to shift their reliance from inefficient, narrow-based
transaction taxes to broad-based, more efficient taxes.
Provided there is adequate consideration of each jurisdiction’s specific characteristics, the
Insurance Council is confident that governments will be able to implement an effective broad-
based property levy in the same manner most had transitioned away from insurance-based
emergency services levies.
For example, in Queensland, the emergency services levy incorporates stipulated risk factors
depending on the activity carried out on the property; in Western Australia, the levy is a
function of service levels with minimum payments and maximum caps in place; South Australia
employs a land-use factor for its emergency service calculation. The fire services property levy
in Victoria is made up of a residential or commercial fixed charge and a variable charge
component. The variable charge is calculated by applying the appropriate land use
classification rate25 to the capital improved value of the land.
24
This is consistent with the understanding in the Henry Tax Review and the IPART State Tax Review. The policy objective of
shifting state taxes away from transactional taxes to taxes on immobile bases was also discussed at the Commonwealth Taxation
Forum in October 2011.
25
The State Revenue Office of Victoria uses 12 variable levy rates; a metropolitan and regional rate for 6 property classifications.
166. Conclusion
Many federal, state and territory government reviews and inquiries have recommended to
abolish insurance-based taxes across Australia. In recent years these have included the
Australian Government’s Review of Australia’s Future Tax System (the Henry Tax Review), the
NSW Independent Pricing & Regulatory Tribunal Review into State Taxation, the 2009
Victorian Bushfires Royal Commission, the NSW Government 2012 review: Funding our
Emergency Services, ACT Review of Taxation, the GST Distribution Review26 and Productivity
Commission reports.27
A strong body of economic analysis consistently demonstrates the inequities and economic
inefficiencies of taxation on insurance, including emergency services levies.
There are numerous examples across the states and territories that exhibit the successful
reform of insurance-based taxes for potential social and fiscal benefit.
Broad-based taxation remains the most economically effective, equitable and efficient method
to fund Australia’s state and territory governments. Transaction-based insurance duties are
distortionary to pricing and reduce the affordability and take-up of insurance.
Insurance taxes create an incentive for the policy holder not to insure by penalising them for
effectively managing their risks. Accordingly, the imposition of insurance-based taxes
exacerbates the serious problem of non-insurance and underinsurance. This ultimately
increases the financial exposure to all levels of government when providing recovery
assistance during catastrophic events
The Insurance Council urges state and territory governments to commit to and prioritise the
abolition of insurance-based taxes. This would immediately improve insurance affordability and
increase the take-up of insurance. Furthermore, it would reduce the need for government
funding in the aftermath of natural disasters, thereby shifting the burden of disaster recovery
from the public to private sector.
State and territory governments have the opportunity, through the removal of insurance taxes,
to strengthen the long-term integrity of their revenue bases.28
26
See GST Distribution Review, Final Report. October 2012.
27
Multiple Productivity Commission (PC) reports have recommended the abolishment of insurance-based taxes including Rec 4.8
– Natural Disaster Funding Inquiry (December 2014); Rec 4.8 – Shifting the Dial: 5 Year Productivity Review (October 2017) and;
Rec 14.3 – Inquiry Report; Competition in the Australian Financial System (August 2018).
28
For example, the PC’s October 2017 Draft Report on its Inquiry into Australia’s system of horizontal fiscal equalisation
underpinning the distribution of GST revenue to the states and territories.
177. Appendix
Total general insurance taxes and levies collected ($ million) –
Actual and Projected
18Change (%) in insurance tax collected (blue) Vs Change (%) in CPI, 200-08 to
2018-19 (red)
Year-on-year change (%) in insurance tax collected (blue) vs CPI (red) –
Actual and Projected (dotted)
1920
You can also read