2019 Full Year Results Presentation
←
→
Page content transcription
If your browser does not render page correctly, please read the page content below
2019 Full Year Results
Presentation
22 August 2019
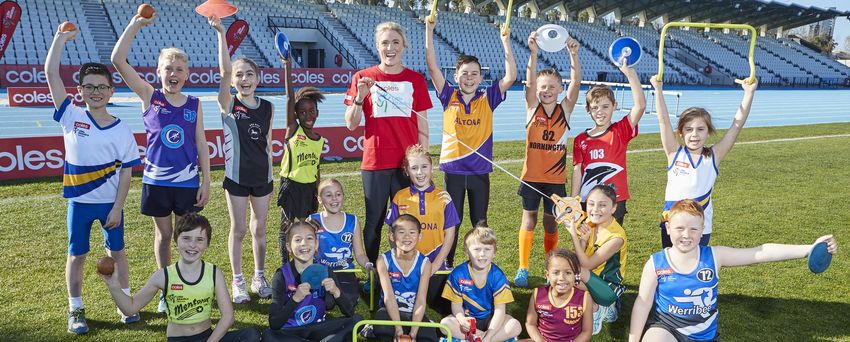
Sally Pearson and Coles Little Athletics Fund Community recipients. Since November 2018, Coles has provided more than $800,000 in
grants to 217 Little Athletics centres nationally
2019 Full Year Results Presentation
22 August 2019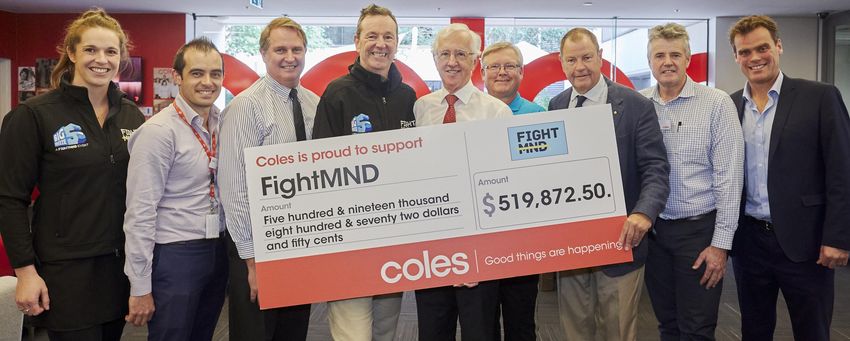
Disclaimer
This presentation contains summary information about Coles Group Limited (ACN 004 089 936) and its related bodies corporate (together, Coles) and Coles’ activities as at the date
of this presentation. It is information given in summary form only and does not purport to be complete. It should be read in conjunction with Coles’ other periodic corporate reports
and continuous disclosure announcements filed with the Australian Securities Exchange (ASX), available at www.asx.com.au
This presentation is for information purposes only and is not a prospectus or product disclosure statement, financial product or investment advice or a recommendation to acquire
Coles shares or other securities. It has been prepared without taking into account the investment objectives, financial situation or needs of individuals. Before making an investment
decision, prospective investors should consider the appropriateness of the information having regard to their own investment objectives, financial situation and needs and seek legal,
taxation, business and/or financial advice appropriate to their circumstances. Past performance is no guarantee of future performance.
No representation or warranty, express or implied, is made as to the fairness, accuracy, completeness or correctness of the information, opinions and conclusions contained in this
presentation. To the maximum extent permitted by law, none of Coles or its directors, employees or agents, nor any other person, accepts liability for any loss arising from the use of
this presentation or its contents or otherwise arising in connection with it, including, without limitation, any liability from fault or negligence on the part of Coles or its directors,
employees, contractors or agents.
This presentation contains forward-looking statements in relation to Coles, including statements regarding Coles’ intent, belief, goals, objectives, initiatives, commitments or current
expectations with respect to Coles’ business and operations, market conditions, results of operations and financial conditions, and risk management practices. Forward-looking
statements can generally be identified by the use of words such as ‘forecast’, ‘estimate’, ‘plan’, ‘will’, ‘anticipate’, ‘expect’, ‘may’, ‘believe’, ‘should’, ‘intend’, ‘outlook’ and
‘guidance’ and other similar expressions.
The forward-looking statements are based on Coles’ good faith assumptions as to the financial, market, regulatory and other relevant environments that will exist and affect Coles’
business and operations in the future. Coles does not give any assurance that the assumptions will prove to be correct. The forward-looking statements involve known and unknown
risks, uncertainties and assumptions and other important factors, many of which are beyond the control of Coles, that could cause the actual results, performances or achievements
of Coles to be materially different to future results, performances or achievements expressed or implied by such statements.
Readers are cautioned not to place undue reliance on forward-looking statements, which speak only as at the date of the presentation. Except as required by applicable laws or
regulations, Coles does not undertake any obligation to publicly update any of the forward-looking statements or to advise of any change in the assumptions on which any such
statement is based.

Changes to the reporting period
Coles has adopted a retail calendar for statutory reporting purposes. Retail calendars are used by a number of ASX listed and global retailers and enable greater alignment
between external statutory results and the way the business is reported and managed internally.

Reporting calendars
The change to a retail calendar has been applied prospectively from 1 July 2018 for statutory reporting purposes. The prior corresponding period statutory results reflect a Gregorian
calendar and have not been restated. Coles’ statutory results will fully transition to a retail calendar for both the current and comparative financial periods in 1H21.
Under a Gregorian calendar, the annual reporting period is 12 months (from 1 July to 30 June), whilst under a retail calendar the reporting period is based on a defined number of
weeks, with the annual reporting period ending on the last Sunday in June.

Non-IFRS financial information
To support an understanding of comparable business performance, this Results Release and the associated 2019 Full Year Results Presentation present results as follows:
• on a retail calendar basis – given the existence of a 53rd week in FY19, Coles has opted to disclose retail results for 52 weeks applied consistently for the current and comparative
    period.
• on a continuing operations basis – excluding the impact of Kmart, Target and Officeworks which were transferred to Wesfarmers as part of the demerger. The statutory results
    presented in Coles’ Appendix 4E Preliminary Final Report include the results of discontinued operations; and
• excluding significant items – the provision of $146 million relating to Supply Chain Modernisation, the $137 million gain from the New Alliance Agreement with Viva Energy, the
    $133 million gain associated with establishment of the Queensland Venue Co Pty Ltd joint venture and the $50 million net tax credit relating to Coles’ decision to form an income
    tax consolidated group. These significant items are disclosed in Coles’ Financial Report for 30 June 2019. The statutory results include significant items.

Balance sheet and cash flow information presented in this Results Release and the associated 2019 Full Year Results Presentation is consistent with the information disclosed in the
statutory presentation in the Appendix 4E Preliminary Final Report. Retail calendar disclosures constitute non-IFRS information which has not been audited but is based on IFRS
information where available. Coles’ external auditors have performed agreed upon procedures relating to the adjustments between the statutory and retail calendar profit and loss
disclosures for the current and prior corresponding period. Due to rounding, numbers presented throughout this document may not add up precisely to the totals provided and                  1
percentages may not precisely reflect the absolute figures.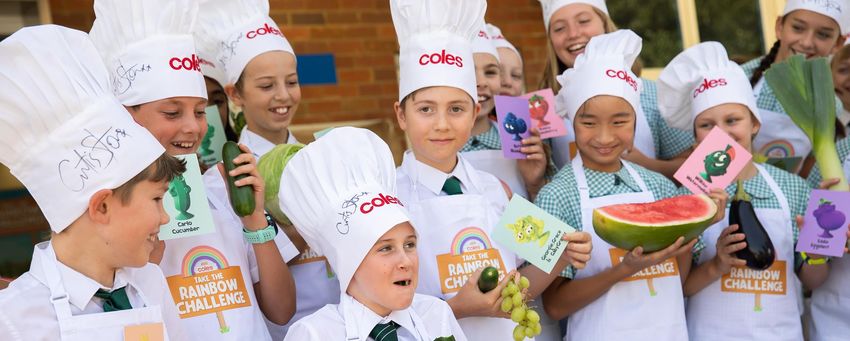
Graeme Beswick (centre), a Coles team member of 53 years, and Sabah Hermes, a Coles team member of 35 years, with store
manager Steve Filianos at the launch of our recently reopened store in Prahran, Victoria

FY19 summary
FY19 financial highlights
Full year Supermarkets EBIT growth, final and special dividend determined

    Total sales revenue¹                                                 EBIT (retail basis)¹                                            Supers comp sales
                                                                                                                                              growth
                                $35.0bn                                                            $1.3bn                                                        47 quarters of
                             3.1% vs. pcp                                                     (8.1)% vs. pcp                                                      consecutive
                                                                                                                                                                    growth

    Operating cash flow²                                                          Net capex                                                          Dividend3
                               $2.2bn                                                            $770m                                                          35.5 cents per
                             110% cash                                                     on an accrued                                                         share fully-
                             realisation                                                       basis                                                               franked

      Net financial debt                                              Team engagement                                                                    Safety
                               $520m                                                               +3pp                                                      27.4 TRIFR4
                           pre dividend                                                 on MySay survey                                                 20% improvement
                             payment                                                      since Nov-17                                                       vs. pcp

1 Retail calendar 52-week basis, sales revenue excludes Fuel sales and Hotels. EBIT excludes Hotels and significant items of: 1) $146m relating to Supply Chain Modernisation; 2) $137m
   gain from the New Alliance Agreement with Viva Energy; and 3) $133m net gain associated with the establishment of Queensland Venue Co Pty Ltd.
2 Cash flows have been normalised for demerger items relating to self-insurance provisions and intercompany balances.
3 The Coles Board has determined a fully-franked total dividend of 35.5 cents per share comprising a final dividend of 24.0 cents per share and a special dividend of 11.5 cents per

   share which covers the period from 28 November 2018 to 30 June 2019. The relevant payout ratios are contained in the accompan ying Results Release.
4Total Recordable Injury Frequency Rate.
                                                                                                                                                                                          3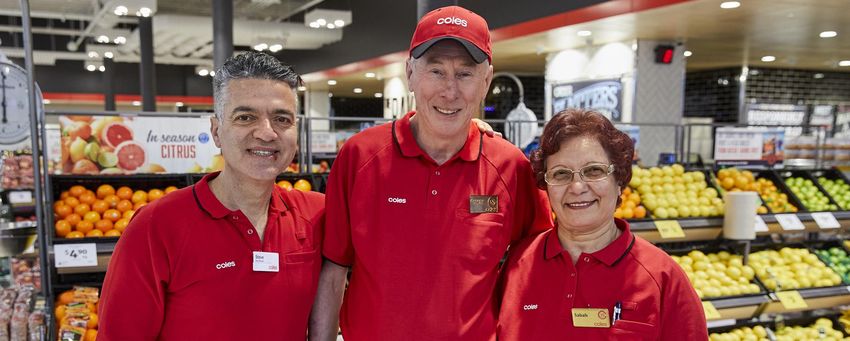
Other business highlights
FY19 was a year of significant achievement for our team members, shareholders,
suppliers and community partners

  ASX listed following a successful demerger from Wesfarmers

  Refreshed strategy to “sustainability feed all Australians to help them lead healthier,
  happier lives”

  Strategic partnerships with Witron, Ocado, Optus, SAP

  Important transactions including a New Alliance Agreement with Viva Energy and
  Queensland Liquor JV with Australian Venue Co

  Great place to work with improvement in both team member safety and engagement
  scores

  $115m contributed to community and charity partners including Coles Nurture Fund,
  SecondBite, Redkite and FightMND

                                                                                            4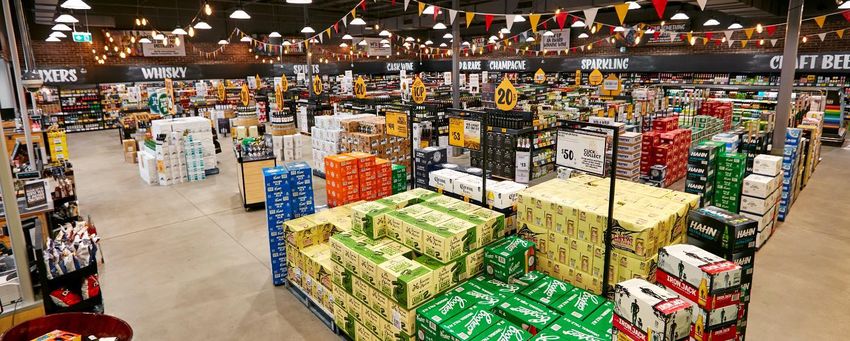
Coles’ purpose, vision and strategy

                                           Our vision.
                                  Become the most trusted
                                retailer in Australia and grow
                                long-term shareholder value

                                                                 5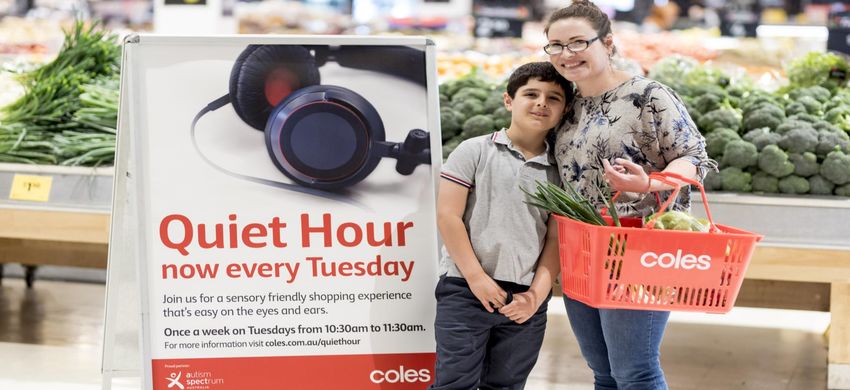
Coles’ strategic differentiators

               ▪ Win in online food and drinks with
                 an optimised store and supply
                 chain network

               ▪ Be a great value Own Brand
                 powerhouse and destination for
                 health

               ▪ Achieve long-term structural cost
                 advantage through automation
                 and technology partnerships

               ▪ Create Australia’s most sustainable
                 supermarket

               ▪ Deliver through team engagement
                 and pace in execution

                                                       6
Progress against strategy: Inspire customers
Through best value food and drink solutions to make lives easier.
                              ▪   Increased customer engagement through successful marketing
                                  campaigns including Coles Little Shop, Fresh Stikeez and Fresh
                                  Containers

                    and       ▪   >1,200 Own Brand products introduced in FY19 with 90 winning awards
                                  for their quality. 110 tonnes of salt and 150 tonnes of sugar removed from
                                  Own Brand products over the past year

                    trials    ▪   Coles Online profitable for the 1st time in 20-year history with sales of
                                  $1.1 billion, growth of 30% and >1,000 Click & Collect locations

                              ▪   Launched convenience range with 200 new products

                              ▪   Tools for store tailoring in place for Supermarkets with the implementation
                                  underway in Express and Liquor

                              ▪   Food-to-go convenience offering rolled out to 93% of Express stores
                                  delivering healthy meal solutions

                              ▪   64 new Exclusive Liquor Brand lines launched in FY19 and a total of 189
                                  medals and awards received over the year

                              ▪   Continued successful roll-out of First Choice Liquor Market renewals

                              ▪   Export growth of 36% with a strategic team established and dedicated
                                  to developing meat export business

                              ▪   flybuys established as an independent standalone business with 5.7%
                                  YoY growth in active households to 6.6 million

                                                                                                                7
Progress against strategy: Smarter selling
Through efficiency and pace of change.

                            ▪   Appointment of Group Executive Transformation to oversee
                                multi-year program of change

                            ▪   Wearable technology and deli easy ordering rolled out
                                improving loss and availability

                            ▪   Transport hubs established in WA and VIC with backhaul
                                increased by 57% and 60% respectively

                            ▪   Strategic partnerships announced with SAP and Optus to
                                accelerate technology-led transformation of stores, support
                                centres and supply chain

                            ▪   Optimised store network with new tailored store formats and 4
                                new stores in growth corridors including Coomera Town Centre
                                in QLD and Mernda in VIC

                            ▪   Commenced cost-out initiatives with the announced
                                reduction of 450 roles in Store Support Centre (SSC)

                                                                                                8
Progress against strategy: Win together
With our team members, suppliers and communities.
                           ▪   20% reduction in TRIFR in FY19, improved team member
                               MySay score by 3 percentage points

                           ▪   >4,100 Indigenous team members – Australia’s largest private
                               sector employer of Indigenous people. Further commitment
                               to increase to 5,500 by 2023

                           ▪   $16 million in drought relief for farmers via Nurture Fund, Dairy
                               Drought Relief Fund and Country Women’s Association
                               Drought Appeal

                           ▪   Quiet Hour expanded to 261 stores nationally, offering a low
                               sensory shopping experience to assist customers with autism

                           ▪   Removal of 1.7 billion single-use plastic bags with customers
                               choosing reusable Community Bags and raising $2.5 million
                               for charities

                           ▪   Roll-out of LED lighting to all supermarkets scheduled for
                               completion in 1H20, with 119 stores completed in FY19. At the
                               end of FY19, 30 supermarkets have solar power with plans to
                               install solar in a further 38 supermarkets in FY20

                           ▪   Continued support of SecondBite, Redkite, FightMND

                                                                                                   9
Coles’ strategy tracker
KPIs Progress
Reduced safety TRIFR ▪ 20% reduction in YoY TRIFR
Increased team member
▪ Improved MySay team engagement score by 3 percentage points
engagement
Improved customer
▪ Customer satisfaction1 stable since Q2 at 87.8%
satisfaction
▪ Supermarkets headline sales revenue growth of 3.2%
Sales growth at least in- ▪ We monitor two sources: Nielsen Total Store (excl. non-food) Market Growth
line with the market of 2.1%; ABS Total Market Growth of 4.3%2. The average of the two indices is
3.2%
▪ Supermarket sales density increased by 1.5% YoY to $16,704 per square
Increased sales density metre
▪ Liquor sales density increased by 1.4% YoY to $14,354 per square metre
$1bn cost-out by FY23 ▪ Announced 450 role reduction in SSC
▪ Supermarkets and Liquor EBIT growth
EBIT growth ▪ Group EBIT decline due to lower Express fuel volumes and corporate costs
associated with being a standalone ASX company
Cash realisation3 >100% ▪ Strong cash realisation of 110%
1 Customer satisfaction based on Tell Coles data.
2 Source: Nielsen Market Data, based on MAT to 13/7/2019; ABS Retail Trade Figures, TABLE 11. Retail Turnover, State by Industry Subgroup, Original. Total Food
Retail excl. Liqour (Smkt & Grocery plus Other Specialised Food Retailing)
3 Cash conversion is calculated as operating cash flow excluding interest and tax, divided by EBITDA (excluding significant items). 10Coles’ Own Brand range continues to lower the cost of living for our customers and now represents a $9 billion business. Wellness Road is a health focused sub-brand launched in May 2019 Group financial overview
FY19 results – Group
      EBIT (excl. Hotels and pre-significant items) down 8.1% driven by lower Express fuel
      volumes and corporate costs associated with being a standalone ASX listed company
                                                                                                      Statutory result

        $m                                                                                                 FY19                        FY18                   Change

        Sales revenue3                                                                                38,176                      38,934                      (1.9)%
        EBIT                                                                                            1,467                       1,479                     (0.9)%
        EBIT margin                                                                                      3.8%                        3.8%                       0 bps

                                                                                     Retail result (excl. Fuel sales and Hotels)

        $m                                                                                                 FY19                            FY18               Change
                                                                                                      (52 weeks)                      (52 weeks)

        Sales revenue1,3                                                                              35,001                          33,961                     3.1%
        EBIT pre-significant items2                                                                    1,325                           1,442                  (8.1)%
        EBIT margin pre-significant items2                                                               3.8%                            4.3%               (48) bps

            Note: Segment financials in this presentation are shown on a retail calendar basis, pre-significant items

1 Fuel sales have been excluded from Retail result as Express no longer records fuel sales as sales revenue under the New Allia nce Agreement with Viva Energy. Retail
   sales revenue also excludes Hotels.
2 Significant items: 1) $146m relating to Supply Chain Modernisation; 2) $137m gain from the New Alliance Agreement with Viva Energy; and 3) $133m net gain

   associated with the establishment of Queensland Venue Co Pty Ltd.
3 FY18 sales revenue has been restated due to a change in the classification of the cost of flybuys points from cost of sales to sales revenue.
                                                                                                                                                                         12
FY19 results – segment financials
Supermarket EBIT growth for the first time since FY16
Retail basis, pre-significant items
FY19 FY18
$m (52 weeks) (52 weeks) Change
Sales revenue
Supermarkets 30,890 29,919 3.2%
Liquor 3,063 3,006 1.9%
Express 1,048 1,035 1.2%
Group sales revenue (excl. Fuel sales and Hotels) 35,001 33,961 3.1%
Fuel sales 3,011 4,680 (35.7)%
Hotels 140 163 (14.2)%
Group sales revenue 38,152 38,803 (1.7)%
EBIT
Supermarkets 1,183 1,157 2.2%
Liquor 120 111 8.4%
Express 50 161 (69.3)%
Other¹ (28) 13 N/M
Group EBIT (excl. Hotels and significant items) 1,325 1,442 (8.1)%
Hotels 13 17 (26.0)%
Group EBIT pre-significant items 1,338 1,459 (8.3)%
Note: The results for the year and the prior corresponding period reflect the elimination of a $30m brand fee previously charged from Supermarkets to Express.
¹ Includes corporate costs, Coles’ 50% share of flybuys’ net profit, and gains and losses from the property portfolio.
13Normalised cash flow
Strong cash realisation of 110%
Normalised cash flow¹ Cash realisation²
(non-IFRS) Coles will continue to report cash realisation excl.
$m FY19 FY18 interest and tax and will target >100% in future years.
Statutory EBIT pre-significant
1,343 1,479
items
110% 113%
Depreciation & amortisation 640 650
EBITDA pre-significant items 1,982 2,129
Change in working capital 81 201
Change in provisions & other 125 74
Operating cash flow (excl.
2,188 2,404
interest and tax)
FY19 FY18
1 Cash flows have been normalised for demerger items relating to self-insurance provisions and intercompany balances.
² Cash realisation is calculated as operating cash flow excluding interest and tax, divided by EBITDA (excluding significant items). 14Capital expenditure
FY19 net capital expenditure in line with guidance of $700m to $800m, increased
to drive long term growth
Capital expenditure breakdown Key capital expenditure initiatives
Statutory basis Store renewals ▪ 51 supermarket and 52 liquor
$m FY19 FY18 renewals
▪ 259 Coles Express renewals
Store renewals 146 82
including food-to-go (FTG) roll-
out
Growth initiatives 191 198
Growth ▪ New stores in supermarkets
Efficiency initiatives 297 116 initiatives (22) and Liquor (27)
▪ Expansion in Online including
Maintenance 259 248 120 Click & Collect locations
Gross operating capital Efficiency ▪ Supply Chain Modernisation
893 645 initiatives
expenditure ▪ Store IT improvements
including ACO investments
Maintenance ▪ Refrigeration and electrical
Property acquisitions 146 127 ▪ Store technology investments
Property divestments (269) (210)
Net capital expenditure 770 561
Going forward Coles intends to focus on gross operating capital expenditure on an accrued basis
15Balance sheet
Strong balance sheet with investment grade credit metrics
Balance sheet summary
(non-IFRS)
30 Jun 30 Dec Net working capital
$m 2019 2018 ▪ Inventory days of 25; trade payable days
Cash and cash equivalents3 940 5823 of 27 2
Financial debt
Inventories 1,965 2,429
▪ Net debt of $0.5bn and balance sheet
Trade and other receivables3 360 4623 leverage ratio of 0.5x¹
Trade and other payables (3,380) (3,991) ▪ Gross debt reduced to $1.5bn due to
strong cash generation and proceeds
Working capital (115) (518) from the New Alliance Agreement
Property, plant and ‒ Initial gross drawn debt at the time of
equipment, and equity 4,331 4,213 demerger was $2.0bn
investments
AASB 16 lease accounting impact
Intangibles 1,541 1,660
▪ Refer Slide 18 for more detailed disclosures
Provisions (1,341) (1,292) on impact of AASB 16
Other 37 (28)
Capital employed 4,452 4,035
Interest bearing liabilities (1,460) (1,630)
Net tax balances 365 267
Total net assets 3,357 2,672
1 Calculated as gross debt less cash at bank and on deposit ($1,050m), divided by EBITDA pre-significant items ($1,982m).
2 Trade payable days as at 30 December 2018 have been restated from 29 to 27.
3 Debit and credit card transactions not yet settled have been reclassified from trade receivables to cash and cash equivalents.
16Capital management
Disciplined approach with attractive fully-franked dividend
Dividend Bank facility maturity profile ($m)
▪ Coles Board determined a fully-franked total
dividend of 35.5 cents per share, comprising a final
of 24.0 cents per share and a special dividend of 2,540
11.5 cents per share for the period from 28
November 2018 to 30 June 2019
1,310
Debt facilities
▪ Weighted average debt maturity of 4.6 years 150
provides funding certainty 342¹
‒ Undrawn facilities of $2.2bn, providing FY19 FY20 FY21 FY22 FY23 FY24 FY25 FY26
appropriate headroom Drawn Undrawn
▪ Coles is committed to diversify funding sources
over time to reduce refinancing risk Lease commitments ($m)
Lease commitments 5,228 10,576
▪ Disciplined management of off-balance sheet
leases
‒ Undiscounted lease commitments of $10.6bn 4,134
‒ Lease options provide Coles with flexibility to
extend tenure
1,214
Within 1 year 1 - 5 years More than Total
5 years
1 Includes bank guarantees.
17AASB 16 lease accounting update
▪ Coles to apply AASB 16 from 1 July 2019 using the Estimated impact of new
modified retrospective approach lease accounting standard
▪ Operating leases recognised on balance sheet as Balance sheet (1 July 2019)1
lease liabilities with corresponding right of use asset
Lease liability $8.5bn to $9.0bn
▪ Straight-line operating lease rental expense Right of use asset $7.2bn to $7.7bn
replaced by straight-line depreciation of right of
use asset and interest charge on reducing lease
liability balance
▪ Completed indicative assessment of AASB 16 and Income Statement (full year 2019 impact)
the estimated impact on FY19 financials
EBITDA $1.20bn to $1.25bn
▪ Positive impact on EBIT of $400m to $450m
▪ Positive impact on Profit before tax of $0 to Depreciation $0.75bn to $0.80bn
$50m
▪ No impact on cash, debt covenants or credit EBIT $0.40bn to $0.45bn
ratings Finance costs $0.40bn to $0.45bn
▪ Estimated pro forma impact may differ from Profit before tax $0 to $0.05bn
actuals due to changes in lease portfolio
▪ Other operating items (e.g. EBIT margin) and credit
metrics will move materially. Coles will provide
metrics on a consistent basis to assist with
comparative analysis
1 Net impact, adjusted for deferred tax and reversal of current lease accounting recognised against retained earnings. 18Summary of significant items
P&L line
Item Comment $m
item impact
Provision for lease exit costs and redundancies
Supply Chain
Other expenses associated with the closure of a number of existing (146)
Modernisation
DCs
New Alliance
Cash gain in relation to payment from Viva Energy
Agreement Other income 137
for forgoing the retail fuel margin
with Viva Energy
Net non cash gain related to the establishment of
the joint venture, comprising a loss on disposal of
Incorporated Joint
Other income Spirit Hotels, transaction costs, and a gain relating 133
Venture with AVC
to the transfer of retail assets and the fair value of
Coles’ interest in QVC
Tax consolidation Income tax Relates to Coles’ decision to form an income tax
50
adjustment expense consolidated group
19Fresh Stikeez and the Rainbow Challenge were loved by our customers encouraging children to eat more fresh fruit and vegetables! Supermarkets
Supermarkets key metrics
47 consecutive quarters of comparable sales growth and positive full year
Supermarkets EBIT growth for the first time since FY16

   Total sales revenue                                      Comp sales growth                                              Sales per sqm

                           $30.9bn                                                   2.7%                                                    $16,704
                       +3.2% vs. pcp                                                vs. pcp                                               +1.5% vs. pcp

      Own Brand sales                                        Coles Online sales                                    Customer satisfaction

                           +5.9%                                                     +30%                                            87.8% (4Q19)
                           vs. pcp                                                   vs. pcp                                             Flat on 2Q19

          Gross margin                                                       EBIT                                             EBIT margin

                             24.8%                                                 $1,183m                                                      3.8%
                      +20bps vs. pcp                                             +2.2% vs. pcp                                           (4)bps vs. pcp

Note: The results for the year and the prior corresponding period reflect the elimination of a $30m brand fee previously charged from Supermarkets to Express.   21
Supermarkets FY19 results
Strong sales and operating leverage
FY19 results Key commentary
Retail basis (52 weeks) ▪ Comparable sales growth of 2.7% driven
$m FY19 FY18 Change by online and successful collectable
Key P&L items campaigns
Sales revenue 30,890 29,919 3.2% ▪ A continued investment in lowering
prices to embed trusted value for our
EBITDA 1,735 1,714 1.2% customers saw underlying price
EBIT 1,183 1,157 2.2% deflation excluding tobacco and fresh
of 1.2% for FY19
Key metrics ▪ Gross margin increased by 20bps due to
strategic sourcing and continued
Comparable sales growth (%) 2.7 1.1 159bps
execution of Own Brand strategy
Gross margin (%) 24.8 24.6 20bps
▪ 2017 Supermarkets EBA has been
CODB (%) (20.9) (20.7) (24)bps implemented and exited single-use
plastic bags
EBIT margin (%) 3.8 3.9 (4)bps
▪ EBIT increased by 2.2% driven by higher
Sales per square metre ($) 16,704 16,452 1.5% sales and improved gross margin
Price in/(de)flation1 (%) 0.8 (1.3) 208bps ▪ Smarter Selling restructuring provision of
Price in/(de)flation excl. $19m included in 2H19 EBIT; excluding
(1.2) (1.9) 71bps
tobacco and fresh1 (%) provision, flat EBIT margin in FY19
Note: The results for the year and the prior corresponding period reflect the
elimination of a $30m brand fee previously charged from Supermarkets to
Express. FY18 sales revenue has also been restated due to a change in the
classification of the cost of flybuys points from cost of sales to sales revenue.
1 Due to a change in methodology, Inflation / (deflation) historical figures have been restated. Details can be found in the Results Release.
22A recently converted First Choice Liquor Market in Caroline Springs, Victoria Liquor
Liquor key metrics
Strong EBIT growth driven by Exclusive Liquor Brand penetration

      Total sales revenue                                        Comp sales growth¹                     Exclusive Liquor
                                                                                                             Brand
                                $3.1bn                                                       1.2%
                           +1.9% vs. pcp                                                    vs. pcp
                                                                                                            17.9% of sales
                                                                                                             +44bps vs. pcp

           Award winning                                               FCLM renewals                    Number of stores¹
              quality
                   189                                                                      30%                     910
                                                                                       of the fleet
                      ELB medals and                                                                             +11 vs. FY18
                                                                                        renewed
                      awards in FY19

             Gross margin                                                          EBIT2                  EBIT margin

                                 22.3%                                                      $120m                   3.9%
                          +41bps vs. pcp                                                +8.4% vs. pcp          +23bps vs. pcp

1   Excludes Hotels.
2   Prior corresponding period EBIT includes $2 million gain in relation to a one-off asset sale.                               24
Liquor FY19 results
Revenue growth driven by First Choice Liquor Market roll-out
FY19 results Key commentary
Retail basis (52 weeks) ▪ Comparable sales growth of 1.2%
$m FY19 FY18 Change positively impacted by the First Choice
Liquor Market roll-out
Key P&L items
Sales revenue 3,063 3,006 1.9%
▪ Slowdown in Liquorland growth driven
by moderating growth in the broader
retail liquor market and end of renewal
EBITDA 153 146 4.5%
program
EBIT 120 111 8.4% ▪ First Choice Liquor Market renewal
program continued, driving sales
performance ahead of the rest of the
Key metrics fleet
Comparable sales growth (%) 1.2 1.8 (61)bps
▪ Vintage Cellars renewal program to
begin in 1H20
Gross margin (%) 22.3 21.9 41bps
▪ Gross margin increased by 41bps to
CODB (%) (18.4) (18.2) (18)bps 22.3% due to margin improvements
from Exclusive Liquor Brand and
EBIT margin (%) 3.9 3.7 23bps improved supplier collaboration
▪ 2H18 EBIT impacted by $2m gain
Note: Excludes Hotels. FY18 sales revenue has been restated due to a change
in the classification of the cost of flybuys points from cost of sales to sales
included in CODB related to a one-off
revenue. asset sale
25Coles Express food-to-go offering has been rolled out to 93% of stores, including Windsor, Victoria Express
Express key metrics
Sales and EBIT impacted by lower fuel volumes. New Alliance Agreement to
restore growth

      Total sales revenue                                    C-store comp sales                                                        EBIT
                                                                   growth
                              $1.0.bn                                                   0.1%                                                    $50m
                         excluding Fuel                                                                                                  as per previous
                                                                                       vs. pcp
                             sales1                                                                                                         guidance

       Food-to-go growth                                           2H weekly fuel                                         Number of sites
                                                                      volumes
                               12.4%                                      59.5mL                                                                  714
                                                                           volumes remained
                                vs. pcp                                                                                                      +3 vs. FY18
                                                                              broadly flat2

Note: The results for the year and the prior corresponding period reflect the elimination of a $30m brand fee previously charged from Supermarkets to Express.

1   Fuel sales have been excluded as Express no longer records fuel sales as sales revenue under the New Alliance Agreement with Viva Energy.
2   Fuel volumes remained broadly flat since the Agreement took effect to the end of FY19.
                                                                                                                                                                 27
Express FY19 results
Positive trends in food-to-go category, now rolled out to 93% of stores
FY19 results Key commentary
Retail basis (52 weeks) ▪ Convenience store (c-store)
$m FY19 FY18 Change comparable sales growth of 0.1%
Key P&L items driven by declining tobacco sales and
reduced traffic
Sales revenue (excl. Fuel sales)1 1,048 1,035 1.2%
EBITDA 76 187 (59.4)%
▪ Food-to-go remained the standout
EBIT 50 161 (69.3)% category with headline sales growing
by 12.4% YoY
Key metrics
▪ Weekly fuel volumes remained broadly
Comp. c-store sales growth (%) 0.1 1.6 (158)bps flat since the New Alliance Agreement
Weekly fuel volumes (mL) 60.9 70.0 (13.0)%
took effect to the end of FY19
Fuel volume growth (%) (13.0) (16.8) 388bps
▪ 4Q19 comparable fuel volumes of
Comp. fuel volume growth (%) (13.7) (17.8) 407bps (8.7)% YoY demonstrate continued
moderation of declines
Gross margin (%) 61.4 70.5 (909)bps
CODB (%) (56.7) (55.0) (175)bps
EBIT margin (%) 4.7 15.6 (1084)bps
Note: The results for the year and the prior corresponding period reflect the
elimination of a $30m brand fee previously charged from Supermarkets to
Express. FY18 sales revenue has also been restated due to a change in the
classification of the cost of flybuys points from cost of sales to sales revenue.
1 Fuel sales have been excluded as Express no longer records fuel sales as sales revenue under the New Alliance Agreement with Viva Energy. 28Representatives from Coles with Neale Daniher, Bill Guest, Jamie Howden and Bec Daniher from FightMND. Coles raised almost $520,000 for FightMND donating 10 cents from every Coles brand pork product sold between 8 May and 16 June Outlook
FY20 outlook

▪   By way of a Q1 FY20 trading update, Little
    Shop 2 has again resonated with our
    customers and is driving strong engagement

▪   As envisaged cycling the comparable sales
    growth from last year’s highly successful Little
    Shop campaign will be challenging given
    competitor activity in the market

▪   In Express, growth in fuel volumes has been
    encouraging following more competitive fuel
    pricing and the introduction of the Little Shop
    2 campaign. However, it will take time to
    build volumes to target levels, and as a result,
    Coles expects earnings growth under the
    New Alliance Agreement to remain subdued
    in FY20

▪   Coles made a number of statements relating
    to capex outlook, renewals, new stores and
    formats at the recent Investor Day in respect
    of FY20 and these remain unchanged. The
    Smarter Selling initiatives in FY20 are
    anticipated to deliver annualised benefits in
    excess of $150m                                    30
Sydney mother Sarah Miller with her nine-year-old son Cameron shop at Coles during Quiet Hour. In FY19, Coles expanded the roll-out of Quiet Hour to 261 supermarkets nationally Q&A
You can also read


