PERFORMANCE AMID HEADWINDS - Merck FY 2017 results Stefan Oschmann, CEO Marcus Kuhnert, CFO - Merck Group

Page created by Tommy Schultz
 
CONTINUE READING
PERFORMANCE AMID HEADWINDS - Merck FY 2017 results Stefan Oschmann, CEO Marcus Kuhnert, CFO - Merck Group
PERFORMANCE AMID
HEADWINDS
Merck FY 2017 results

Stefan Oschmann, CEO
Marcus Kuhnert, CFO

March 8, 2018
PERFORMANCE AMID HEADWINDS - Merck FY 2017 results Stefan Oschmann, CEO Marcus Kuhnert, CFO - Merck Group
Disclaimer

Cautionary Note Regarding Forward-Looking Statements and financial indicators
This communication may include “forward-looking statements.” Statements that include words such as “anticipate,” “expect,” “should,” “would,” “intend,” “plan,” “project,” “seek,”
“believe,” “will,” and other words of similar meaning in connection with future events or future operating or financial performance are often used to identify forward-looking statements. All
statements in this communication, other than those relating to historical information or current conditions, are forward-looking statements. We intend these forward-looking statements to
be covered by the safe harbor provisions for forward-looking statements in the Private Securities Litigation Reform Act of 1995. These forward-looking statements are subject to a number
of risks and uncertainties, many of which are beyond control of Merck KGaA, Darmstadt, Germany, which could cause actual results to differ materially from such statements.

Risks and uncertainties include, but are not limited to: the risks of more restrictive regulatory requirements regarding drug pricing, reimbursement and approval; the risk of stricter
regulations for the manufacture, testing and marketing of products; the risk of destabilization of political systems and the establishment of trade barriers; the risk of a changing marketing
environment for multiple sclerosis products in the European Union; the risk of greater competitive pressure due to biosimilars; the risks of research and development; the risks of
discontinuing development projects and regulatory approval of developed medicines; the risk of a temporary ban on products/production facilities or of non-registration of products due to
non-compliance with quality standards; the risk of an import ban on products to the United States due to an FDA warning letter; the risks of dependency on suppliers; risks due to product-
related crime and espionage; risks in relation to the use of financial instruments; liquidity risks; counterparty risks; market risks; risks of impairment on balance sheet items; risks from
pension obligations; risks from product-related and patent law disputes; risks from antitrust law proceedings; risks from drug pricing by the divested Generics Group; risks in human
resources; risks from e-crime and cyber attacks; risks due to failure of business-critical information technology applications or to failure of data center capacity; environmental and safety
risks; unanticipated contract or regulatory issues; a potential downgrade in the rating of the indebtedness of Merck KGaA, Darmstadt, Germany; downward pressure on the common stock
price of Merck KGaA, Darmstadt, Germany and its impact on goodwill impairment evaluations as well as the impact of future regulatory or legislative actions.

The foregoing review of important factors should not be construed as exhaustive and should be read in conjunction with the other cautionary statements that are included elsewhere,
including the Report on Risks and Opportunities Section of the most recent annual report and quarterly report of Merck KGaA, Darmstadt, Germany. Any forward-looking statements made
in this communication are qualified in their entirety by these cautionary statements, and there can be no assurance that the actual results or developments anticipated by us will be realized
or, even if substantially realized, that they will have the expected consequences to, or effects on, us or our business or operations. Except to the extent required by applicable law, we
undertake no obligation to update publicly or revise any forward-looking statement, whether as a result of new information, future developments or otherwise.

This presentation contains certain financial indicators such as EBITDA pre exceptionals, net financial debt and earnings per share pre exceptionals, which are not defined by International
Financial Reporting Standards (IFRS). These financial indicators should not be taken into account in order to assess the performance of Merck in isolation or used as an alternative to the
financial indicators presented in the consolidated financial statements and determined in accordance with IFRS. The figures presented in this statement have been rounded. This may lead
to individual values not adding up to the totals presented.

2
PERFORMANCE AMID HEADWINDS - Merck FY 2017 results Stefan Oschmann, CEO Marcus Kuhnert, CFO - Merck Group
Agenda

    Executive summary

    Strategic review

    Financial overview

    Outlook and guidance

3
PERFORMANCE AMID HEADWINDS - Merck FY 2017 results Stefan Oschmann, CEO Marcus Kuhnert, CFO - Merck Group
EXECUTIVE SUMMARY
PERFORMANCE AMID HEADWINDS - Merck FY 2017 results Stefan Oschmann, CEO Marcus Kuhnert, CFO - Merck Group
Highlights 2017

                   Healthcare – sound core business; successful launches of Mavenclad & Bavencio

    Execution on   Life Science – strong performance above the market amid ongoing integration
      strategy

                   Performance Materials – softness in Liquid Crystals; growth in ICM, Pigments & OLED

                   Organic sales growth of 3.8%; EBITDA pre almost stable despite FX headwinds

    Delivery of    Deleveraging remains focus and well on track; Net debt reduction of €1.4 bn
    financials

                   Delivered on Guidance

5
PERFORMANCE AMID HEADWINDS - Merck FY 2017 results Stefan Oschmann, CEO Marcus Kuhnert, CFO - Merck Group
2017 financial targets met through stringent business execution

                  2017 Guidance              FY 2017 Results

Net Sales          €15.3 – 15.7 bn                €15,327 m
                                                                  ✓
EBITDA pre         €4,400 – 4,600 m               €4,414 m
                                                                  ✓
    EPS pre        €6.15 – 6.50                   €6.16
                                                                  ✓
6
PERFORMANCE AMID HEADWINDS - Merck FY 2017 results Stefan Oschmann, CEO Marcus Kuhnert, CFO - Merck Group
Merck leveraged its capabilities to overcome headwinds

                                                            cOMMENTS
    Went the                                                • Stringent execution of core
                                                              activities in all three businesses
    extra mile…    Business        Operational    Hedging
                                                   gains
                                                            • Reduction in travel spend
                   discipline       Measures
                                                            • Increased focus on hiring activity
                                                              during second half of the year
                                                            • Liquid Crystal performance
                                                              burdens profitability within PM
                        Liquid Crystal
                                         FX Headwinds       • FX Headwinds increased
                        performance
                                                              significantly from mid of the year
    Headwinds to
                                                            • Hedging Gains driven by
    overcome…                                                 conservative 36 month rolling
                                                              hedging approach

7
PERFORMANCE AMID HEADWINDS - Merck FY 2017 results Stefan Oschmann, CEO Marcus Kuhnert, CFO - Merck Group
Organic growth in all regions

Regional breakdown of net sales [€ m]                                                                                              Regional organic development

                                                                          Europe          +1.1%                                    • Organic growth in Europe driven by
                                                                                           org.
                                                                                                                                     solid demand in Life Science and CH
                                                                                                                                     outweighing decline in Rebif
                                                       31%
                                                                                                                                   • Growth in North America from Life
                                                                                                                                     Science more than offsets Rebif decline
North America       +0.5%
                     org.                              FY 2017                                                                     • Asia-Pacific shows strong organic growth
                                                                                                                                     fueled by Healthcare, especially due to
                                                      Net sales:
                                                                               32%                                                   Glucophage repatriation, and Life Science
                                                     €15,327 m
                                        25%                                                     Asia-Pacific        +7.3%
                                                                                                                                     outweighing LC decline
                                                                                                                     org.
                                                                                                                                   • Very strong organic sales development in
                                                         8%      4%                                                                  LatAm and MEA driven across all major
                                                                                                                                     businesses, especially GM, CH, and Life
                                                                                                                                     Science
                    Latin America          +9.1%                       Middle East & Africa              +9.7%
                                            org.                                                          org.

       Totals may not add up due to rounding;
8      LC=Liquid Crystals; GM=General Medicine (includes CardioMetabolic Care & General Medicine and Others); CH=Consumer Health
PERFORMANCE AMID HEADWINDS - Merck FY 2017 results Stefan Oschmann, CEO Marcus Kuhnert, CFO - Merck Group
Dividend growth sustained

Dividend1 development 2011-2017                                                                                                                  2017 dividend

                                                                                                                                                 • Dividend of €1.25 (+4% YoY)
                                                                                                                                                   per share proposed2 for 2017
                                                                                                                   1.25                          • 20.3% of EPS pre
                                                                                                 1.20
                                                                               1.05                                                              • Sustainable dividend growth
                                                             1.00
                                           0.95                                                                                                  • Dividend yield3 of 1.4%
                         0.85
     0.75

             1                   1                 1                                                                       2
      2011               2012              2013              2014              2015              2016              2017

     1Adjusted   for share split, which has been effective since June 30, 2014; 2Final decision is subject to Annual General Meeting approval;
9    3Calculated   with 2017 year-end share price of 89.75€ per share
PERFORMANCE AMID HEADWINDS - Merck FY 2017 results Stefan Oschmann, CEO Marcus Kuhnert, CFO - Merck Group
STRATEGIC REVIEW
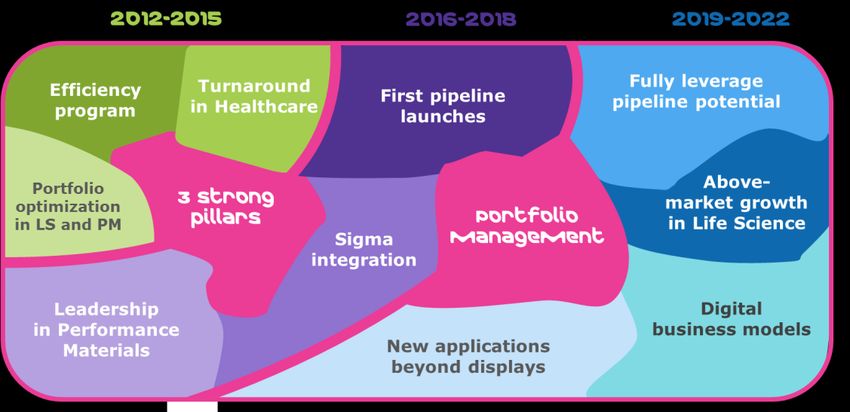
Strategic roadmap is clearly defined

                future
             improvements
                                           innovative
                                            portfolio

      Leading
     positions

                                       future growth
          financial situation
            solid as a rock
11
Healthcare: Solid core business and first new product launches

     Business performance                Sales and EBITDA pre margin                  Pipeline
                                                       2.1%

                                                  +4.7% organic
                                                                             Mavenclad approved in EU;
 Safeguarding Rebif and Erbitux in a                             €7.0 bn     first countries successfully launched
                                             €6.9 bn
  competitive environment
                                                                             Bavencio launched for MCC in the
 Expanding Fertility and General                                             U.S., Europe and Japan; UC launched
  Medicine portfolio in growth markets                                        in the U.S.

 Successful product repatriations in        31.0%                27.9%
                                                                             First avelumab Phase III readouts –
  major markets (e.g. China)                                                  major indications expected end of
                                                                              2018
 Operational excellence in Consumer
  Health                                                                     Progressing with three Phase II
                                              2016                2017
                                                                              studies for BTK-i (RA, SLE and MS)

12
Life Science: Profitable growth amid ongoing Sigma integration

     Business performance                Sales and EBITDA pre margin                  Innovation
                                                       4.0%

                                                  +5.3% organic              Patent approval for CRISPR technology
                                                                  €5.9 bn     in Australia, Canada and Singapur
 Above-market quality growth                €5.7 bn
                                                                                       TM
                                                                             SMCxPRO highly sensitive protein
 All businesses contributing
                                                                              detection in Research Solutions
 Strong performance of eCommerce
                                                                             Opening BioReliance End-to-End
  platform
                                                                              Biodevelopment Center in China
                                             29.2%                30.4%
 Stringent synergy realization drives
                                                                             MC-Media Pads for rapid food testing
  margin progression
                                                                              in Applied Solutions
 Execution of three bolt-on deals
                                              2016                2017       Inauguration of demonstration Life
                                                                              Science center in Boston

13
Performance Materials: Foster innovation amid a challenging display market

     Business performance                 Sales and EBITDA pre margin                    Innovation
                                                        -2.6%
                                                                              LC Windows – opening of Eindhoven
                                                   -1.7% organic
                                                                               production facility
 Leadership position in LC maintained,
  but at lower profitability                  €2.5 bn              €2.4 bn    Frost & Sullivan Technology Innovation
                                                                               Award for Liquid Crystal Windows
 UB-FFS only LC technology showing
  growth in 2017                                                              Advanced material technologies for
                                                                               3D-NAND chips in SSDs and EUV
 First SA-VA commercial batches for
                                               44.1%               40.1%       applications
  2018 trial runs delivered
                                                                                     ®
                                                                              Xirallic NXT, next generation of
 Above-market growth of Integrated
                                                                               special effect pigments for the
  Circuits
                                               2016                2017
                                                                               automotive industry
 Pigments with healthy growth
                                                                              Inauguration of China OLED
                                                                               application lab fostering customer
                                                                               proximity
14
FINANCIAL OVERVIEW
FY 2017 Financials: A year well managed

Key figures                                                                Comments
 [€m]                                  FY 2016        FY 2017         Δ    • Net sales growth driven by solid
                                                                             organic performance of Life Science
Net sales                                15,024        15,327      2.0%
                                                                             and Healthcare despite FX headwinds

EBITDA pre                                4,490         4,414      -1.7%   • EBITDA pre & margin decrease driven
     Margin (in % of net sales)          29.9%          28.8%                by LC market share decline,
                                                                             investments in Healthcare and FX
EPS pre                                    6.21           6.16     -0.8%
                                                                           • Slight decline in EPS pre due to lower
Operating cash flow                       2,518          2,696     7.1%      EBITDA pre
                                                                           • Healthy operating cash flow reflects
 [€m]                             Dec. 31, 2016   Dec. 31, 2017       Δ      business performance and better
                                                                             working capital management
Net financial debt                       11,513        10,144     -11.9%
                                                                           • Net financial debt reduction from
Working capital                           3,488          3,387     -2.9%     strong focus on deleveraging,
                                                                             supported by FX
Employees                                50,414        52,941      5.0%
                                                                           • Higher headcount related to growth
                                                                             initiatives in HC and shift in LS from
                                                                             temporary to permanent
16
Solid organic growth and Life Science synergies offset by HC investments
and softness in LC

                                                                                                 • Solid organic growth in Healthcare fueled by
FY 2017 YoY net sales                                                                              strong GM, CH, Fertility as well as Bavencio
                                          Organic         Currency      Portfolio        Total   • Life Science achieves above market organic
Healthcare                                     4.7%          -1.6%          -1.0%        2.1%      growth
                                                                                                 • Organic growth of ICM, Pigments and OLED
Life Science                                   5.3%          -1.7%          0.4%         4.0%
                                                                                                   mitigates ongoing LC market share decline

Performance Materials                         -1.7%          -0.9%          0.0%        -2.6%    • Strong H2 2017 FX headwinds drive negative
                                                                                                   FY 2017 currency effect (- €228 m)
Merck Group                                    3.8%          -1.5%          -0.3%        2.0%

                                                                                                 • HC solid organic growth, milestone payments
FY 2017 YoY EBITDA pre contributors [€ m]                                                          for Bavencio and royalty swap, outweighed by
     4,490              -179                  +134          -127                      4,414        investments in R&D and M&S
                                                                          +96
                                                                                                 • LS driven by strong organic growth and
                                                                                                   synergy realization
                                                                                                 • PM burdened by LC sales decline despite
                                                                                                   strength in ICM, Pigments and OLED
     FY 2016          Healthcare           Life Science   Performance   Corporate &   FY 2017    • Corporate EBITDA pre contains positive FX
                                                           Materials       Other                                         1
          Totals may not add up due to rounding;                                                   hedging and lower LTIP costs
17        1
            LTIP = Long Term Incentive Plan;
Reported figures reflect solid business performance & U.S. tax reform
effects

Reported results                                                                                                                Comments
 [€m]                                                           FY 2016                         FY 2017                    Δ
                                                                                                                                • EBIT increases mainly due to
EBIT                                                                 2,481                          2,525               1.8%      Biosimilars divestment despite lower
                                                                                                                                  EBITDA pre and high EBIT LY related
Financial result                                                       -326                           -300              -8.0%     to Kuvan disposal gain
Profit before tax                                                    2,154                          2,224               3.2%    • Financial result improvement driven
                                                                                                                                  by deleveraging, FX and valuation
Income tax                                                             -521                            386               n.m.     effects
                                                                                                             1
Effective tax rate (%)                                             24.2%                       -17.4%                           • Effective tax rate reflects revaluation of
                                                                                                                                  deferred tax liabilities due to U.S. tax
Net income                                                           1,629                          2,600               59.7%     reform

EPS (€)                                                                3.75                           5.98              59.5%

18      1
            Without effects from US tax reform, effective tax rate is at 23.4%; Totals may not add up due to rounding
Healthcare: Solid org. growth of core business and investments in future
growth

Healthcare P&L                                                                 Comments
 [€m]                                             Q4 2016           Q4 2017    • Solid organic growth driven by Glucophage China repatriation and
                                                                                 double digit growth for Consumer Health across all major regions
Net sales                                             1,766           1,773
                                                                               • Bavencio and Mavenclad successfully launched
Marketing and selling                                  -709            -689
                                                                               • Rebif organic decline driven by volume decline in EU and U.S. partially
Administration                                          -68             -73      offset by U.S. pricing
Research and development                               -418            -443    • Erbitux facing competition and price pressure in major markets
EBIT                                                    279              73    • Marketing & Selling slightly lower due to improved cost control and FX
EBITDA                                                  478             308    • Profitability impacted by product mix and back-end loaded R&D
EBITDA pre                                              497             384      investments
 Margin (in % of net sales)                           28.2%          21.6%

Net sales bridge
                                                                               Q4 2017 share of group net sales
     €1,766 m             5.9%              -4.8%        -0.7%      €1,773 m

                                                                                                               46%
                                                                                                                                 Healthcare

        Q4 2016          Organic           Currency     Portfolio   Q4 2017

19        Totals may not add up due to rounding
Life Science: Strong sales quarter amid synergy realization

Life Science P&L                                                               Comments
 [€m]                                             Q4 2016           Q4 2017    • Process Solutions shows double digit organic growth due to strong
                                                      1,441           1,496      demand in single-use & services globally
Net sales
Marketing and selling                                  -458             -431   • Applied Solutions with strong organic growth, benefits from good
                                                                                 demand in all regions and all businesses
Administration                                          -71              -67
                                                                               • Research Solutions growth driven by strong eCommerce
Research and development                                -70              -52
                                                                               • Q4 LY EBIT contains D&A effects from final purchase price
EBIT                                                     70              156
                                                                                 allocation for Sigma-Aldrich
EBITDA                                                  352              338
                                                                               • Higher profitability from organic growth and synergy ramp-up
EBITDA pre                                              419             461      outweighing FX headwinds
 Margin (in % of net sales)                           29.1%          30.8%

Net sales bridge                                                               Q4 2017 share of group net sales
     €1,441 m            8.9%              -5.5%                    €1,496 m
                                                         0.4%

                                                                                                               38%             Life Science
                                                                                                              39%
        Q4 2016          Organic           Currency     Portfolio    Q4 2017

20        Totals may not add up due to rounding
Performance Materials: Profitability burdened by LC market share decline

Performance Materials P&L                                                      Comments
 [€m]                                             Q4 2016           Q4 2017    • Organic growth of Integrated Circuit Materials, Pigments and OLED
                                                                                 outweighed by Liquid Crystals market share decline
Net sales                                               623              579
                                                        -57              -61   • Innovative UB-FFS technology continues to see strong demand
Marketing and selling
Administration                                          -16              -18   • Strong growth of Integrated Circuit Materials driven by all major material
                                                                                 classes, esp. strong demand of dielectrics and process materials
Research and development                                -56              -52
                                                                               • Healthy growth of Pigments & Functional Materials due to demand for
EBIT                                                    210              136
                                                                                 specialty coating pigments for the automotive industry
EBITDA                                                  269              213
                                                                               • Lower profitability reflects business mix, usual Liquid Crystals price
EBITDA pre                                              278             228      decline and FX headwinds
 Margin (in % of net sales)                           44.6%          39.4%

Net sales bridge                                                               Q4 2017 share of group net sales

     €623 m              -1.2%              -5.9%        0.0%       €579 m

                                                                                                                    15%             Performance
                                                                                                                                    Materials
        Q4 2016          Organic           Currency     Portfolio    Q4 2017

21        Totals may not add up due to rounding
Balance sheet – continued focus on rapid deleveraging
                                                  Assets [€ bn]                        Liabilities [€ bn]
                                                  38.3                                                 38.3
Cash & marketable securities                       1.1
                                                   2.9
                                                                35.6                35.6
                                                                  0.7
                    Receivables                    2.6            2.9
                                                                  2.6                                   14.1          Net equity
                     Inventories                                                     14.1

            Intangible assets                     25.0
                                                                  21.9                                  12.6          Financial debt
                                                                                     10.8

                                                                                      2.2
                                                                                                         2.0          Payables
                                                                                                         2.3
Property, plant & equipment
                                                                                      2.3                             Provisions for pensions
                                                   4.2            4.5
                                                                                      6.3                7.2          Other liabilities
                  Other assets                     2.5            3.0

                                             Dec. 31, 2016   Dec. 31, 2017      Dec. 31, 2017       Dec. 31, 2016

   • Total assets decrease, while equity ratio increases to 39.5%            • Net financial debt reduced by €1.4 bn due to healthy operating cash
   • Reduction in intangible assets mainly reflects scheduled                  flow and favorable FX translation
     amortization and FX (-€2.2 bn)                                          • Other liabilities down as U.S. tax reform reduces deferred tax liabilities

   22     Totals may not add up due to rounding
Jump in profit after tax driven by U.S. tax reform

Q4 2017 – cash flow statement                                               Cash flow drivers
 [€m]                                            Q4 2016   Q4 2017     Δ
                                                                            • Profit after tax reflects one time
Profit after tax                                     265     1,016   751      U.S. tax reform effect of ~€900 m

D&A                                                  548      511     -37   • D&A down due to FX effects on
                                                                              asset base
Changes in provisions                                 -9       81     90
                                                                            • Changes in other assets/liabilities
Changes in other assets/liabilities                 -191    -1,155   -964     reflect neutralizing of non-cash
                                                                              relevant U.S. tax gain
Other operating activities                           -17         0    17
                                                                            • Higher Capex from investments in
Changes in net working capital                       191      189      -2     additional capacities and
                                                                              innovation center
Operating cash flow                                  787      642    -145
                                                                            • Financing cash flow reflects
Investing cash flow                                 -450      -353    97      repayment of debt

 thereof Capex on PPE                               -260      -350    -90

Financing cash flow                                 -277      -551   -274

23      Totals may not add up due to rounding;
OUTLOOK AND GUIDANCE
Merck’s qualitative full-year 2018 guidance

         Net sales:             Moderate organic growth; moderate FX headwinds*

         EBITDA pre:            Slight organic decline; -4 to -6% YoY headwinds from FX

              EBITDA-supporting factors                                            EBITDA-reducing factors

                                                                    • Underlying R&D costs in Healthcare are budgeted above 2017,
• Organic net sales growth by Healthcare and Life Science             but actual development will be subject to clinical data outcome
                                                                      of priority projects and prioritization decisions

• Sigma-Aldrich incremental cost and revenue synergies              • Healthcare margins negatively impacted by product mix
  ~+€95 m YoY                                                         (esp. Rebif)

                                                                    • 2017 special gains of ~€200 m will not recur
• Biosimilars divestment frees up R&D budget
  (2017: mid to high double-digit million R&D costs)                • Performance Materials sales and earnings continuously affected
                                                                      by decline in Liquid Crystals

• First full-year sales contribution from newly launched pipeline   • First launch preparations for Mavenclad® U.S., driving M&S costs
  products Mavenclad® and Bavencio®
                                                                    • At current rates, FX remains a strong headwind, esp. in H1 2018

25      *Constant   portfolio
Merck to return to profitable growth track from 2019 onwards

              HC
                    EBITDA pre growth from accelerated top line growth and disciplined cost

     ∑
                    management

                    EBITDA pre growth driven by above-market growth and further margin
              LS    expansion from operating leverage

              PM    Trough year for profitability and focus on strategy execution

                    High confidence to deliver sales and EBITDA pre growth as well as
            Group   EBITDA pre margin improvements

26
Strong confidence and commitment for future growth

     1
             Merck offers a unique and promising portfolio with leading
             market positions and high innovation potential

         2
                 Merck is highly profitable, invests strongly in its future
                 potential and will generate sustainable profitable growth
                 from 2019 onwards

             3
                    Merck is financially rock solid and therefore able to finance
                    its future organic growth

               4
                       Merck will continue to deliver on its promises and
                       communicate transparently

27
APPENDIX
2018 business sector guidance (including Consumer Health)

            Healthcare                                                                    Performance
                                                 Life Science
                                                                                           Materials

              Net sales                              Net sales                               Net sales
 ▪ Moderate organic growth: ongoing     ▪ Organic growth slightly above         ▪ Slight to moderate organic decline
   organic Rebif decline offset by        market; driven by Process Solutions   ▪ Volume increases in all businesses
   growth in other franchises                                                   ▪ Ongoing Liquid Crystals market
 ▪ Full-year contributions from 2017                                              share decline
   launches
            EBITDA pre                              EBITDA pre                              EBITDA pre
 ▪ Slight organic % YoY decline         ▪ Organic % YoY growth with similar     ▪ Organic % YoY decline in the
 ▪ Adverse FX impact                      dynamics as in prior year (2017)        mid teens
 ▪ Higher R&D, subject to pipeline      ▪ Adverse FX impact                     ▪ Adverse FX impact
   decisions                            ▪ Full realization of expected          ▪ Decline from LC cannot be
 ▪ Higher M&S investments, for launch     synergies                               compensated by ICM and Pigments
   preparations
30
Additional financial guidance 2018

Further financial details

Corporate & Other EBITDA pre                                                                ~ -€320 – -360 m

Interest result                                                                             ~ -€230 – -240 m

Effective tax rate                                                                               ~ 24% to 26%

Capex on PPE                                                                                   ~ €900 – 950 m

                                                                            2018 hedge ratio ~50-60%
Hedging/USD assumption                                                      at EUR/USD ~ 1.19 to 1.20
                                                                                                                     1
2018 Ø EUR/USD assumption                                                                         ~ 1.18 – 1.22

31     1
           Exacerbated by devaluation of important Emerging Market currencies; FX effect on EBITDA-pre -4% to -6%.
FX sensitivity per business sector

                                                                                             Life Science                                      Performance
                       Healthcare
                                                                                                                                                Materials
     Sales                                                                   Sales                                                   Sales
     • Global presence                                                       • Balanced regional sales split                         • ~80% of sales in Asia-Pacific
                                                                               between EU, NA and RoW
     • ~35% of sales in Europe                                                                                                       • Industry is USD-driven
     Costs                                                                   Costs                                                   Costs
     • High Swiss franc cost base                                            • Extensive manufacturing and                           • Main production sites in Germany
       due to manufacturing sites                                              research footprint in the U.S.                        • Several R&D and mixing facilities
     • R&D hub and notable sales                                             • Global customer proximity                               in Asia
       force in U.S.                                                           requires broad-based sales force

                                                       1                                                                       1                                           1
     Net Sales currency exposure                                              Net Sales currency exposure                            Net Sales currency exposure
        Low                                          High                         Low                                         High     Low                             High

                                                 2                                                                       2                                             2
     FX impact on EBITDA pre                                                  FX impact on EBITDA pre                                FX impact on EBITDA pre
        Low                                          High                         Low                                         High     Low                             High

32        1                                2
              Net sales not generated in €; Indicative feedthrough of net sales FX impact to EBITDA pre; can vary over time
Strong focus on cash generation to ensure swift deleveraging

 Net financial debt* and leverage development                                              Focus on deleveraging
[Net financial debt/
EBITDA pre]
                                                                                           • Commitment to swift deleveraging to
  4x                                                                                         ensure a strong investment grade
                                                                                             credit rating and financial flexibility
                                                                                           • Strong cash flow will be used to drive
  3x              3.5x                                                                       down leverage to expected
                                                                                             €500 m)
  2x
                                                                 2.3x                        ruled out for 2018 (or financed by
                                                                                             divestments)
Well-balanced maturity profile reflects Sigma-Aldrich financing transactions

Maturity profile as of Dec. 31, 2017
                                                              2.4%
 Coupon                                                       4.5%

[€ m/US $]
                                                                                                    2.95%
                                                                                                                                                  3.25%
                                                              750                                  1.375%

                                    4.25%
                                                                                  2.625%
                                    0.75%
                                                                                                  1,000
                                     70                                                                                                           1,600
       1.7%
                                                            1,350                                                                        3.375%

                                                                                1,000
                                    800
      400
                1
                                                                                                   550                                   500

      2018                         2019                      2020                 2021             2022            2023                  2024     2025
                                                                                                                                     2
                                               EUR bonds              USD bonds        Private placements   Hybrids (first call dates)

               Financing structure enables flexible and swift deleveraging

34        1                               2
              Matures on March 19, 2018; No decision on call rights taken yet
Q4 2017: Overview

Key figures                                                                Comments
 [€m]                                  Q4 2016        Q4 2017         Δ
                                                                           • EBITDA pre & margin decrease reflects
Net sales                                 3,830          3,848     0.5%      LC market share decline, investments
                                                                             in HC and FX headwinds
EBITDA pre                                1,075         1,005      -6.5%
                                                                           • EPS pre down due to EBITDA pre
     Margin (in % of net sales)          28.1%          26.1%
                                                                             decrease
EPS pre                                    1.43           1.31     -8.4%
                                                                           • Lower operating cash flow reflects
                                                                             softer EBIT also driven by HC
Operating cash flow                        787            642     -18.5%
                                                                             investments, LC decline and FX
                                                                           • Net financial debt reduction due to
 [€m]                             Dec. 31, 2016   Dec. 31, 2017       Δ
                                                                             strong focus on deleveraging and FX
Net financial debt                       11,513        10,144     -11.9%
                                                                           • Higher headcount related to growth
Working capital                           3,488          3,387     -2.9%     initiatives in HC and shift in LS from
                                                                             temporary to permanent
Employees                                50,414        52,941      5.0%

35
EBITDA pre reflects investments in HC & LC market share decline

Q4 2017 YoY net sales
                                                                                                 • Strong organic growth of Healthcare driven
                                          Organic         Currency      Portfolio        Total
                                                                                                   by sound Fertility, GM repatriation in China,
Healthcare                                     5.9%          -4.8%          -0.7%        0.4%      CH and Bavencio offsetting Rebif decline
                                                                                                 • Life Science strong organic growth driven by
Life Science                                   8.9%          -5.5%          0.4%         3.8%      all businesses, esp. Process Solutions
                                                                                                 • Growth of ICM, Pigments & Functionals
Performance Materials                         -1.2%          -5.9%          0.0%        -7.1%
                                                                                                   mitigate LC market share decline
Merck Group                                    5.9%          -5.2%          -0.2%        0.5%    • Strong FX headwinds in all businesses

                                                                                                 • Healthcare reflects higher R&D investments
Q4 YoY EBITDA pre contributors [€ m]
                                                                                                   offsetting organic growth
     1,075              -114                  +41            -50          +52         1,005      • LS driven by strong organic growth and
                                                                                                   synergies outweighing FX headwinds
                                                                                                 • Performance Materials reflects LC market
                                                                                                   share decline and FX
                                                                                                 • Corporate EBITDA pre contains FX hedging
     Q4 2016          Healthcare           Life Science   Performance   Corporate &   Q4 2017                    1
                                                           Materials    Other (CO)                 gains and LTIP
          Totals may not add up due to rounding;
36        1
            LTIP = Long Term Incentive Plan;
Reported figures reflect US tax reform effect

Reported results                                      Comments
 [€m]                    Q4 2016   Q4 2017       Δ
                                                      • EBIT reflects decreased EBITDA pre
EBIT                         405       241   -40.5%     due to investments in HC, LC
                                                        market share decline and FX
Financial result             -70       -93   33.4%
                                                      • Financial result contains adverse
Profit before tax            335       148   -55.9%     LTIP and negative valuation effects
                                                      • Effective tax rate is impacted by one
Income tax                   -70       868     n.m.
                                                        time tax gain due to U.S. tax reform
Effective tax rate (%)     21.0%      n.m.            • Net income and EPS reflect one time
                                                        tax gain
Net income                   269     1,013   276.8%

EPS (€)                     0.62      2.33   275.8%

37
Healthcare: Good organic growth and product mix drive profitability

Healthcare P&L                                                                  Comments
 [€m]                                               FY 2016          FY 2017    • Moderate Fertility growth reflects strong demand in China mitigating
                                                                                  competition in EU and tough base LY
Net sales                                             6,855            6,999
                                                                                • Organic decline of Erbitux due to competition as well as price pressure
Marketing and selling                                 -2,587          -2,722
                                                                                  in EU outweighing volume expansion in LatAm
Administration                                         -270              -299
                                                                                • Rebif decline from competition in U.S. and EU, partially offset by U.S.
Research and development                              -1,496          -1,632      pricing
EBIT                                                  1,593            1,447    • Marketing & selling reflects Bavencio and Mavenclad launches as well
                                                      2,425            2,155      as costs for Glucophage repatriation
EBITDA
                                                       2,128           1,949    • R&D spend increases as pipeline development progresses
EBITDA pre
 Margin (in % of net sales)                           31.0%           27.9%     • Profitability burdened by higher R&D and launch costs, exceeding
                                                                                  income from milestone payments for Bavencio and organic growth

Net sales bridge                                                                FY 2017 share of group net sales

     €6,855 m             4.7%              -1.6%        -1.0%       €6,999 m

                                                                                                                  46%
                                                                                                                                 Healthcare

        FY 2016          Organic           Currency      Portfolio    FY 2017

38        Totals may not add up due to rounding
Healthcare organic growth by franchise/product

Q4 2017 organic sales growth [%]                         FY 2017 organic sales growth [%]
by key product [€ m]                                     by key product [€ m]
                                               Organic                                                     Organic

                                   381                                                           1,611
                                                -7%                                                         -6%
                                         441                                                       1,741

 Consumer                  225
                                               +10%
                                                         Consumer                      911                  +8%
  Health                  214                             Health                      860

                          215                                                         853
                                                +1%                                                         -1%
                          222                                                         880

                        177                    +82%                             662
                                                                                                           +75%
                 102                                                      388

                        171                                                     704
                                                +3%                                                         -5%
                        175                                                      753

                  109                           +3%                       444
                                                                                                            +6%
                  111                                                     431

                 Q4 2017         Q4 2016                                  FY 2017            FY 2016

39
Rebif: Ongoing decline in line with interferon market

 Rebif sales evolution                                                   Rebif performance

 North America                                              Q4 drivers   • Rebif sales of €381 m in Q4 2017
[€ m]                                                                      reflect organic decline of -7.2% as well
                                                            -7.2% org.
                                         Price                             as FX headwinds
 300
                    Price              increase
                  increase                                     Price     • U.S. organic decline due to competition
 225                                                                       and stocking effects partially offset by
                                                               Volume
                                                                           price increases
 150                                                           FX
        Q4 2016   Q1 2017    Q2 2017   Q3 2017    Q4 2017
                                                                         • Market share within interferons stable
                                                                           due to high retention rates and long-
 Europe                                                                    term safety track record
                                                            Q4 drivers
[€ m]                                                                    • Competition from orals and occasional
 180                                                        -7.6% org.     price adjustments cause ongoing
 160                                                                       organic decline in Europe
 140                                                           Price
 120
                                                               Volume
 100
        Q4 2016   Q1 2017    Q2 2017   Q3 2017    Q4 2017

 40
Erbitux: Almost stable in a challenging market environment

Erbitux sales by region                                                                               Erbitux performance

                                                                                     +0.8% Q4 YoY     • Sales decrease to €215 m impacted by
     [€ m]                                                                           organic growth     FX headwinds mainly from APAC & LatAm
     250
                                                                                                      • Europe impacted by competition, price
                                                                                         23.3%          reductions and shrinking market size due
     200
                                                                                                        to increasing immuno-oncology trials
                                                                                        -10.9%        • Asia-Pacific with volume and price
     150
                                                                                                        erosion in China and Japan
                                                                                         9.1%         • MEA shows strong organic growth
     100

                                                                                         3.3%
      50

       0
             Q4 2016       Q1 2017        Q2 2017           Q3 2017        Q4 2017

                  Europe   Middle East & Africa     Asia-Pacific   Latin America

41
Strong organic growth in General Medicine and Fertility

Sales evolution                                                                                             Q4 drivers
Fertility
[€ m]                                                                                                       • Fertility shows ongoing growth
300                                                                                                           especially in APAC
260                                                                                            Organic
220
                                                                                                            • Gonal-f driven by double digit growth
                                                                                              7.2% org.
180                                                                                                           in APAC due to increased demand
            Q4 2016             Q1 2017             Q2 2017               Q3 2017   Q4 2017
                                                                                                            • LY Endocrinology reflected release of
Endocrinology                                                                                                 accrual for rebates
[€ m]
120
                                                                                                            • GM organic sales growth driven by
                                                                                               Organic        Glucophage repatriation in China and
100
                                                                                              -13.9% org.     increased demand in LatAm
 80
            Q4 2016             Q1 2017             Q2 2017               Q3 2017   Q4 2017                 • Euthyrox with strong demand in
General Medicine (GM)*                                                                                        growth markets
[€ m]
500
450                                                                                            Organic
400                                                                                           16.1% org.
350
            Q4 2016             Q1 2017             Q2 2017               Q3 2017   Q4 2017

42      *includes   “CardioMetabolic Care & General Medicine and Others
Merck pipeline                                                                                                                                                                                  February 15, 2018

     Phase I                                                                          Phase II                                                     Phase III                                                 Registration
 M2698                                avelumab                                       tepotinib                                                   avelumab - anti-PD-L1 mAb                                  cladribine tablets
 p70S6K & Akt inhibitor               anti-PD-L1 mAb                                 c-Met kinase inhibitor                                      Non-small cell lung cancer 1L1                             lymphocyte targeting agent
 Solid tumors                         Solid tumors                                   Non-small cell lung cancer                                  avelumab - anti-PD-L1 mAb                                  Relapsing multiple sclerosis4
 M3814                                avelumab                                       tepotinib                                                   Gastric cancer        1L-M1M
 DNA-PK inhibitor                     anti-PD-L1 mAb                                 c-Met kinase inhibitor                                      avelumab - anti-PD-L1 mAb
 Solid tumors                         Hematological malignancies                     Hepatocellular cancer                                       Ovarian cancer platinum resistant/refractory
 M9831 (VX-984)                       M9241 (NHS-IL12)2                                                                                          avelumab - anti-PD-L1 mAb
 DNA-PK inhibitor                     Cancer immunotherapy                           avelumab - anti-PD-L1 mAb                                   Ovarian cancer 1L1
 Solid tumors                         Solid tumors                                   Merkel cell cancer 1L1
                                                                                                                                                 avelumab - anti-PD-L1 mAb
 M6620 (VX-970)                       M7824                                                                                                      Urothelial cancer 1L-M1M
                                                                                     sprifermin
 ATR inhibitor                        anti-PD-L1/TGFbeta trap                                                                                    avelumab - anti-PD-L1 mAb
                                                                                     fibroblast growth factor 18
 Solid tumors                         Solid tumors                                                                                               Renal cell cancer 1L1
                                                                                     Osteoarthritis                                                                                                         Oncology
 M4344 (VX-803)                       M4112                                                                                                      avelumab - anti-PD-L1 mAb
                                                                                     atacicept                                                                                                              Immuno-Oncology
 ATR inhibitor                        Cancer immunotherapy                                                                                       Locally advanced head and neck cancer
                                                                                     anti-Blys/anti-APRIL fusion protein
 Solid tumors                         Solid tumors
                                                                                     Systemic lupus erythematosus                                                                                           Immunology
 M3541
                                      M1095 (ALX-0761)3                              atacicept                                                                                                              Neurology
 ATM inhibitor
                                      anti-IL-17 A/F nanobody                        anti-Blys/anti-APRIL fusion protein
 Solid tumors
                                      Psoriasis                                      IgA nephropathy                                                                                                        General Medicine
 M8891
                                      M6495                                          abituzumab
 MetAP2 inhibitor
                                      anti-ADAMTS-5 nanobody                         anti-CD51 mAb
 Solid tumors
                                      Osteoarthritis                                 Systemic sclerosis with interstitial lung disease
 M7583
                                                                                     evobrutinib
 BTK inhibitor
                                      M5717                                          BTK inhibitor
 Hematological malignancies
                                      PeEF2 inhibitor                                Rheumatoid arthritis
                                      Malaria
                                                                                                                                      1   First Line treatment;   1M   First Line maintenance treatment.
                                                                                     evobrutinib                                      2   Sponsored by the National Cancer Institute (USA).
                                                                                     BTK inhibitor                                    3As announced on March 30 2017, in an agreement with Avillion, anti-IL-17 A/F nanobody will be developed
                                                                                     Systemic lupus erythematosus                     by Avillion for plaque psoriasis and commercialized by Merck.
                                                                                                                                      4 As announced on August 25 2017, the European Commission has granted marketing authorization for
                                                                                                                                      cladribine tablets for the treatment of highly active relapsing multiple sclerosis in the 28 countries of the
                                                                                     evobrutinib                                      European Union in addition to Norway, Liechtenstein and Iceland.
                                                                                     BTK inhibitor
                                                                                     Multiple sclerosis

43          Pipeline products are under clinical investigation and have not been proven to be safe and effective. There is no guarantee any product will be approved in the sought-after indication.
Healthcare
Upcoming catalysts

                                                               Cladribine

                                                             US submission

               Q1 2018                                          Q2 2018                 Q3 2018                    Q4 2018

                                                     Anti-PD-L1/TGF-ß trap              Atacicept                  Avelumab

                                                       Preliminary ph Ib data    Ph III initiation (subject    Ph III data read-out
                                                     (e.g. PDx-naïve NSCLC 2L)    to external financing)      (ovarian plat. res/ref)1

44
     1Note: timelines are event-driven and may change.
     Acronyms: NSCLC: Non small cell lung cancer | MS: multiple sclerosis
Life Science: Strong top-line growth and fast synergy realization

Life Science P&L                                                                Comments
 [€m]                                             FY 2016            FY 2017    • Strong growth of Process Solutions driven by increasing production
                                                                                  of large molecules across global and regional accounts
Net sales                                             5,658            5,882
                                                      -1,706          -1,734    • Applied Solutions shows solid organic growth, driven by biomonitoring
Marketing and selling
                                                                                  products for pharma & demand for analytical testing
Administration                                         -248              -261
                                                                                • Research Solutions organic growth reflects eCommerce performance
Research and development                               -260              -241
                                                                                • LY EBIT affected by inventory step-up for Sigma-Aldrich
EBIT                                                    556               834
                                                                                • Profitability reflects organic growth and ongoing synergy realization,
EBITDA                                                1,378            1,580
                                                                                  despite increasing FX headwinds in second half of the year
EBITDA pre                                             1,652           1,786
 Margin (in % of net sales)                           29.2%           30.4%

Net sales bridge                                                                FY 2017 share of group net sales
                          5.3%             -1.7 %        0.4%        €5,882 m
     €5,658 m

                                                                                                                 38%              Life Science

        FY 2016          Organic           Currency      Portfolio    FY 2017

45        Totals may not add up due to rounding
Performance Materials: Topline affected from LC softness but profitability kept intact

Performance Materials P&L                                                       Comments
                                                                                • Organic growth of Integrated Circuit Materials, Pigments and OLED
 [€m]                                               FY 2016          FY 2017      cannot offset Liquid Crystal market share decline
Net sales                                             2,511            2,446
                                                                                • Sales decline driven by ongoing Liquid Crystal market share decline
Marketing and selling                                  -233              -242
                                                                                • OLED grew in line with industry capacity expansion & investments
Administration                                          -61               -72
                                                                                • Integrated Circuit Materials shows very strong growth in all major
Research and development                               -213              -225     material classes driven by increasing demand & complexity of chips
EBIT                                                    823               689   • Healthy growth of Pigments due to solid demand for decorative
EBITDA                                                1,077              947      pigments especially in automotive applications
EBITDA pre                                             1,106             980    • Profitability reflects negative business mix, usual Liquid Crystal price
 Margin (in % of net sales)                           44.1%           40.1%       reductions as well as higher R&D for future growth projects

Net sales bridge                                                                FY 2017 share of group net sales

     €2,511 m            -1.7%              -0.9%         0.0%       €2,446 m

                                                                                                                    16%             Performance
                                                                                                                                    Materials

        FY 2016          Organic           Currency      Portfolio    FY 2017

46        Totals may not add up due to rounding
Healthy operating cash flow reflects solid business performance

FY 2017 – cash flow statement                                              Cash flow drivers
 [€m]                                           FY 2016   FY 2017     Δ    • Profit after tax reflects one time U.S.
Profit after tax                                  1,633    2,610    977      tax reform effect and Biosimilars
                                                                             divestment
D&A                                               1,934    1,758    -177
                                                                           • D&A lower mainly due to Mavenclad
Changes in provisions                               -51      103    154      and Vevey site write up and impairment
                                                                             of Xalkori LY
Changes in other assets/liabilities                -587    -1,256   -669
                                                                           • Changes in other assets/liabilities
Other operating activities                         -437     -349     88      mainly reflects neutralization of non-
                                                                             cash relevant tax gain
Changes in net working capital                       26     -170    -196
                                                                           • Investing cash flow contains Vertex and
Operating cash flow                               2,518    2,696    178      F-star licensing deals as well as
                                                   -503    -1,147
                                                                             increased Capex outweighing
Investing cash flow                                                 -644
                                                                             Biosimilars divestment
 thereof Capex on PPE                              -716     -919    -203
                                                                           • Financing cash flow reflects mainly
                                                 -1,908    -1,870    39      repayment of $250 m and €700 m
Financing cash flow
                                                                             bond (Q1/Q3)

47      Totals may not add up due to rounding
Adjustments in Q4 2017

Adjustments in EBIT

 [€m]                                            Q4 2016                      Q4 2017
                                          Exceptionals   thereof D&A   Exceptionals   thereof D&A

Healthcare                                       20            0            109            33

Life Science                                     93           27            123             0

Performance Materials                            25           16             34            19

Corporate & Other                                27            1             43             4

Total                                           165           44            308            56

48      Totals may not add up due to rounding
Adjustments in FY 2017

Adjustments in EBIT

 [€m]                                              FY 2016                    FY 2017
                                          Exceptionals   thereof D&A   Exceptionals   thereof D&A

Healthcare                                      -225          71           -257           -51

Life Science                                    301           27            209             3

Performance Materials                            46           16             59            26

Corporate & Other                                69            1            103             4

Total                                           191          115            114           -19

49      Totals may not add up due to rounding
Financial calendar

        Date                   Event
April 27, 2018       Annual General Meeting

May 15, 2018         Q1 2018 Earnings release

August 9, 2018       Q2 2018 Earnings release

November 14, 2018    Q3 2018 Earnings release

50
CONSTANTIN FEST                  SVENJA BUNDSCHUH                  ALESSANDRA HEINZ

Head of Investor Relations       Assistant Investor Relations      Assistant Investor Relations
+49 6151 72-5271                 +49 6151 72-3744                  +49 6151 72-3321
constantin.fest@merckgroup.com   svenja.bundschuh@merckgroup.com   alessandra.heinz@merckgroup.com

ANNETT WEBER                     NILS VON BOTH

                                                                            EMAIL: investor.relations@merckgroup.com
                                                                                WEB: www.investors.merck.de
Institutional Investors /        Institutional Investors /                        FAX: +49 6151 72-913321
Analysts                         Analysts
+49 6151 72-63723                +49 6151 72-7434
annett.weber@merckgroup.com      nils.von.both@merckgroup.com

EVA STERZEL                      PATRICK BAYER

Retail Investors / AGM /         Institutional Investors /
CMDs / IR Media                  Analysts
+49 6151 72-5355                 +49 6151 72-5642
eva.sterzel@merckgroup.com       patrick.bayer@merckgroup.com
You can also read