Twin River Worldwide Holdings, Inc. February 11, 2020 - Third
←
→
Page content transcription
If your browser does not render page correctly, please read the page content below
Third

        Twin River Worldwide Holdings, Inc.
        February 11, 2020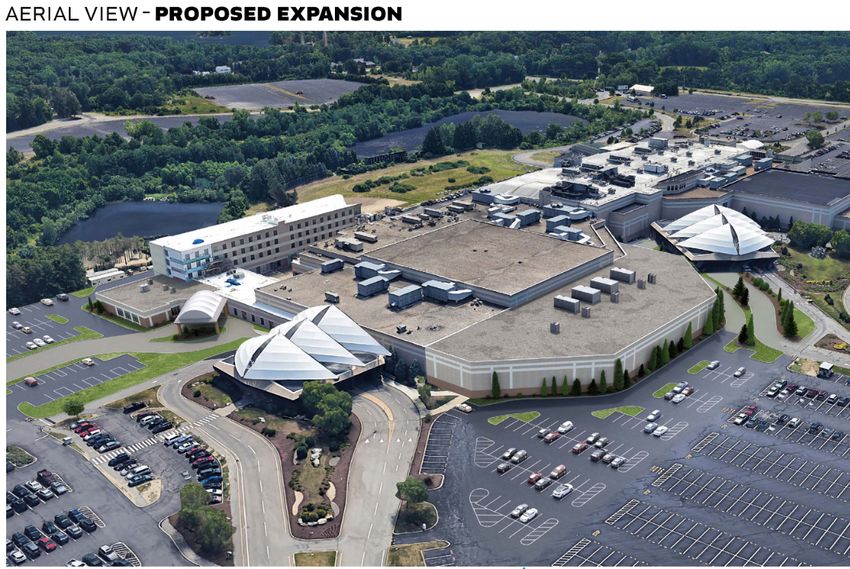
Forward-Looking Statements and Non-GAAP Financial Measures
Twin River Worldwide Holdings, Inc. may be referred to in this investor presentation as "the Company", "Twin River" or "TRWH." This presentation contains “forward-looking” statements within the meaning of Section
27A of the Securities Act of 1933, as amended, Section 21E of the Securities Exchange Act of 1934, as amended, and the Private Securities Litigation Reform Act of 1995. All statements, other than historical facts, including
future financial and operating results and the Company’s plans, objectives, expectations and intentions, legal, economic and regulatory conditions and any assumptions underlying any of the foregoing, are forward-looking
statements.

Forward-looking statements are sometimes identified by words like "may," "will," "should," "potential," "intend," "expect," "endeavor," "seek," "anticipate," "estimate," "overestimate," "underestimate," "believe," "could,"
"project," "predict," "continue," "target" or other similar words or expressions. Forward-looking statements are based upon current plans, estimates and expectations that are subject to risks, uncertainties and assumptions.
Should one or more of these risks or uncertainties materialize, or should underlying assumptions prove incorrect, actual results may vary materially from those indicated or anticipated by such forward-looking statements.
This communication contains "forward-looking" statements as that term is defined in Section 27A of the Securities Act of 1933, as amended, Section 21E of the Securities Exchange Act of 1934, as amended, and the Private
Securities Litigation Reform Act of 1995. All statements, other than historical facts, including future financial and operating results and the Company's plans, objectives, expectations and intentions, legal, economic and
regulatory conditions are forward-looking statements. Forward-looking statements are sometimes identified by words like "may," "will," "should," "potential," "intend," "expect," "endeavor," "seek," "anticipate," "estimate,"
"overestimate," "underestimate," "believe," "could," "project," "predict," "continue," "target" or other similar words or expressions. Forward-looking statements are based upon current plans, estimates and expectations that
are subject to risks, uncertainties and assumptions. Should one or more of these risks or uncertainties materialize, or should underlying assumptions prove incorrect, actual results may vary materially from those indicated or
anticipated by such forward-looking statements. The inclusion of such statements should not be regarded as a representation that such plans, estimates or expectations will be achieved. Important factors that could cause
actual results to differ materially from such plans, estimates or expectations include, among others, (1) unexpected costs, charges or expenses resulting from the recently completed acquisition of Black Hawk, CO and the
proposed acquisition of properties in Kansas City, Missouri and Vicksburg, Mississippi; (2) uncertainty of the expected financial performance of the Company, including the failure to realize the anticipated benefits of its
acquisitions; (3) the Company’s ability to implement its business strategy; (4) the risk that stockholder litigation may result in significant costs of defense, indemnification and/or liability; (5) evolving legal, regulatory and tax
regimes; (6) changes in general economic and/or industry specific conditions; (7) the effects of competition that exists in the gaming industry; (8) actions by third parties, including government agencies; (9) the risk that the
proposed acquisitions of properties in Kansas City, Missouri and Vicksburg, Mississippi, and anticipated enhancements to these properties and their operations, may not be completed on the terms or in the time frame
expected, or at all; (10) the risks related to the Company’s announcement of the proposed partnering with IGT Global Services (“IGT”) to create a new company jointly owned by the Company and IGT that will focus on
creating and maintaining a competitive gaming machine offering, (11) the possibility that the anticipated operating results and other benefits of the proposed joint venture with IGT and proposed agreement with the State of
Rhode Island related thereto are not realized when expected or at all or that the proposed joint venture is not consummated, and (12) other risk factors as detailed under Part I. Item 1A. “Risk Factors” of the Company’s
Annual Report on Form 10-K for the fiscal year ended December 31, 2018 as filed with the Securities and Exchange Commission on April 1, 2019. The foregoing list of important factors is not exclusive. Any projections of
future results of operations are based on a number of assumptions, many of which are outside the Company’s control and should not be construed in any manner as a guarantee that such results will in fact occur.

These projections are subject to change and could differ materially from final reported results. Any forward-looking statements speak only as of the date of this communication. The Company does not undertake any
obligation to update any forward-looking statements, whether as a result of new information or development, future events or otherwise, except as required by law. Readers are cautioned not to place undue reliance on any of
these forward-looking statements.

To supplement the financial information presented on a U.S. generally accepted accounting principles ("GAAP") basis, the Company has included in this investor presentation non-GAAP financial measures. The presentation
of non-GAAP financial measures in this investor presentation is not intended to be considered in isolation or as a substitute for any measure prepared in accordance with GAAP. Reconciliations of these non-GAAP financial
measures to the most directly comparable financial measure calculated and presented in accordance with GAAP are included herein or in the Company’s earnings releases that have been furnished to the SEC and are
available on the Company’s website at www.twinriver.com under the “Investor Relations” tab. The Company believes that presenting non-GAAP financial measures aids in making period-to-period comparisons and is a
meaningful indication of its actual and estimated operating performance. Because not all companies use identical calculations, the Company's non-GAAP financial measures may not be the same as or comparable to similar
non-GAAP measures presented by other companies.

This investor presentation also includes references to targeted Adjusted EBITDA and related multiples, which are not presented as forecasts or projections of future operating results. The Company does not provide
reconciliations of Adjusted EBITDA to net income on a forward-looking basis to its most comparable GAAP financial measure because the Company is unable to forecast the amount or significance of certain items required
to develop meaningful comparable GAAP financial measures without unreasonable efforts. These items include depreciation, impairment charges, gains or losses on retirement of debt, acquisition, integration and
restructuring expenses, interest expense, share-based compensation expense, professional and advisory fees associated with the Company’s capital return program, variations in effective tax rate and expansion and pre-
opening expenses, which are difficult to predict and estimate and are primarily dependent on future events, but which are excluded from the Company's calculations of Adjusted EBITDA. The Company believes that the
probable significance of providing these forward-looking non-GAAP financial measures without a reconciliation to the most directly comparable GAAP financial measure, is that investors and analysts will have certain
information that the Company believes is useful and meaningful regarding its operations, including its completed and proposed acquisitions and the estimated impact on those businesses’ results from the anticipated changes
the Company is likely to make, or has made, to their operations, but will not have that information on a GAAP basis. Investors are cautioned that the Company cannot predict the occurrence, timing or amount of all non-
GAAP items that may be excluded from Adjusted EBITDA in the future. Accordingly, the actual effect of these items, when determined could potentially be significant to the calculation of Adjusted EBITDA.

                                                                                                                                                                                                                         2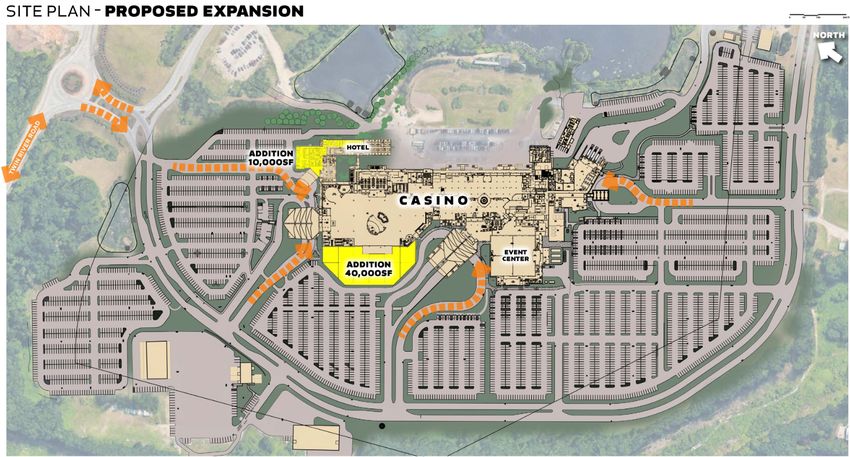
I. Company Overview
Company Overview
  ▪   Twin River Worldwide Holdings, Inc. (“TRWH”) is a diversified, multi-property gaming company
       –   Owns and operates seven casinos and one racetrack across four states
       –   Completed merger with Dover Downs Gaming & Entertainment, Inc. on March 28, 2019;
           began trading on the NYSE under the ticker symbol “TRWH” on March 29, 2019
       –   Completed acquisition of three casino properties located in Black Hawk, CO: Golden Gates,
           Golden Gulch and Mardi Gras, on January 23, 2019
       –   Pending acquisitions of Isle of Capri Kansas City and Lady Luck Vicksburg expected to close
           in early Q2 2020

                                                                                                  4
TRWH has focused on creating long-term strategic value

             Period of Significant Transformation Continues

   •   Transformed to a publicly traded Company with a refreshed Board of Directors.

   •   Management team has significant public company experience and a successful track record of
       delivering accretive growth through strategic acquisitions, development projects and public policy
       initiatives.

   •   The focus is upon shareholders. The Board of Directors has approved a capital return program
       through which the Company may return up to $350M to shareholders, an additional $100 million of
       which was approved by the Board of Directors in February 2020. Through stock repurchases and
       payment of dividends, $243.8 million has been returned as of January 31, 2019.

   •   Focused M&A strategy - transformed from a single property operator prior to 2014 to a multi-
       property public corporation today. Pipeline for future M&A remains strong.

   •   The Company is quickly responding to competition in the New England market.

   •   Completed Black Hawk, CO acquisition on January 23, 2020.

                                                                                                      5
TRWH is a diversified and multi-property gaming company

                                                                       ü 4 Jurisdictions
                                                                                         (1)

                                                                       ü 8 Properties(1)
                                                                       ü 2 Additional
                                                                         locations under
                                                                         contract

                                                                       ü ~9,129 slot
                                                                         machines(1)
                                                                       ü ~ 267 table
                                                                         games(1)
                                                                       ü ~1,200 hotel
                                                                         rooms(1)

        (1) January 31, 2020 actual, excluding pending acquisitions.               6
TRWH Casino Portfolio Summary

                                                            Casino Properties                                                  Total

Location              Lincoln, RI          Tiverton,RI            Biloxi, MS           Dover, DE          Black Hawk, CO

Casino Sq. Ft.         162,420               33,600                50,984               165,000               36,000           448,004

Slot Machines /
                        4,108                1,000                  1,183                2,173                  665             9,129
VLTs
Table Games              112                   32                    52                   38                    33              267

Hotel Rooms              136                   83                    479                  500                    —              1,198

Sports Betting           Yes                  Yes                    Yes                  Yes             Expected 2020

Racebook                 Yes                  Yes                    No                   Yes                   No

                     Opened hotel                                                  Live horse-racing;
                    adjacent to the                           Waterfront casino     located next to        3 Sports betting
                   casino in October   Property opened in    resort located in an Dover International   licenses; 2 of which
Other              2018; situated on    September 2018       excellent Gulf Coast Speedway; situated     have already been
                  196 acres of owned                               location         on ~70 acres of           announced
                          land                                                        owned land

                                                                                                                                        7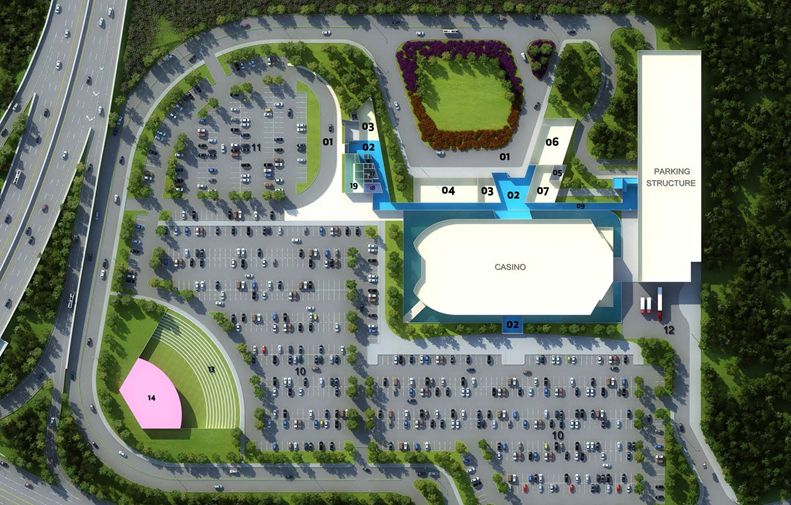
Twin River Casino Has Become a New England Locals’ Destination

 ▪ 4,108 slot machines           ▪ 162,420 square foot gaming floor
 ▪ 112 table games and poker     ▪ 29,000 square foot multipurpose
   room                            event center
 ▪ 48 stadium gaming positions   ▪ 85 acres of adjacent property
 ▪ 136 guest rooms and suites,     which may be developed
   an indoor pool and fitness    ▪ >15,000 average daily customers
   center                        ▪ Potential for expansion
 ▪ 23 food and beverage
   outlets

                                                                      8
Tiverton was an Opportunistic and Defensive Investment Intended to
Help Solidify TRWH’s Position in the New England Region

 ▪   1,000 slot machines        ▪ 33,600 square foot gaming floor

 ▪ 32 table games and stadium   ▪ 83 guest rooms and suites, meeting
   gaming                         spaces and a fitness center

 ▪ Opened in September 2018     ▪ 7 food and beverage outlets

                                                                       9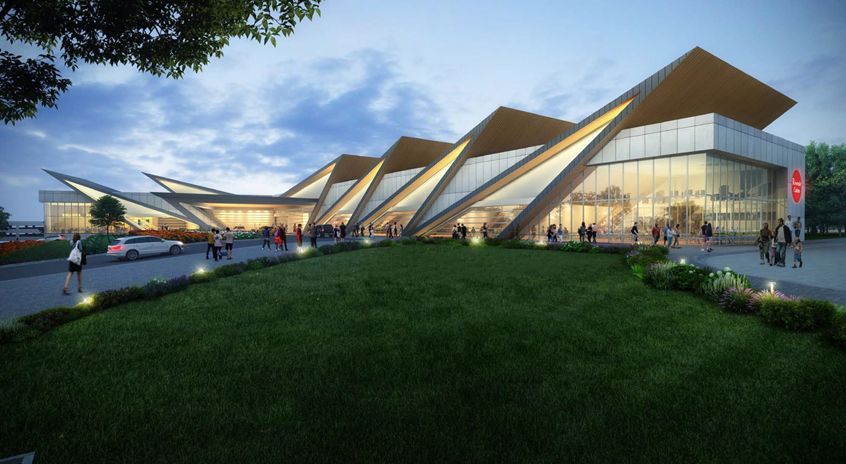
Hard Rock Biloxi Diversified TRWH’s Geographic Presence with a
Prime Location in an Established Region

 ▪   1,183 slot machines          ▪ 50,984 square foot gaming floor

 ▪ 52 table games and a poker     ▪ 9,000 square foot theater with
   room                             ~2,000 person seating capacity

 ▪ 479 guest rooms and suites,    ▪ 18 food and beverage outlets
   a spa and a pool with a swim     including fine dining, casual
   up bar                           dining, lounges and a sports bar

                                                                       10
Dover Downs Provided a Path to Becoming Publicly Traded Along
with Meaningful Upside and Further Diversification
Casino Hotel & Conference Center
▪ 500 room hotel, full service
▪ 2,173 slot machines spa / salon, conference center,
banquet hall, ballroom and
▪ 38 table games and a poker concert hall facilities
room
▪ 41,500 square foot event space
▪ 165,000 square foot casino
Raceway
▪ 15 food and beverage
outlets, including a new ▪ Harness racing track with pari-
Italian restaurant and mutuel wagering on live and
expected 2020 opening of simulcast horse races and sports
Sugar Factory betting
11Colorado Properties
Black Hawk Arapahoe Park
▪ Central location in the Black Hawk market ▪ Significant option value from strategic location
▪ Upside from operational improvement and best-practices ▪ Property includes over 300 acres of available land
– Implementation of TRWH marketing strategy ▪ Live racing and off-track betting (“OTB”) currently
– Focus on refreshed F&B approach
– Cost initiatives to right-size property
▪ Healthy tailwind from strong / growing Denver economy
▪ Voter approval results in acquisition of 3 sports gaming licenses
– Partnerships for 2 licenses already announced
12Pending Acquisitions in Kansas City and Vicksburg Provide
Accretive Opportunity
Kansas City Vicksburg
▪ Premier location to downtown ▪ Accretive to earnings
within area of redevelopment
▪ Increases regional
▪ Underperforming in market presence in existing MS
market
▪ Opportunity to invest and
reposition to increase market
share
Source: US Census Bureau, Google Maps, Map Info.
1. Tribal, slots-only casino.
13Experienced Management Team
TRWH’s management team has significant public company experience and a successful track record of
delivering growth through public policy initiatives, development projects and strategic acquisitions
Relevant Industry Company
Name & Title Experience Experience Experience 2014(1) 2020(2) ∆ since 2014
Resorts Casino
George Papanier Hotel, Peninsula
Gaming, Sun
President and Chief International 30+ 15+
Executive Officer Hotels, Wynn, Properties 2 8 6
Mohegan Sun
Craig Eaton
Adler, Pollock and 25+ 14+
Executive Vice President Sheehan
and General Counsel
States / jurisdictions 2 4 2
Steve Capp
KPI’s
Pinnacle
Executive Vice President Entertainment 30+ 7+
Bear Stearns
and Chief Financial Officer
Marc Crisafulli Hinkley, Allen & Joined
Executive Vice President, Snyder LLP 20+
GTECH 2019
Government Relations Hotel rooms 0 1,198 1,198
Phil Juliano
Senior Vice President and Wynn 35+ 10+
Chief Marketing Officer
Slot machines 4,108 9,129 122%
Jay Minas Pinnacle
Vice President of Finance Entertainment 20+ 13+
1. Excludes the impact of Hard Rock Biloxi; Mile High USA only included in property count and states / jurisdictions.
2. Does not include announced acquisitions in Vicksburg, MS and Kansas City, MO. 14II. Growth Track Record
TRWH has Grown Through a Disciplined Investment Strategy

                                                                                                                                         (3)                                     (3)

                                                                                                                                  $534                                    $547
  Revenue $ in millions
                                                                                                                                   $97         18%                        $104           19%
                                                   $414                                    $421

                                                                                                                                  $125         23%                        $128          23%
                                                                                                                                                                                       18%
                                                   $123      30%                           $123      29%
                                           30%                                                                 29%                                                                     23%
                  (2)
           $192
                                           70%                                                                 71%                             58%                        $315         59%
                                                                                                                                                                                        58%
                                                   $291      70%                           $298      71%                          $312
           $192         100%

                                                                                                                                                                                   (4)
           2013                                    2016                                    2017                                 PF 2018                                 PF 2019
                                        Legacy Twin River / Newport Grand                          Biloxi                 Dover Downs

          1) Purchase price net of cash acquired.
          2) Reflects Company's Revenue for the year ended December 31, 2013 per audited financial statements but not adjusted for accounting guidance ASC 606.
          3) Includes Dover Downs actuals for 2018 and Q1 2019 as applicable and actual 2018 results for each of Newport Grand and Tiverton. Does not include any estimated synergies or       16
           impacts of changes in Delaware legislation.
          4) Preliminary estimated results for 2019.
We Have Executed on Key Strategic Objectives
Objective What We Have Done
Grow and Diversify • Acquired Biloxi (2014), Newport Grand (2015), Dover Downs (2019) and Black Hawk, CO
through Strategic and (2020)
Accretive M&A • Announced acquisitions in Kansas City, MO and Vicksburg, MS
Organic Growth • Moved Newport license to newly-constructed Tiverton Casino Hotel
Working • Built hotel at Twin River Casino Hotel
Collaboratively in • Added table games at both facilities in Rhode Island through multiple voter initiatives
Regulatory • Launched sports betting and added sportsbook amenities
Environment • Introduced stadium gaming
• Announced proposed joint venture with IGT
• Listed as publicly traded company as part of Dover Downs merger
• Secured $950M in new financing including senior notes, term loan and revolver
Create Additional • $250M Return of Capital Program
Shareholder Value ◦ $74M tender offer
◦ Quarterly dividend of $0.10 per share(1)
◦ Share repurchase program - repurchased 9.6 million shares for $243.8 million as of
January 31, 2020, inclusive of shares repurchased in tender offer
• $100M increase to Return of Capital Program announced February 2020
(1) Future dividends will be considered and declared by the Board of Directors at its discretion. 17Track Record of Strategic M&A
TRWH has focused on creating long-term strategic value
Estimated Purchase Multiple / Owned Strategic Rationale
Multiple / Adj. EBITDA(1)
10x /Proven Track Record of Successful Developments –
Tiverton Casino and Twin River Hotel
• The Company has a track record of successful Twin River Hotel
developments to drive future growth
• In 2016, TRWH successfully secured approval to
relocate its Newport gaming license to a more
competitively valuable location: Tiverton
• TRWH developed the new, $129 million
Tiverton Casino from the ground-up
• TRWH also added a 136 room, $27 million hotel
to its Lincoln property
Tiverton Casino Construction Tiverton Casino
19TRWH Deploys Strategic Initiatives at Newly Acquired Properties to
Drive Incremental Cash Flow
Dover Downs Hotel & Casino Example
• Since acquiring Dover Downs on March 28, 2019, the Company has rolled out a pipeline of initiatives
designed to maximize the cash flow potential of the property
• Apply TRWH’s proven, effective marketing approach to capture new market share
• Increased frequency of outreach to targeted customers to strengthen database
• Expanded Dover Downs’ table games market by leveraging TRWH’s operating expertise and marketing
tools
• Recent and Upcoming Growth Initiatives Include: • Reconfiguration of main gaming floor
• Relocation of High Limit • Opening of new food and beverage options
• Addition of a casino smoking room • Expansion of entertainment venue to include more
• Includes slots, stadium gaming and a bar seats
• Relocation of poker room • Expected opening of Sugar Factory in 2020
• Q4 and Full Year 2019 Preliminary Adjusted EBITDA(1) of $5.5 million and $16.7 million, respectively, at
the midpoint
(1) Refer to Appendix for reconciliation of this non-GAAP financial measure to its most directly comparable measure calculated in accordance with GAAP. 20Isle of Capri Kansas City - Potential Redevelopment Rendering
Note: The above rendering is a preliminary, illustrative example of the type of structural enhancements the Company may make to
the property. Any actual changes to the property, if made, may be different from the example above.
21Isle of Capri Kansas City - Example Site Master Plan
Note: The above rendering is a preliminary, illustrative example of the type of site enhancements the Company may make to the
property. Any actual changes to the property, if made, may be different from the example above.
22TRWH Has Proven Ability to Work Collaboratively Within RI
Regulatory Framework
23Proposed New Partnership with IGT to Protect and Enhance
State Gaming Revenues
(Currently pending legislative approval)
Proposed Agreement Yields a Number of Important Benefits for Twin River
■ VLTs
– Twin River would be licensed as a technology provider and would manage
approximately 23% of the VLTs at Rhode Island facilities
– Well over one-third of the VLTs in Lincoln would be replaced with new machines over a
relatively short period of time
– Expected to be accretive to Twin River for the 18-month period from July 1, 2020
through the end of 2021
■ Investment
– Committed to investing $100 million over the term of our extended contract, including a
50,000 square foot expansion and the addition of new amenities at Twin River Casino in
Lincoln
– Proposal would extend master contracts on existing terms until June 2043
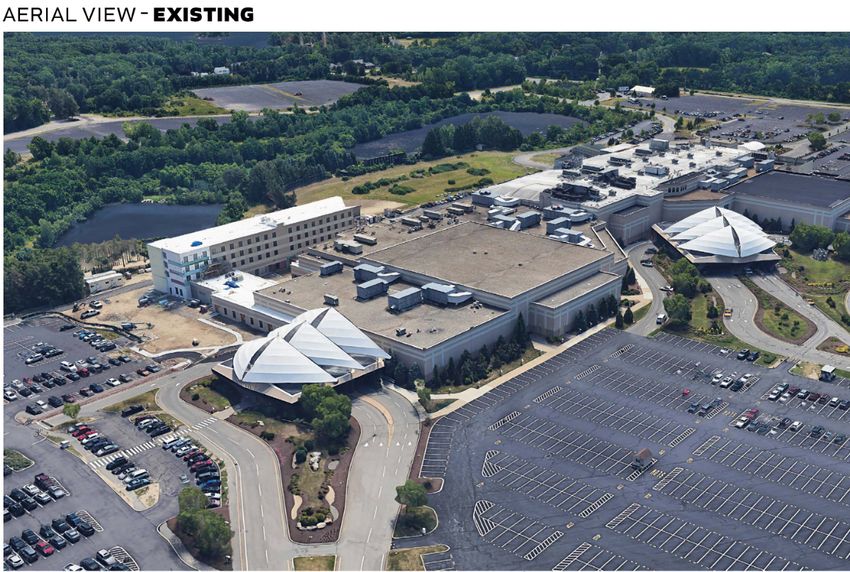
24Twin River Casino Hotel - Planned Expansion and Renovation
Investment of $100 million to update Lincoln facility
• 18-month renovation and expansion of Twin River Casino Hotel
• 40,000 square foot addition to the first floor gaming space
• 14,000 square foot spa in the hotel
• Greater separation between the smoking and non-smoking areas of the gaming floor
• New entertainment concept on second floor to be determined
25Twin River Casino Hotel - Planned Expansion and Renovation
26Two of the Nation's Top Sportsbooks to Debut in Colorado
DraftKings Inc. and FanDuel Group
• These partnerships combine our nationwide experience in gaming and casino operations
with market-leading sports betting expertise and globally recognizable brands.
• Colorado is the fifth state in the United States where the FanDuel Sportsbook platform will
be available and is the sixth state to offer the DraftKings' Sportsbook platform.
• With the acquisition of Black Hawk, the Company also acquired the right to three sports
gaming licenses in Colorado, leading to the creation of these two partnerships.
• Twin River will retain the third license for its own future use.
27Introduction to 2020 Guidance
Twin River is providing its financial outlook for the year ending December 31, 2020
The Company estimates Adjusted EBITDA for 2020 to be approximately $180 million
The Company anticipates that its annualized run-rate for Adjusted EBITDA coming out of 2020
will be approximately $190 million
The Company's guidance is based on current plans and expectations, contains a number of assumptions and includes the impact of its pending
acquisition of properties in Kansas City, Missouri and Vicksburg, Mississippi from Eldorado Resorts, Inc., which the Company expects will be
consummated early in the second quarter of 2020.
28III. Investment Highlights
In Rhode Island and Delaware, Gaming Taxes Pay for VLTs,
So TRWH Realizes Comparatively High Free Cash Flow

 ▪     TRWH maintains a significant competitive advantage because its capex is low and reasonably predictable

 ▪     TRWH’s primary capex requirements are associated with maintenance of properties or expansion projects

 Illustrative average annual TRWH VLT replacement capex covered by RI and DE

 Current number of VLTs in RI and DE                                                                                                     7,281

 Illustrative cost per VLT                                                                                                              $25,000

 Illustrative replacement cycle                                                                                                         7 years

 VLT replacement cost per annum = # VLTs x average cost of VLT / replacement cycle                                                   $26.0 million

 Illustrative average annual TRWH VLT maintenance capex covered by RI and DE

 Annual non-replacement VLTs requiring maintenance                                                                                       6,189

 Illustrative maintenance cost of each VLT                                                                                               $300

 VLT maintenance cost per annum = # non-replacement VLTs x average maintenance cost                                                  $1.9 million

 Estimated annual capex and maintenance avoided                                                                                      $28.0 million

Note: Benefit of avoided cap-ex to be reduced by approximately 23% if legislation tied to the proposed IGT VLT supply partnership is approved and
Twin River purchases percentage of VLTs.

                                                                                                                                                     30
Strong Cash Flow Generation Helps Drive Value
The Company’s Regulatory Structure is Unique, Resulting in
Higher Adjusted EBITDA to Cash Conversion(1) than the Industry Norm
▪ In Rhode Island and Delaware, the Company’s gaming equipment is funded through the top-line GGR tax
(not through the more typical Adjusted EBITDA structure)
▪ This significant cash flow advantage over other gaming operators helps to drive meaningful
value creation
▪ 2018 Adjusted EBITDA to Cash Conversion of 91%(1), versus industry average of ~83%(3)
Significant Adj. EBITDA to Cash – 2018A Adj. EBITDA to Cash Conversion(1) – 2018A
($ in millions)
*
PF Adj. EBITDA (2) Maintenance Capex PF Adj. EBITDA TRWH Cash Conversion Industry Average (3)
Cash Conversion
* 2019 Preliminary Adjusted EBITDA Cash Conversion at mid-point of range estimated at approximately $144 million
(1) Calculated as adjusted EBITDA less maintenance capex as a % of adjusted EBITDA.
(2) Refer to Adjusted EBITDA reconciliations to comparable GAAP measurements included in the Appendix. 31
(3) Based on midpoint of comparable public gaming company 2018A EBITDA and Wall Street research estimated maintenance capex.
Source: Company filings, Company prepared materials.IV. Key Financial Highlights /
Preliminary Q4 2019 and Full Year ResultsCapital Return Program Delivering Attractive Capital Returns to Shareholders
$20 million available for use under the program as of December 31, 2019*
Share Repurchases Quarterly Dividend
• Completed modified dutch auction tender offer in
the third quarter of 2019 and repurchased 2.5
million shares for cash at a price of $29.50 per • Targeted at approximately 1% annual yield(1)
share for an aggregate purchase price of $74
million • Dividends of $0.10 per share were paid and
declared for the second and third quarters of 2019
• Repurchased approximately 4.1 million and 2.5
million shares of common stock under capital • Returned approximately $7.5 million to
return program during the third and fourth quarters shareholders during 2019
of 2019, respectively
• Q4 dividend expected to be declared in February
• During the second half of 2019, the Company 2020
repurchased a total of 9.1 million shares, or 22%
of the total shares outstanding as of June 30, 2019
(1) Future dividends will be considered and declared by the Board of Directors at its discretion.
* As of January 31, 2020, $6.2 million remained available for use under the Capital Return Program. On February 10, 2020, the Board of 33
Directors approved an increase of $100 million to the program.Active Capital Return Program
Common Stock Activity
42,000,000
41,111,841 41,147,597
40,000,000
37,989,376 Q2
38,000,000 to
Q4
-2
2%
Shares Outstanding
36,000,000
34,574,587
34,000,000
32,113,328
32,000,000
30,000,000
Q4 2018 Q1 2019 Q2 2019 Q3 2019 Q4 2019
Q1:
• Issued 2,976,825 shares of common stock for acquisition of Dover Downs on March 28, 2019
Q3
• Completed modified dutch auction tender offer and repurchased 2,504,971 shares
• Repurchased additional 4,071,711 shares under capital return program
Q4
• Repurchased additional 2,486,668 shares under capital return program
34Preliminary Results - Q4 and Full Year 2019
Quarter Ended December 31, Year Ended December 31,
2019 2018 2019 2018
(in millions) Estimated Range Actual Estimated Range Actual
Revenue $129.4 - $131.4 $111.4 $522.6 - $524.6 $437.5
Net income $12.1 - $14.7 $22.1 $53.9 - $56.5 $71.4
Adjusted EBITDA(1) $38.6 - $41.6 $37.0 $165.5 - $168.5 $165.7
• Q4 preliminary estimates at the mid-point of the range for overall revenue and Adjusted
EBITDA of $130.4 million and $40.1 million represent increases of 17% and 8%,
respectively, over the same period last year.
• Fourth Quarter Results reflect revenue stabilization, improved marketing efficiency, and
reductions in cost structure in Lincoln. Performance in Dover and Tiverton exceed
expectations with solid top and bottom line growth in Biloxi.
(1) Refer to Appendix to this presentation for a reconciliation of these non-GAAP financial measures to the most directly comparable 35
measure calculated in accordance with GAAP.Rhode Island Preliminary Financial Results
• Revenue at Twin River Casino Hotel in Lincoln continues to stabilize from the impacts of new
competition in the market, with the year-over-year decrease moderating in the quarter
• Improved marketing efficiency and reductions in our cost structure also favorably impacted the
bottom line in Lincoln in Q4, up from what we feel was the bottom in Q3 2019
• Tiverton Casino Hotel continues to show marked resilience in the face of new competition with
preliminary gaming volumes up approximately 14% year-over-year
(in millions) Q4 2019 Q4 2018 % Change
Revenue $69.0 - $70.0 $79.6 (12)% - (13)%
Net income $15.8 - $17.1 $14.3 10% - 20%
Adjusted EBITDA(1) $28.4 - $30.4 $34.5 (12)% - (18)%
(in millions) YTD 2019 YTD 2018 % Change
Revenue $305.8 - $306.8 $302.7 1% - 2%
Net income $70.4 - $71.7 $68.8 2% - 4%
Adjusted EBITDA(1) $129.6 - $131.6 $143.2 (8) - (10)%
(1) Refer to Appendix to this presentation for a reconciliation of these non-GAAP financial measures to the most directly comparable 36
measure calculated in accordance with GAAP.Biloxi Preliminary Financial Results
• Biloxi turned in a solid quarter of growth on both the top and bottom lines
• Q4 2019 preliminary estimated increases in both revenue and Adjusted EBITDA up 4.3% and 11%
at the mid point of the expected range, respectively, compared to the same period last year
(in millions) Q4 2019 Q4 2018 % Change
Revenue $31.0 - $31.4 $29.9 4% - 5%
Net income $3.7 - $4.4 $3.7 0% - 20%
Adjusted EBITDA(1) $8.6 - $9.6 $8.2 5% - 17%
(in millions) YTD 2019 YTD 2018 % Change
Revenue $127.2 - $127.6 $125.1 2%
Net income $17.8 - $18.5 $18.5 0% - (4)%
Adjusted EBITDA(1) $36.8 - $37.8 $36.9 0% -2%
(1) Refer to Appendix to this presentation for a reconciliation of these non-GAAP financial measures to the most directly comparable 37
measure calculated in accordance with GAAP.Delaware Preliminary Financial Results
• Strong performance which continues to outperform our already high expectations
• Attribute continued early success to effective marketing changes along with physical changes to the
gaming floor, both of which were particularly focused on table games and the re-introduction of
tables games to the market
• The addition of amenities like new and improved restaurant offerings, which will include the Sugar
Factory in 2020, also continue to have a positive impact on the performance of the property
(in millions) Q4 2019 YTD 2019
Revenue $27.4 - $27.8 $80.6 - $81.0
Net income $1.7 - $2.3 $5.6 - $6.3
Adjusted EBITDA(1) $5.0 - $6.0 $16.2 - $17.2
(1) Refer to tables in this presentation for a reconciliation of these non-GAAP financial measures to the most directly comparable 38
measure calculated in accordance with GAAP.Appendix
Reconciliation of Preliminary Estimated Net Income to Preliminary
 Estimated Adjusted EBITDA

                                                                                 Quarter Ended December 31,                          Year Ended December 31,
                                                                                   2019                      2018                     2019                     2018
(in thousands)                                                                 at Midpoint                 Actual                at Midpoint                  Actual
Net income                                                                 $                 13.4 $                    22.1 $                   55.2 $                  71.4
Interest expense, net of interest income                                                     11.0                       6.7                     37.9                    22.9
Provision for income taxes                                                                    4.4                       5.8                     20.0                    26.4
Depreciation and amortization                                                                 9.0                       6.8                     32.3                    22.3
Non-operating income                                                                           —                         —                      (0.2)                     —
Acquisition, integration and restructuring expense                                            1.1                       2.5                     12.1                     6.8
Expansion and pre-opening expenses                                                             —                        0.1                       —                      2.7
Newport Grand disposal loss                                                                    —                         —                        —                      6.5
Share-based compensation                                                                      1.0                      (8.8)                     3.8                    (1.5)
Professional and advisory fees associated with capital return program                          —                         —                       3.5                      —
Credit Agreement amendment expenses(1)                                                        0.8                       0.1                      3.0                     0.5
Gain on insurance recoveries(1)                                                              (1.2)                       —                      (1.2)                     —
Pension withdrawal expense (1)                                                                 —                         —                        —                      3.7
Other(1)                                                                                      0.6                       1.7                      0.6                     4.0
Adjusted EBITDA                                                            $                 40.1 $                    37.0 $                  167.0 $                 165.7

Amounts in table may not subtotal due to rounding.

 (1)      See descriptions of adjustments in the "Reconciliation of Preliminary Estimated Net Income to Preliminary Estimated Adjusted EBITDA" table in the Q4 2019
          Preliminary Earnings Release.

                                                                                                                                                                 A-1
Reconciliation of Preliminary Net Income to Preliminary Adjusted
EBITDA by Segment at Midpoint
Quarter Ended December 31, 2019
(in thousands) Rhode Island Delaware Biloxi Other Total
Revenue $ 69.5 $ 27.6 $ 31.2 $ 2.1 $ 130.4
Net income $ 16.5 $ 2.0 $ 4.1 $ (9.2) $ 13.4
Interest expense, net of interest income — — — 11.0 11.0
Provision for income taxes 6.4 1.4 1.3 (4.7) 4.4
Depreciation and amortization 4.7 1.4 2.9 — 9.0
Acquisition, integration and restructuring expense — 0.1 — 1.0 1.1
Share-based compensation — — — 1.0 1.0
Credit Agreement amendment expenses(1) — — — 0.8 0.8
Gain on insurance recoveries(1) — — — (1.2) (1.2)
Other(1) — — — 0.6 0.6
Allocation of corporate costs 1.8 0.6 0.8 (3.2) —
Adjusted EBITDA $ 29.4 $ 5.5 $ 9.1 $ (3.9) $ 40.1
Amounts in table may not subtotal due to rounding.
(1) See descriptions of adjustments in the "Reconciliation of Preliminary Estimated Net Income to Preliminary Estimated Adjusted EBITDA" table in the Q4 2019
Preliminary Earnings Release.
A-2Reconciliation of Net Income to Adjusted EBITDA by Segment
Quarter Ended December 31, 2018
(in thousands) Rhode Island Biloxi Other Total
Revenue $ 79.6 $ 29.9 $ 1.9 $ 111.4
Net income $ 14.3 $ 3.7 $ 4.2 $ 22.1
Interest expense, net of interest income 2.2 — 4.5 6.7
Provision for income taxes 8.6 1.0 (3.7) 5.8
Depreciation and amortization 4.4 2.4 — 6.8
Acquisition, integration and restructuring expense — — 2.5 2.5
Expansion and pre-opening expenses 0.1 — — 0.1
Share-based compensation — — (8.8) (8.8)
Credit Agreement amendment expenses(1) — — 0.1 0.1
Other(1) 1.4 (0.3) 0.6 1.7
Allocation of corporate costs 3.7 1.4 (5.1) —
Adjusted EBITDA $ 34.5 $ 8.2 $ (5.7) $ 37.0
Amounts in table may not subtotal due to rounding.
(1) See descriptions of adjustments in the "Reconciliation of Preliminary Estimated Net Income to Preliminary Estimated Adjusted EBITDA" table in the Q4 2019
Preliminary Earnings Release.
A-3Reconciliation of Preliminary Net Income to Preliminary Adjusted
EBITDA by Segment at Midpoint
Year Ended December 31, 2019
(in thousands) Rhode Island Delaware Biloxi Other Total
Revenue $ 306.3 $ 80.8 $ 127.4 $ 9.0 $ 523.6
Net income $ 71.1 $ 6.0 $ 18.2 $ (40.2) $ 55.2
Interest expense, net of interest income 3.3 0.1 — 34.5 37.9
Provision for income taxes 26.7 2.9 5.1 (14.6) 20.0
Depreciation and amortization 18.4 4.0 9.7 0.1 32.3
Non-operating income — — — (0.1) (0.2)
Acquisition, integration and restructuring expense 0.4 1.2 — 10.5 12.1
Share-based compensation — — — 3.8 3.8
Professional and advisory fees associated with capital return
program — — — 3.5 3.5
Credit Agreement amendment expenses(1) 1.0 — — 1.9 3.0
Gain on insurance recoveries(1) — — — (1.2) (1.2)
Other(1) (0.4) — 0.1 0.9 0.6
Allocation of corporate costs 10.1 2.5 4.1 (16.8) —
Adjusted EBITDA(1) $ 130.6 $ 16.7 $ 37.3 $ (17.6) $ 167.0
Amounts in table may not subtotal due to rounding.
(1) See descriptions of adjustments in the "Reconciliation of Preliminary Estimated Net Income to Preliminary Estimated Adjusted EBITDA" table in the Q4 2019
Preliminary Earnings Release.
A-4Reconciliation of Net Income to Adjusted EBITDA by Segment
Year Ended December 31, 2018
(in thousands) Rhode Island Biloxi Other Total
Revenue $ 302.7 $ 125.1 $ 9.7 $ 437.5
Net income $ 68.8 $ 18.5 $ (15.9) $ 71.4
Interest expense, net of interest income 8.5 — 14.3 22.9
Provision for income taxes 28.7 5.0 (7.3) 26.4
Depreciation and amortization 12.9 9.3 0.2 22.3
Acquisition, integration and restructuring expense — — 6.8 6.8
Expansion and pre-opening expenses 2.7 — — 2.7
Newport Grand disposal loss 6.5 — — 6.5
Share-based compensation — — (1.5) (1.5)
Credit Agreement amendment expenses(1) — — 0.5 0.5
Pension withdrawal expense(1) 3.7 — — 3.7
Other(1) 1.4 — 2.5 4.0
Allocation of corporate costs 10.0 4.1 (14.1) —
Adjusted EBITDA $ 143.2 $ 36.9 $ (14.4) $ 165.7
Amounts in table may not subtotal due to rounding.
(1) See descriptions of adjustments in the "Reconciliation of Preliminary Estimated Net Income to Preliminary Estimated Adjusted EBITDA" table in the Q4 2019
Preliminary Earnings Release.
A-5Reconciliation of Net Leverage Ratio at Mid-point of Adjusted EBITDA Range
(in millions)
Cash on Hand $ 182
Face Value of Debt(1) $ 700
Net Debt $ 518
Preliminary Estimated Adjusted EBITDA at Midpoint for 2019(2) $ 167
Net Leverage(3) 3.1x
Adjusted EBITDA at mid-point of range:
(1) Outstanding debt before unamortized original issue discount and unamortized term loan deferred financing costs as of December 31, 2019.
(2) Refer to Appendix to this presentation for a reconciliation of this non-GAAP financial measure to its most directly comparable measure calculated in accordance with
GAAP.
(3) Net Leverage is calculated as Net Debt (Face Value of Debt less Cash on Hand) divided by Preliminary Estimated Adjusted EBITDA at Midpoint for the year ended
December 31, 2019.
A-6Adjusted EBITDA Reconciliation
TRWH and Dover 2018 Proforma
(in millions)
A-7You can also read