Realistic Test Cycle Utility Factors for Plug-in Hybrid Electric Vehicles in Europe
←
→
Page content transcription
If your browser does not render page correctly, please read the page content below
Realistic Test Cycle Utility Factors for Plug-in
Hybrid Electric Vehicles in Europe

Place: Karlsruhe
 Version 1
Date: April 2021
REALISTIC TEST CYCLE UTILITY FACTORS FOR PLUG-IN HYBRID ELECTRIC VEHICLES IN EUROPE
2 FRAUNHOFER ISI

 Imprint

 Realistic Test Cycle Utility Factors for Plug-in Hybrid Electric Vehicles in
 Europe

 Project coordination
 Fraunhofer Institute for Systems and Innovation Research ISI
 Breslauer Strasse 48, 76139 Karlsruhe, Germany
 Dr. Patrick Plötz, patrick.ploetz@isi.fraunhofer.de

 Authors
 Fraunhofer Institute for Systems and Innovation Research ISI
 Breslauer Strasse 48, 76139 Karlsruhe
 Patrick Plötz

 Contributing institutes
 ifeu - Institut für Energie- und Umweltforschung Heidelberg gGmbH

 Wilckensstr. 3, 69120 Heidelberg
 Julius Jöhrens

 Client
 Dienstleistungsauftrag „Wissenschaftliche Unterstützung Klimapolitik und Maßnahmenprogramm
 2018“ ELViS-ID E31564581
 Federal Ministry

 Picture credits
 Cover page: Own illustration.

 Recommended citation
 Plötz, P. and Jöhrens, J. (2021): Realistic Test Cycle Utility Factors for Plug-in Hybrid Electric Vehicles in Europe.
 Karlsruhe: Fraunhofer Institute for Systems and Innovation Research ISI

 Published
 April 2021

 Notes
 This report in its entirety is protected by copyright. The information contained was compiled to the best of
 our knowledge and belief in accordance with the principles of good scientific practice. The authors believe
 the information in this report is, correct, complete and current, but accept no liability for any errors, explicit
 or implicit. The statements in this document do not necessarily reflect the client’s opinion.
REALISTIC TEST CYCLE UTILITY FACTORS FOR PLUG-IN HYBRID ELECTRIC VEHICLES IN EUROPE
 FRAUNHOFER ISI 3

Contents

Summary 4

1 Introduction 5

2 Data and Methods 7
2.1 PHEV Usage Data ................................................................................................................................. 7
2.2 Methods.................................................................................................................................................. 8

3 Results 10
3.1 UF Curve for Private Cars ................................................................................................................. 10
3.2 UF Curve for Company Cars ............................................................................................................ 10
3.3 PHEV Stock UF Curve ........................................................................................................................ 12

4 Discussion 13

5 Conclusion 14

References 15
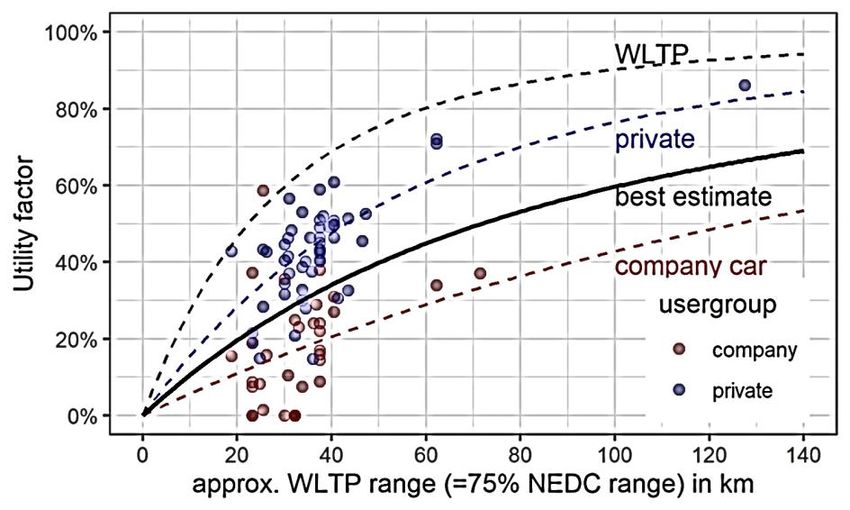
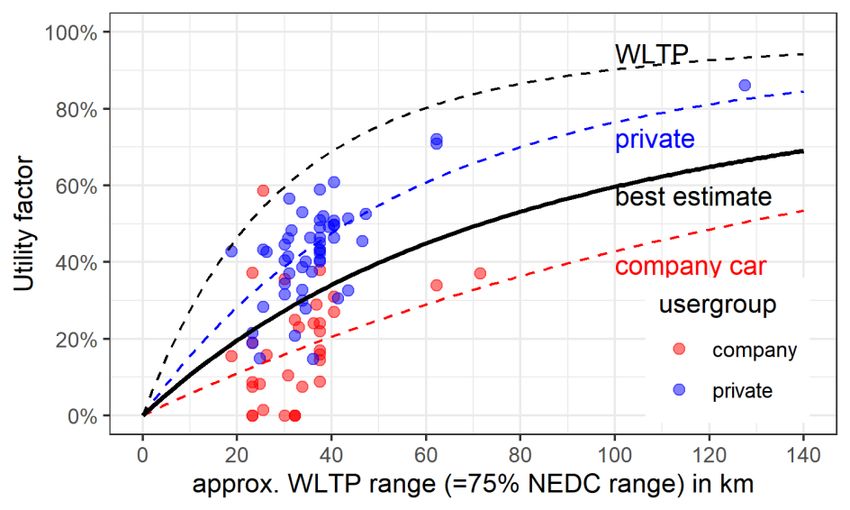
REALISTIC TEST CYCLE UTILITY FACTORS FOR PLUG-IN HYBRID ELECTRIC VEHICLES IN EUROPE
4 FRAUNHOFER ISI SUMMARY

 Summary

 Plug-in hybrid electric vehicles (PHEVs) can use electricity as well as conventional fuel for propulsion
 (Bradley & Frank, 2009). But, the potential of PHEV to reduce local pollutant and global greenhouse gas
 emissions (GHG) strongly depends on their real-world usage and the share of kilometres driven on elec-
 tricity, the so-called utility factor (UF). Generic functions for UF of PHEV are used in standardized testing
 procedures, or test cycles, such as the New European Driving Cycle (NEDC) or the Worldwide Harmo-
 nized Light-Duty Vehicles Test Procedure (WLTP). However, as empirical data on real-world usage of
 PHEV was scarce until recently, the current WLTP estimates were based on information provided largely
 by vehicle manufacturers and did not reflect real-world usage of PHEVs.
 The aim of this study is to provide UF estimates that are based on empirical PHEV usage data. For this
 purpose, real-world data on PHEV usage is taken to determine empirical parameters for generic UF
 functions.
 We fitted the existing WLTP UF function to empirical PHEV usage for 1,385 private PHEV from Germany
 and 10,872 company cars from Germany and the Netherlands. These two markets cover about 40% of
 PHEV in Europe. We find that the current WLTP UF parameters are too optimistic about real-world UF
 since long-distance driving was missing in earlier estimates, actual charging is less frequent than com-
 monly assumed and real-world all-electric ranges are lower than WLTP ranges. All three factors lower
 the actual UF compared to the WLTP UF. We empirically obtain modified UF curves for both user groups
 and one joint UF curve for both groups assuming equal mileage in both user groups (see the following
 figure).

 Figure: Real-world UF curve for private, company car and both groups combined.
 Shown are mean UF for individual PHEV model variants (circles) in private (blue) and company car (red)
 usage with the WLTP UF curve (black dashed), the best empirical private (blue), company car (red), and
 joint private and company car UF curve (solid).

 Source: Own calculations.

 Our best estimate for a realistic UF curve is the WLTP UF curve with the parameter changed from
 = 800 km in WLTP to = 1540 km in real-world operation for private cars and to = 4200 km
 for company cars. The best joint estimate with the assumption of 50% private and 50% company car
 mileage is with = 2460 km. Our results show that the existing but unrealistic WLTP UF curve can be
 easily modified to obtain more realistic UF curves for PHEV in Europe.
REALISTIC TEST CYCLE UTILITY FACTORS FOR PLUG-IN HYBRID ELECTRIC VEHICLES IN EUROPE
INTRODUCTION FRAUNHOFER ISI 5

1 Introduction

Plug-in hybrid electric vehicles (PHEVs) can use electricity as well as conventional fuel for propulsion
(Bradley & Frank, 2009). In 2020, PHEVs accounted for about 3.5% of all new passenger car registrations
in Europe.
The potential of PHEV to reduce local pollutant and global greenhouse gas emissions (GHG) strongly
depends on their real-world usage and the share of kilometres driven on electricity, the so-called utility
factor (UF) (Chan, 2007; Jacobson, 2009; Flath et al., 2013; Plötz et al., 2020).
PHEV fuel consumption values are commonly assessed in standardized testing procedures, or test cycles,
such as the New European Driving Cycle (NEDC) or the Worldwide Harmonized Light-Duty Vehicles Test
Procedure (WLTP). However, as empirical data on real-world usage of PHEV was scarce until recently,
the current test cycle estimates were based on information provided largely by vehicle manufacturers
and did not reflect real-world usage of PHEVs. Vehicles with long-distance driving were excluded from
the analysis and the mean of simulated individual UF was used as basis for the WLTP UF (Eder et al.,
2016). A few recent studies provide the first systematic investigation of PHEV usage as well as UF in
Europe (Plötz et al., 2020; Plötz et al., 2021). The underlying hypothesis of the present study is a mismatch
between empirical and official test cycle UF. To support this hypothesis, Figure 1 shows the empirical UF
from the 1,450 PHEV in Germany (aggregated to PHEV model variant mean values) and the official UF
curves according to WLTP and NEDC. Despite the still limited sample size for empirical PHEV usage and
UF, strong deviations between WLTP UF and actual UF are apparent.

Figure 1: Real-world UF in Germany and test-cycle UF as a function of all-electric range.
Shown is PHEV usage data (mean by PHEV model variant) for Germany for private and company cars.
The WLTP UF curve as a solid line and the NEDC UF curve as dashed line. WLTP ranges are assumed 75%
NEDC ranges.

Source: Plötz et al. (2020).

We observe a clear mismatch between official and actual UF. Almost all observations are smaller than
WLTP UF and only a few PHEV observations come close to the test-cycle UF. The deviation is larger for
company cars than for private vehicles. Accordingly, the apparent systematic deviation between actual
and official UF renders the derivation of empirical UF curves meaningful.
REALISTIC TEST CYCLE UTILITY FACTORS FOR PLUG-IN HYBRID ELECTRIC VEHICLES IN EUROPE
6 FRAUNHOFER ISI INTRODUCTION

 The aim of this study is to provide UF estimates that are based on empirical PHEV usage data using
 least-squares regression analysis. Thus, the present paper aims at filling the gap between simulated UF
 from conventional vehicles and real-world UF from actual PHEV.
 As of the beginning of 2021, there are about 978,000 PHEV in stock in the EU27 (according to
 www.eafo.eu). The largest markets are Germany (287,000 PHEV in stock), Sweden (132,400), France
 (132,300), the Netherlands (108,700), Belgium (75,000), Finland (45,600), Italy (44,200), and Spain
 (43,500). All other markets have less than 30,000 PHEV in stock (as of beginning 2021). The following
 figure shows the percentage.

 Figure 2: PHEV in stock shares in EU27.

 Source: Own illustration based on www.eafo.eu.

 Here, we cover private and company cars from Germany, the single largest PHEV market in Europe and
 company cars from the Netherlands. Both market contain about 40% of the PHEV in stock in the EU27.
REALISTIC TEST CYCLE UTILITY FACTORS FOR PLUG-IN HYBRID ELECTRIC VEHICLES IN EUROPE
DATA AND METHODS FRAUNHOFER ISI 7

2 Data and Methods

2.1 PHEV Usage Data
The present study uses PHEV usage data from Germany (private and company cars) and the Netherlands
(company cars). All data are taking from Plötz et al. (2020). The individual sources and data cleaning are
discussed in Detail there and we only give a short summary here (cf. Table 1).

Table 1: Summary of PHEV Usage data sources

 Source Sample size PHEV model variants Country

 Spritmonitor.de 1,385 51 Germany

 German company 72 21 Germany

 TNO 10,800 14 Netherlands
Source: Own calculations.

For privately owned vehicles in Germany, we use Spritmonitor.de as source. Spritmonitor.de is a free
German web service that allows users to track fuel consumption of their vehicles. When registering a
vehicle, the user must provide various specifications, such as brand, model, model variant such as engine
type or equipment line, fuel type and build year, vehicle power, and transmission type. Users provide
odometer reading, distance travelled since the last refuelling, and fuel volume added. Data available for
analysis includes total mileage, total fuel consumption, and the resulting real-world fuel consumption of
each vehicle. Consumption is calculated as the total fuel used by the vehicle divided by total mileage.
The UF was calculated according to the methodology explained in section 2.2. After data cleaning, a
sample of 1,385 is obtained that represented 1% of the German PHEV stock in 2020.
For company cars in Germany, data from a large private company in Germany with more than 10,000
employees was obtained. The data covers leased PHEVs for which the leasing contract had already
ended. The vehicles were used by specific employees and only available to the specific employees. The
utilization period was between half a year and four years, covering 2016–2020. Detailed vehicle specifi-
cations are available, such as vehicle brand, model, and model variant. Driving data comprises the main
odometer reading when returning the vehicle after the end of the leasing contract and real-world fuel
consumption over the entire observation period. The sample stems only from one company, but the
observed fuel consumption values and impact of all-electric range are in line with the much larger com-
pany car sample from the Netherlands (see below). The UF was calculated according to the methodology
explained in section 2.2. For this study, a sample of 72 vehicles was available. This sample is quite limited
but not far from the original sample of 100 combustion engine vehicles that were used to derive the
official WLTP UF curve (Eder et al., 2016).
For the Netherlands, Company car fuel consumption values are available from (Van Gijlswijk & Ligterink,
2018) as well as (Ligterink & Eijk, 2014). The individual values have been taken from these publications.
However, one draw back of this data is the lack of sample sizes for individual PHEV models, only the
total number of PHEV in the sample is available with N = 10,800, and it can be assumed that each PHEV
model has a minimum of several hundred observations. On the other hand, an advantage of the data is
that the mean UF per PHEV model is already part of the data and does not have to be derived from the
observed real-world fuel consumption.
Detailed vehicle specifications such as fuel consumption or all-electric range according were taken from
the ADAC-Autokatalog (ADAC, 2020), which contains the required information for PHEV models availa-
ble on the European market.
REALISTIC TEST CYCLE UTILITY FACTORS FOR PLUG-IN HYBRID ELECTRIC VEHICLES IN EUROPE
8 FRAUNHOFER ISI DATA AND METHODS

 Please note that WLTP information was available for a very small sub sample of the data described above.
 Accordingly, NEDC values have been used throughout for the all-electric range and converted to WLTP
 as follows. We assume a higher real world electricity consumption for WLTP compared to NEDC (Dornoff
 et al., 2020). This leads to a lower all-electric range. We assume that the WLTP range is three quarters of
 the NEDC range. This is the value has been used in the initial UF definition for the WLTP (Eder et al.,
 2016). This value should be viewed as a conservative estimate; analysis of a small sample of current PHEV
 models suggests that values of around 85-90% are typical.1 This means our method will tend to slightly
 over-estimate empirically derived electric driving shares.

 2.2 Methods
 The present section explains the UF curves, i.e. the function relating the PHEV's all-electric range to an
 expected UF, the calculation of the empirical UF, and the regression method to obtain empirical UF
 curves from PHEV usage data.

 WLTP UF Definition
 The official WLTP UF curve2 in Europe is given by
 10 AER
 UF(AER, ) = 1 − exp [− ∑ ( ) ],
 =1
 where AER is the WLTP all-electric range in km and the numerical constants and for Europe are
 = 800 km, 1 = 26.25, 2 = −38.94, 3 = −631.05, 4 = 5964.83, 5 = −25095, 6 = 60380.2, 7 =
 −87517, 8 = 75513.8, 9 = −35749, 10 = 7154.94 according to (EC 2017). These official WLTP param-
 eters for the curve have been determined from driving data of conventional vehicles, analysing their
 daily mileages and assuming a full recharge every night for PHEVs. Furthermore, vehicle profiles with
 mileages of more than 100 km per day had been eliminated from the driving data, since such profiles
 were not regarded economically feasible for PHEVs. However, more recent empirical data shows the
 private vehicles in Germany are – on average – only charged three out of four nights and company cars
 only every second (Plötz et al., 2020). Furthermore, PHEV show much long distance driving and more
 than 100 km of daily driving are not exceptional (Plötz et al., 2020). Thus, some of the assumptions in
 the derivation of the WLTP UF curve are not fulfilled in actual PHEV usage.
 The official WLTP curve with its exponential form provokes the general question of matching functional
 forms for UF curves and their dependence on all-electric range. Quite generally, four fundamental con-
 ditions appear required for any UF curve: (1) Its range should be limited to the interval from zero to one,3
 (2) it should be zero at zero all-electric range, (3) it should converge to one as the all-electric range
 approaches infinity, and (4) it should be monotonically increasing with all-electric range. An infinite num-
 ber of mathematical functions fulfil these criteria. However, practical aspects make simple forms with
 only a few parameters preferable. The form UF( ) = 1 − exp(− ( )) with a monotonically increasing

 1
 This value is consistent with the deviation between WLTP and NEDC range in a small sample of PHEV from the ADAC autokatalog, where we in-
 cluded the BMW 225 XE iPerformance, BMW x5 xDrive 45e, Mercedes A 250 e, Hyundai IONIQ Plug In-Hybrid, Volvo XC60 T8 Twin Engine, Opel
 Grandland X 1.6 DI Turbo Hybrid4 , and Opel Grandland X 1.6 DI.
 2
 Strictly speaking, the UF in the WLTP definition measures the share of km driven in charge depleting mode which allows for intermittent deploy-
 ment of the internal combustion engine (ICE). In contrast, we derive our empirically estimated UFs based on a tacit estimate of the driving share
 in pure electric mode with zero fuel consumption. Depending on powertrain characteristics and operating strategy, some vehicles may not fore-
 see any ICE deployment in charge depleting mode, i.e. there is no difference between pure electric mode and charge depleting mode. Other
 vehicles tend to increasingly make use of their ICE under higher load conditions and with decreasing battery state of charge. In such cases, the
 share of km driven in charge depleting mode with non-zero fuel consumption is higher than the share in pure electric mode with zero fuel con-
 sumption. At the same time, the charge depleting range is higher than pure electric range. Overall, we expect our method of estimating the
 relationship between pure electric range and the share of km driven in pure electric mode to result in a very similar UF-curve compared to esti-
 mates based on the relationship between charge depleting range and share of km driven in charge depleting mode. However, more research on
 the relation between pure-electric UF and CD-mode UF is required.
 3
 and need only be defined for non-negative all-electric ranges.
REALISTIC TEST CYCLE UTILITY FACTORS FOR PLUG-IN HYBRID ELECTRIC VEHICLES IN EUROPE
DATA AND METHODS FRAUNHOFER ISI 9

function ( ) and = AER/ being the all-electric range divided by a scale parameter requires already
the first three criteria. Accordingly, the WLTP UF curve fulfils the general criteria that a UF curve should
meet. The complexity of the function form, i.e. a polynomial of degree ten in the case of the UF curve,
should be large enough to follow empirical data, but not more complex. Thus, the general form of the
official UF curve is acceptable. However, one or several of the parameters should be chosen such that
the curve follows actual real world UF data.

The parameter in the official UF curve is an effective driving distance that rescales the all-electric
range. Higher means that the same all-electric range leads to a lower UF. For the present study we
use the official WLTP UF curve but treat the scaling parameter as a free parameter. This has the
advantage that we keep the functional form of the UF curve which has the right asymptotic behaviour
(zero UF for zero km range, 100% UF for infinite range and strong monotonically increasing) and would
be simple to change in legislation as only one parameter needs to be changed. In the results part below,
we will obtain values that lead to UF curves following the empirical UF data.

UF Calculation from Fuel Consumption Data
For the Dutch dataset, UFs are explicitly given and can be used as input values for the regression analysis.
For the other datasets, where the actual UF is missing, we estimate the real-world UF from the real-world
fuel consumption
 UF real = 1 − FC real /FCcs
 real

with "CS" indicating "charge sustaining mode". Here, FCcs real
 is approximated by taking NEDC values with
50% addition for real-world driving, similar to the deviation between NEDC and real-world fuel con-
sumption of HEV (Plötz et al., 2020; Dornoff et al., 2020, Tietge et al., 2019):

 real
 FC NEDC
 NEDC
 FCcs = 1.5 FCcs = 1.5
 .
 1 − UF NEDC
In cases with very high real-world fuel consumption, this approach can lead to negative UF. We set the
estimated UF to zero in these cases. If EPA values are available, we use EPA values for charge-sustaining-
mode fuel consumption: FCcs real EPA
 = FCcs . Likewise, when the real UF is known, the real-world consump-
tion can be estimated by inverting the above equations:
 FC real = FCcs
 real
 (1 − UF real ) = 1.5 FCcs
 NEDC
 (1 − UF real ).
For all WLTP cases with UF missing, NEDC fuel consumption values were available and the UF derived as
explained above. A further discussion of the applied method for UF calculation can be found in (Plötz et
al., 2020).

Regression Analysis
We used standard statistical methods to find the value for the parameter that best matches the em-
pirical data. "Best" is defined as smallest sum of squared deviations. More specifically, we use non-lin-
ear weighted least squares to adjust for differences in sample size in regression. To correct for the dif-
ferent sample sizes in the observations for mean UF, each observation is weighted.4 As the UF function
depends non-linearly on the parameter, we perform a non-linear fit.

4
 by the inverse of its standard error which is proportional to the square roots of sample sizes, cf. (Plötz et al., 2020)
REALISTIC TEST CYCLE UTILITY FACTORS FOR PLUG-IN HYBRID ELECTRIC VEHICLES IN EUROPE
10 FRAUNHOFER ISI RESULTS

 3 Results

 3.1 UF Curve for Private Cars
 We first derive an empirical UF curve for private vehicles in Germany, following the methodology out-
 lined in the previous section. We use the UF curve from WLTP but treat the scaling parameter as free
 parameter and find the which best fits the empirical data by sample size weighted non-linear least
 squares. The resulting best estimate from the non-linear sample size weighted regression is =
 1544 ± 124 km (with ± two standard errors) and = 1750 ± 140 km if WLTP range is assumed 85%
 NEDC range. Thus the empirical is around twice the official WLTP value of = 800 km. This is effec-
 tively rescaling the daily driving distance by a factor of two, i.e. real world vehicles need about twice the
 range to reach the official WLTP UF than expected from WLTP. The data and best empirical UF curve are
 shown in Figure 2.

 Figure 2: Utility factor as a function of all-electric range for private cars in Germany.
 Shown is PHEV usage data (mean by PHEV model variant) for private cars in Germany (circles by sample
 size with larger circles for larger samples). The WLTP UF curve is shown as dashed grey line, the best
 empirical UF curve as black solid line (with ± two standard errors as this dashed lines). WLTP ranges are
 assumed 75% NEDC ranges.

 Source: Own illustration.

 The figure also shows the empirical UF curve when the statistical uncertainty of the parameter is taken
 into account as thin dashed lines. It shows that the deviation from the official UF curve is much larger
 than the statistical inaccuracy.

 3.2 UF Curve for Company Cars
 We now turn to real-world UF of company cars. In a first step, only company cars from Germany are
 analysed. We perform sample size weights non-linear regression and obtain the best estimate as =
 4740 ± 2250 km (and = 5400 ± 2500 km if WLTP range is assumed 85% NEDC range). Thus the em-
 pirical is around six times the official WLTP value of = 800 km. This is effectively rescaling by a
 factor of six, i.e. real world vehicles need about six times the range to reach the official WLTP UF than
 expected from WLTP. The data and best empirical UF curve are shown in Figure 3. The figure also shows
REALISTIC TEST CYCLE UTILITY FACTORS FOR PLUG-IN HYBRID ELECTRIC VEHICLES IN EUROPE
RESULTS FRAUNHOFER ISI 11

the empirical UF curve when the statistical uncertainty of the parameter is taken into account as thin
dashed lines, but the deviation between official UF curves is much larger than the statistical inaccuracy.

Figure 3: UF versus all-electric range for company cars in Germany.
Shown is PHEV usage data (mean by PHEV model variant) for company cars in Germany (circles by sam-
ple size). The WLTP UF curve is shown as dashed grey line, the best empirical UF curve as black solid line
(with ± two standard errors as this dashed lines). WLTP ranges are assumed 75% NEDC ranges.

Source: Own illustration.

As the company car sample from Germany has a very limited sample size, we combine the larger data
set from the Netherlands (N = 10,800) with the German data. However, as no information is available on
the individual sample sizes for PHEV model variants in the Dutch data, we can only perform non-
weighted least squares regression. Figure 4 shows the resulting UF curve.

Figure 4: UF versus all-electric range for company cars in Germany and the Netherlands.
Shown is PHEV usage data (mean by PHEV model variant) for company cars in Germany and the Neth-
erlands (circles). WLTP UF curve as dashed grey line, best empirical UF curve solid line (± two SE dashed).

Source: Own illustration.
REALISTIC TEST CYCLE UTILITY FACTORS FOR PLUG-IN HYBRID ELECTRIC VEHICLES IN EUROPE
12 FRAUNHOFER ISI RESULTS

 We obtain as best estimate for company cars in Germany and the Netherlands as = 3900 ± 1050 km
 (and = 4400 ± 1200 km if WLTP range is assumed 85% NEDC range). Thus the empirical is almost
 six times the official WLTP value of = 800 km. This is effectively rescaling by a factor of six, i.e. real
 world vehicles need about five times the range to reach the official WLTP UF than expected from WLTP.
 Figure 4 also shows the empirical UF curve when the statistical uncertainty of the parameter is taken
 into account as thin dashed lines, but the deviation between official UF curves is much larger than the
 statistical inaccuracy.
 Taking both results together, i.e. the sample size weighted regression for Germany and the non-
 weighted regression for Germany and the Netherlands, we obtain approximately = 4500 km as best
 empirical estimate for a UF curve for company cars in Europe.

 3.3 PHEV Stock UF Curve
 As the actual PHEV stock consists of both private and company cars, we combine the estimate into a
 joint best-estimate UF curve as an evenly weighted average of the above curves. Currently, the share of
 company cars in PHEV stock in Germany is slightly above 50% (cf. Jöhrens et al. 2020). It is conceivable
 that the share of private PHEV stock will increase over time as company cars are sold off to the private
 market after 3-4 years. However, the average annual mileage driven for company cars is significantly
 higher than for private cars. We expect the impact of slightly higher private ownership versus lower
 mileage under private ownership to approximately cancel each other out. It therefore appears appropri-
 ate to weigh company cars and private cars evenly.
 We obtain the weighted sum of the two UF curves is 0.5 UF(AER, = 1544) + 0.5 UF(AER, = 3900).
 Please note that the weighted sum of this functions with two parameters is not equal to the function of
 the weighted sum of parameters as the UF function is non-linear in the paramter. However, the
 weighted sum has a form similar to the original UF function and we can find a parameter value that
 closely matches the weighted sum. We obtain a UF curve with = 2460 km as good estimate for the
 joint private and company car UF curve. In this case the mean absolute percentage deviation from the
 weighted sum is 3.7%. All UF curves are shown in Figure 5.
REALISTIC TEST CYCLE UTILITY FACTORS FOR PLUG-IN HYBRID ELECTRIC VEHICLES IN EUROPE
DISCUSSION FRAUNHOFER ISI 13

Figure 5: UF versus all-electric range for private and company cars.
Shown are mean UF for individual PHEV model variants (circles) in private (blue) and company car (red)
usage with the WLTP UF curve (black dashed), the best empirical private (blue), company car (red), and
joint private and company car UF curve (solid).

Source: Own illustration.

In summary, we obtain an empirical UF curve that takes the functional form of WLTP curve but is derived
from empirical data.

4 Discussion

The aim of this study was to derive a best estimate of the current EU real-world utility factor given the
empirical data currently available. The resulting curve comes with some uncertainty. The key issue is that
currently available data is limited and cannot be considered a truly random sample of the EU PHEV fleet.
Inter alia, our sample covers only two European countries. However, these two countries alone currently
cover 40% of the PHEV stock in Europe. Furthermore, similarly low UF are observed in other major mar-
kets. For example, Plötz et al. (2020) collected a small sample of fuel consumption values from PHEV
user reports in the UK, most likely private vehicles. For the 43 PHEV under consideration the mean real-
world fuel consumption was much higher than test-cycle values implying similarly low UF. These num-
bers deviation observed in the small UK sample are consistent with the findings for Germany. The devi-
ation between test cycle and actual UF is less pronounced but still present for Norway acc. to. (Plötz et
al., 2020). Yet, Norway has some of the most beneficial economic conditions for high electric driving
shares, as it has some of the highest fuel prices and lowest electricity prices in Europe. On the other
hand, Germany has some of the highest private electricity prices in Europe and comparatively low fuel
prices. In conclusion, the PHEV UF results presented here appear realistic for major markets in Europe
but the deviation could be less pronounced in markets with very favourable energy prices.
For company cars, the data is from countries where incentives for owning company cars were quite
pronounced while incentives for electric driving are generally limited. Often, company car drivers own a
fuel card from the employer to refuel for free and therefore have little financial incentive to plug in. Yet,
the obtained curves solely rely on empirical usage data and appear realistic for markets with these eco-
nomic conditions. However, it is conceivable that average company car utility factors could improve (in
the direction of private utility factors) in future, if company policies and Member State policies to support
electric driving were improved accordingly.
REALISTIC TEST CYCLE UTILITY FACTORS FOR PLUG-IN HYBRID ELECTRIC VEHICLES IN EUROPE
14 FRAUNHOFER ISI CONCLUSION

 At present, however, we believe that our “best estimate” is more likely to over-estimate than to under-
 estimate the true current average electric driving share in the EU: First, we used the assumption that the
 WLTP range is about 75% of the NEDC range while the true value is probably closer to 85%. (A systematic
 comparison between WLTP and NEDC ranges would be required but is beyond the scope of the present
 short paper.) Second, we estimated real world electric driving shares based on conservative estimates of
 real world fuel consumption (details described above) which in turn leads to optimistic electric driving
 shares. Third, the sample of private users draws on voluntarily self-reported fuel consumption. It is there-
 fore likely to be biased towards users with an above-average interest in their vehicle’s energy consump-
 tion. This is likely to coincide with more regular charging behaviour. Fourth, our sample only includes
 two vehicle models with high electric range: the Chevrolet Volt/Opel Ampera and the BMW i3 REX.
 Compared to other plug-in hybrids, those two models resemble pure electric vehicles and are generally
 referred to as “range-extended electric vehicles”; moreover the i3 REX’s fuel tank only holds 9 litres. Due
 to these vehicle characteristics, their electric driving share is likely to exceed that of other PHEVs with
 similar range. Data on spritmonitor.de of three recent PHEV models with WLTP ranges between 68 and
 98 km (not included in our slightly older data set) suggest significantly lower electric driving shares
 compared to the Volt/Ampera and the i3 REX.
 Despite the very limited data on long range PHEVs, our estimate of about 60 % mean UF for PHEV with
 100 km all-electric WLTP range is consistent with an OEM’s expectation on future UFs of around 50%-
 60% with a 100 km range5.
 We therefore believe our study will be helpful in informing policy debates around a revision of the WLTP
 utility factor. There is a possibility that the true UF-curve will generally improve over time as infrastructure
 and incentives for electric driving are improved across the EU. Moreover, as more empirical data be-
 comes available, future UF-curves will describe the true (and evolving) relationship between electric
 ranges and electric driving shares more accurately than our current best estimate. Therefore, the UF-
 curve should be revised regularly.

 5 Conclusion

 Recent empirical studies provide evidence that the current WLTP utility factor (UF) function is too opti-
 mistic compared to empirical observations of real world electric driving shares of plug-in hybrids. Rea-
 sons include long-distance driving being excluded in the development of the WLTP function, actual
 charging being less frequent than commonly assumed and real-world all-electric ranges being lower
 than WLTP ranges. All three factors lower the actual UF compared to the WLTP UF. The aim of this study
 was to provide UF estimates based on empirical PHEV usage data. We believe our “best estimate” offers
 an approximation of the current “real world”-UF in the EU, more likely over-estimating than under-esti-
 mating it. Our study therefore provides a starting point for a potential revision of the WLTP UF. The true
 UF-curve may generally improve over time as infrastructure and incentives for electric driving are im-
 proved across the EU. Moreover, as more empirical data becomes available, future UF-curves will de-
 scribe the true (and evolving) relationship between electric ranges and electric driving shares more ac-
 curately than our current best estimate. Therefore, the UF-curve should be reviewed regularly and, where
 necessary, revised.

 5
 Cf. https://www.auto-motor-und-sport.de/tech-zukunft/alternative-antriebe/interview-bmw-entwicklungsvorstand-frank-weber-elektroauto-
 wasserstoff-phev-zukunft/
REALISTIC TEST CYCLE UTILITY FACTORS FOR PLUG-IN HYBRID ELECTRIC VEHICLES IN EUROPE
REFERENCES FRAUNHOFER ISI 15

Table 2: Summary of parameter estimates for UF curve
Shown are the WLTP and the best empirical values for the parameter of a modified WLTP UF curve
 =1 (AER⁄ ) ], where AER is the WLTP all-electric range in km and c1...c10 are
UF (AER, ) = 1 − exp[− ∑10

the numerical constants in the current WLTP regulation (EC 2017).

 Data parameter

 WLTP 800 km

 Private only 1544 ± 124 km

 Company car only 4500 ± 1500 km

 Best estimate 2600 ± 800 km
Source: Own calculations.

We fitted the existing WLTP UF function to empirical PHEV usage for 1,385 private PHEV from Germany
and 10,872 company cars from Germany and the Netherlands. These two markets cover about 40% of
PHEV in Europe. We empirically obtain modified UF curves for both user groups and one joint UF curve
for both groups assuming 50% stock share for each.
Our best estimate for a realistic UF curve is the WLTP UF curve with the parameter changed from
 = 800 km in WLTP to = 1540 km in real-world operation for private cars and to = 4500 km
for company cars. The best joint estimate with the assumption of 50% private and 50% company cars in
PHEV stock is with = 2600 km. Our results show that the existing but unrealistic WLTP UF curve can
be easily modified to obtain more realistic UF curves for PHEV in Europe.

References

Bradley, T. H., & Frank, A. A. (2009). Design, demonstrations and sustainability impact assessments for
 plug-in hybrid electric vehicles, Renewable and Sustainable Energy Reviews 13(1), 115-128.
Chan, C. C. (2007). The state of the art of electric, hybrid, and fuel cell vehicles. Proceedings of the IEEE
 95(4), 704-718.
Cui, H. (2018). China's New Energy Vehicle mandate policy (final rule). ICCT Policy update.
 https://theicct.org/publications/china-nev-mandate-final-policy-update-20180111
Dornoff, J., Tietge, U., & Mock, P. (2020): On the way to "real-world" CO2 values: The European passenger
 car market in its first year after introducing the WLTP. International Council on Clean Transporta-
 tion (ICCT).
EC (European Commission). (2017). Commission Regulation (EU) 2017/1151 supplementing Regulation
 (EC) No 715/2007 of the European Parliament and of the Council on type-approval of motor ve-
 hicles with respect to emissions from light passenger and commercial vehicles (Euro 5 and Euro
 6) and on access to vehicle repair and maintenance information, amending Directive 2007/46/EC
 of the European Parliament and of the Council, Commission Regulation (EC) No 692/2008 and
 Commission Regulation (EU) No 1230/2012 and repealing Commission Regulation (EC) No
 692/2008. https://eur-lex.europa.eu/legal-content/EN/TXT/?uri=CELEX:02017R1151-20200125
Eder, A., Schütze, N., Rijnders, A., Riemersma, I., and H. Steven (2016): Development of a European Utility
 Factor Curve for OVC-HEVs for WLTP. Appendix 1 – Utility Factors In: Riemersma, I. (2016): Tech-
 nical Report on the development of a Worldwide Harmonised Light duty vehicle Test Procedure
 (WLTP). https://www.unece.org/fileadmin/DAM/trans/doc/2015/wp29grpe/GRPE-72-02-
 Rev.1.pdf.
REALISTIC TEST CYCLE UTILITY FACTORS FOR PLUG-IN HYBRID ELECTRIC VEHICLES IN EUROPE
16 FRAUNHOFER ISI REFERENCES

 Ligterink, N.E. & Eijk, A.R.A. (2014. Update analysis of real-world fuel consumption of business passenger
 cars based on Travelcard Nederland fuelpass data, TNO report. TNO 2014 R11063.
 Plötz, P., Funke, S. A., & Jochem, P. (2018a). Empirical fuel consumption and CO2 emissions of plug-in
 hybrid electric vehicles. Journal of Industrial Ecology 22(4), 773-784.
 Plötz, P., Funke, S. A., & Jochem, P. (2018b). The impact of daily and annual driving on fuel economy and
 CO2 emissions of plug-in hybrid electric vehicles. Transportation Research Part A: Policy and Prac-
 tice 118, 331-340.
 Plötz, P., Funke, S. A., Jochem, P. & Wietschel, M. (2017). CO2 mitigation potential of plug-in hybrid
 electric vehicles larger than expected. Scientific Reports 7, 16493.
 Tietge, U., Díaz, S., Yang, Z., & Mock, P. (2017). From laboratory to road international. A comparison of
 official and real-world fuel consumption and CO2 values for passenger cars in Europe, the United
 States, China, and Japan. International Council on Clean Transportation (ICCT).
 Tietge, U., Díaz, S., Mock, P., Bandivadekar, A., Dornoff, J., & Ligterink, N. (2019). From laboratory to road.
 A 2018 update of official and "real-world" fuel consumption and CO2 values for passengers cars
 in Europe. International Council on Clean Transportation (ICCT); Netherlands Organisation for Ap-
 plied Scientific Research (TNO).
 Tietge, U., Díaz, S., Yang, Z., & Mock, P. (2017): From laboratory to road international – A comparison of
 official and real-world fuel consumption and CO2 Values for passenger cars in Europe, the United
 States, China, and Japan.
 Van Gijlswijk, R. & Ligterink, N. (2018). Real-world fuel consumption of passenger cars based on moni-
 toring of Dutch fuel pass data 2017. TNO 2018 R10371. TNO. The Hague, Netherlands.
 Jöhrens, J., Räder, D., Kräck, J., Mathieu, L, Blanck, R., & Kasten, P. (2020): Plug-in hybrid electric cars:
 Market development, technical analysis and CO₂ emission scenarios for Germany. Study on behalf
 of the German Federal Ministry for the Environment, Nature Conservation and Nuclear Safety.
 Heidelberg / Brussels / Berlin, September 2020
You can also read