The Impact of the Underwater Hull Anti-Fouling Silicone Coating on a Ferry's Fuel Consumption - MDPI
←
→
Page content transcription
If your browser does not render page correctly, please read the page content below
Journal of
           Marine Science
           and Engineering

Article
The Impact of the Underwater Hull Anti-Fouling
Silicone Coating on a Ferry’s Fuel Consumption
Adam Kowalski
 Institute of Marine Traffic Engineering, Faculty of Navigation, Maritime University of Szczecin, 1-2 Wały
 Chrobrego St., 70-500 Szczecin, Poland; adam.kowalski@am.szczecin.pl

 Received: 20 January 2020; Accepted: 13 February 2020; Published: 15 February 2020

 Abstract: There are well-known specifics of ro-pax ferry shipping, such as the time factor as a
 consequence of keeping a regular timetable and the priority given to minimizing heeling, pitching,
 and rolling caused by maximum focus on passenger comfort and ro-ro cargo safety. It is also extremely
 important to control the ferry’s fuel consumption, being one of the most important cost components.
 The aim of the article is to draw the attention of shipping company managers to the great potential
 that lies in the use of routine operational data, collected exclusively on board the ferries. It is
 worth noting that the research in this paper is based on standard office software packages rather
 than advanced statistical methods of data analysis, which are usually not accessible for shipping
 managers. Contrary to typical ocean-going vessels, there are a number of factors that need to be taken
 into consideration when analyzing ro-pax ferry fuel consumption. Moreover, these factors occur,
 in many cases, accidentally and, thus, they are difficult to observe on board the ferry without utilizing
 expensive and time-consuming methods. The possibility of fuel control is important not only for
 economic reasons but also due to air pollution caused by engine exhausts. The article presents an
 estimation of increased fuel consumption caused by the degradation of the hull silicone anti-fouling
 coating. The presented estimations of fuel consumption may be treated as the base for calculations of
 the economic effectiveness of ferries. The attempt to resolve the above-mentioned problem was made
 on the basis of research on a real ferry, which took place on the Świnoujście-Trelleborg line between
 2007 and 2019.

 Keywords: ferry navigation; fuel consumption; hydrometeorological conditions; main engine load;
 marine traffic engineering; restricted areas; silicone anti-fouling coating

1. Introduction
     The ability to estimate fuel consumption is one of the key aspects of merchant ship operation and
requires advanced statistical methodology [1]. There are formulas for determining the fuel consumption
of ships taking into account loading conditions [2]. In the case of ferry berthing, it is extremely important
to maneuver effectively in the most difficult hydrometeorological conditions. Any reduction in draft
changes the maneuverability by increasing the windage area, among other factors. Therefore, action
should be taken (including ballasting) to maintain a stable draft, optimal from the point of view of
maneuvering. For this reason, for ferry navigation, dependencies may be especially useful that specify
fuel consumption in which the displacement of the ferry is not included [3,4]. Usually, based on the
technical data and the results of the sea trials, a fuel consumption curve is determined for a given
vessel speed [5,6]. The ship’s owner determines the maximum fuel consumption and corresponding
minimum attainable speed for the ship under acceptable hydrometeorological conditions. Due to the
possibility of determining significant factors disrupting the amount of main-engine fuel combustion,
ship charter agreements precisely define the fuel consumption during navigation only in non-restricted
areas [7]. Most often, the ship is obliged to comply with charter party requirements regarding fuel

J. Mar. Sci. Eng. 2020, 8, 122; doi:10.3390/jmse8020122                              www.mdpi.com/journal/jmse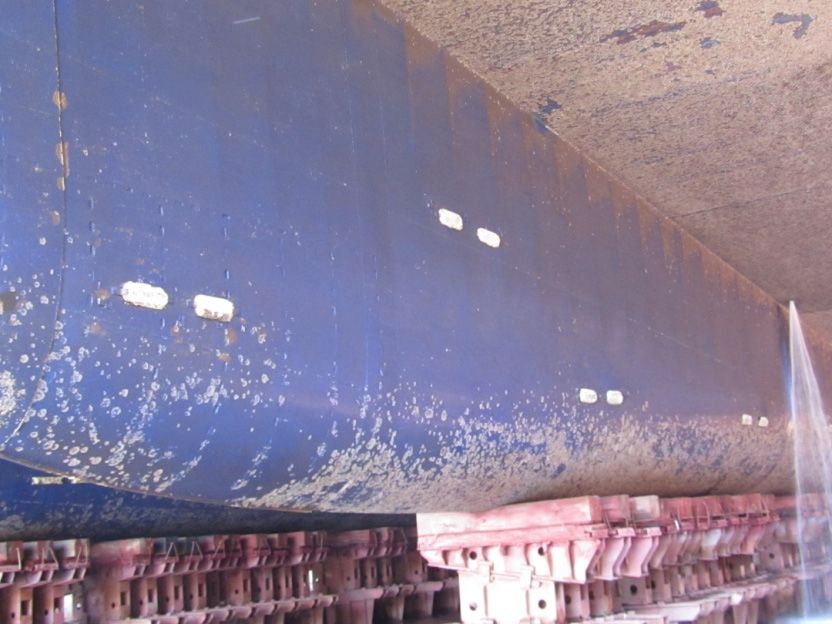
J. Mar. Sci. Eng. 2020, 8, 122                                                                          2 of 13

consumption if the sea state does not exceed four degrees on the Douglas scale or the wind force is
not more than five on the Beaufort scale [8]. The above-described principles no longer apply when
there are vertical or horizontal restrictions in a given area when the ship is maneuvering or navigating
with a pilot on board. Therefore, in such cases, typical charter party agreements do not contain precise
pre-imposed fuel consumption quantity standards. This situation occurs due to the fact that it is
extremely difficult to determine fuel consumption when additional movement resistances are observed.
These resistances are the result of frequent course and speed changes and the effects of shallow water.
However, during the operation of a commercial ship, for example, bulk carrier or general cargo ship,
periods of sailing in unrestricted areas are dominant. As a result, it is here that fuel efficiency criteria
can be effectively defined.
      The situation is different in the case of liner shipping, where vessels very often sail in restricted
areas. However, on the Baltic Sea, ferries and other ships sail entirely in restricted areas; thus, they
often change both course and speed [9]. In other words, the number of factors that may have an
influence on fuel consumption seems to be enormous, and moreover, is difficult to estimate precisely
in such conditions.
      The next section of the article presents the ferry as the research object, along with a brief description
of the area in which the ferry operates. The same section also shows the sources and the method of
data collection and the initial data classification. The aim of Section 3 is to analyze the collected data.
It also focuses the readers’ attention on the possible impact of the degradation of silicone coating of
the underwater part of the hull on the increase of ferry fuel consumption. At the end of the article,
the obtained results are discussed. Finally, the disruptive factors that may affect the conclusions of the
research are presented.

2. Materials and Methods

2.1. Object of the Study
      The assessment of ferry fuel consumption is important for the economic results of a business project.
However, the existing methods based on the ship’s daily reports require advanced mathematical
formulae for analysis [10]. This article proposes a simple method of controlling the ferry fuel
consumption with research based on operational data available on the vessel. The data comes from
routine observations carried out by the ferry crew and noted in the ship’s logbook. For the data
analysis, the popular spreadsheet Microsoft Excel was used but with the statistical analysis block,
which allowed the possibility of using the method among people with only basic spreadsheets skills.
The direct purpose of the research is to exemplify the increase of fuel consumption as a result of time
degradation of the anti-fouling coating. The object of the research was a ferry (overall length 158 m,
width 28.5 m, twin controllable pitch propeller, with the total power of two engines being 7920 kW)
with silicone paint covering the entire underwater section of the hull. Silicone paint smoothness and
elasticity (being the bending ability under the influence of overboard water flow during the movement
of the ferry) allows for detachment of organisms trying to stick to the hull. The effectiveness of
silicone coating has been proven for faster ferries, especially in the absence of ice; however, on the
tested ferry, silicone coating was applied experimentally due to its slow speed, with the highest value
not exceeding 16 kts. The silicone coating was applied in August 2007, and since then, significant
renovation has not been carried out Figure 1 with the only maintenance being hull water pressure
washing operations undertaken during dry docking (five times). The ferry operates continuously in
similar loading conditions and, regardless of loading condition differences, ballasts are used to achieve
the same optimal trim and draft. Therefore, this factor is omitted in the data analysis.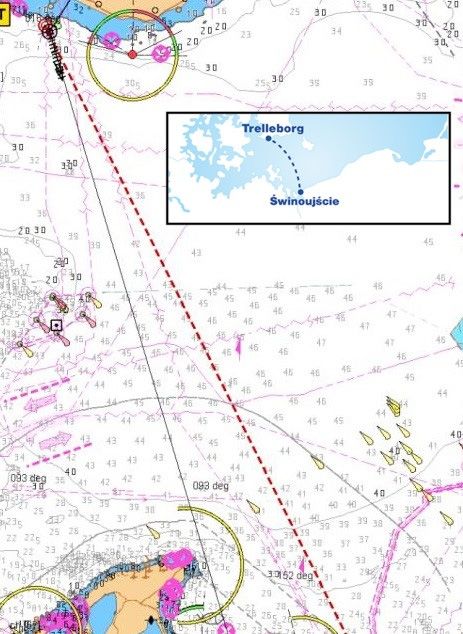
J. Mar. Sci. Eng. 2019, 7, x 3 of 14
separately for every voyage and for each set, the time (days) from the moment of applying the
anti-fouling silicone coating was also specified. Because the aim of the research is not to compare the
silicone coating to the classic anti-fouling biocide coating, the data does not include the period before
J. Mar. Sci. Eng. 2020, 8, 122 3 of 13
silicone paint was applied.
Figure 1.
Figure View of
1. View of the
the silicone
silicone coating
coating before
before high-pressure
high-pressure washing
washing with
with water
water at
at the
the shipyard
shipyard in
in
June 2019.
June 2019.
2.2. Ship’s Operational Data
The average speed (in kts) is based on the length and time of the sea passage. The average
settingOperational data were collected
for both controllable duringof
pitch propellers 6663
the round-trip voyages
ferry is specified as between
percentage two
of southern
the pitch Baltic
angle
ports: Trelleborg and Świnoujście. These so-called “sea passages” did
of the propeller blade, in the range of 0%–100%. It is worth noting that neither pitch propeller not include areas covered
by compulsory
settings are stable pilotage
duringas thespecified in thesettings
sea passage; relevant areregulations
often changed, for both
amongports. Data
other weredue
things, recorded
to the
separatelyoffor
necessity every voyage
adjusting the passageand time,
for each set, the
as stated time
in the (days) timetable.
planned from the moment
Changes of pitch applying the
settings
anti-fouling
are also forced silicone coating
by ferry wasmaneuvers,
speed also specified. Because
which maythe takeaim of the
place dueresearch is not to compare
to anti-collision actionsthein
silicone coating
accordance withtoCOLREG
the classic anti-fouling
Rules. biocide coating,
Speed adjustment is alsotherequired
data doesto not
ensureinclude
ferrythe period
safety before
in severe
silicone paint was applied.
hydrometeorological conditions.
The average length speed (in kts)“sea
of the is based on the(pilot
passages” length and time of
station–pilot the sea
station) waspassage.
88.8 Nm The average
(Figure 2).
setting for due
However, bothtocontrollable
the lack of pitch propellers
stabilizing devicesof the
andferry is specified
in order to ensureas percentage
the safety of ofpassengers
the pitch angleand
of thecargo
ro-ro propeller blade,hydrometeorological
in severe in the range of 0%–100%. conditions, It is the
worth notingroute
weather that was
neither pitch
often propeller
extended, in
settings are
extreme casesstable duringup
increasing thetosea passage;
177.7 Nm. The settings
average are specific
often changed, among other
fuel consumption things,over
(kg/Nm) duethe
to
the necessity
“sea passage" of and adjusting
the average the direction
passage time,
and windas stated
force inonthetheplanned
Beauforttimetable.
scale were the Changes of pitch
next recorded
settings
data. Windare also
dataforced by ferry speed
were determined onmaneuvers,
the basis ofwhich may take place
an anemometer dueat
located toaanti-collision
height of 47actions
m above in
accordance
sea level. This with COLREG
device Rules.
is coupled Speed
with the adjustment is also required
data of the continuous to ensure
automatic ferrywind–real
(relative safety in severe
wind)
hydrometeorological
conversion system. The conditions.
averaging of prevailing winds data was subjectively made by officers on
watch The average
based length
on their ownofnautical
the “sea passages”Figure
experience. (pilot 3station–pilot
presents the station)
frequency wasof 88.8 Nm (Figure
occurrence 2).
of three
However,
types due to the lackaccording
of weather/winds of stabilizing devices
to ferry and in order
navigator to ensure the safety of passengers and ro-ro
classification:
1. Calm
cargo in weather—1–3 Beaufort scale conditions,
severe hydrometeorological wind. It does thenot affect route
weather navigation
was oftenand does not produce
extended, in extremethe
need
cases for the reduction
increasing of propeller
up to 177.7 Nm. Thesettings
averagedue to weather.
specific fuel consumption (kg/Nm) over the “sea passage”
2.
andModerate
the average weather—4–6
direction and Beaufort scaleonwind.
wind force Its strength
the Beaufort scale can
wereaffect navigation
the next recordedanddata. mayWindrequire
data
propeller
were setting on
determined reductions
the basisdueof antoanemometer
weather conditions.
located at a height of 47 m above sea level. This device
3. Severe weather—7–10
is coupled with the data of Beaufort scale wind.
the continuous This strength
automatic (relative haswind–real
a significant
wind) impact on navigation
conversion system.
and averaging
The enforces reduction in propeller
of prevailing winds datasettings due to weather.
was subjectively madeAdditionally,
by officers onthe route
watch mayon
based betheir
changed
own
as per theexperience.
nautical captain’s instruction.
Figure 3 presents the frequency of occurrence of three types of weather/winds
according to ferry navigator classification:
1. Calm weather—1–3 Beaufort scale wind. It does not affect navigation and does not produce the
need for the reduction of propeller settings due to weather.
2. Moderate weather—4–6 Beaufort scale wind. Its strength can affect navigation and may require
propeller setting reductions due to weather conditions.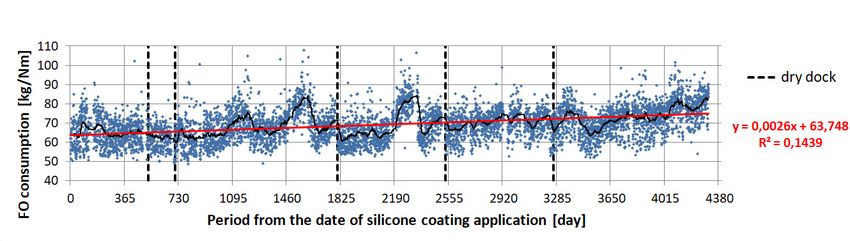
J. Mar. Sci. Eng. 2020, 8, 122                                                                       4 of 13

3.     Severe weather—7–10 Beaufort scale wind. This strength has a significant impact on navigation
       and enforces reduction in propeller settings due to weather. Additionally, the route may be
       changed as per the captain’s instruction.
J. Mar. Sci. Eng. 2019, 7, x                                                                         4 of 14

      Figure 2. The northern part of the Trelleborg (Sweden)—Świnoujście (Poland) ferry route in the
      Figure 2. The northern part of the Trelleborg (Sweden)—Świnoujście (Poland) ferry route in the
      Southern Baltic Sea.
      Southern Baltic Sea.
     The distribution of wind forces (Figure 3) is based on ferry navigator logbook notices, made only
when the ferry undertook voyages, and do not contain periods of planned breaks in ferry operation.
The distance traveled by the ferry was calculated on the basis of the DGPS-log unit. Fuel consumption
data came from flow meters accessible to mechanic officers who also receive data on the average
settings of the propellers.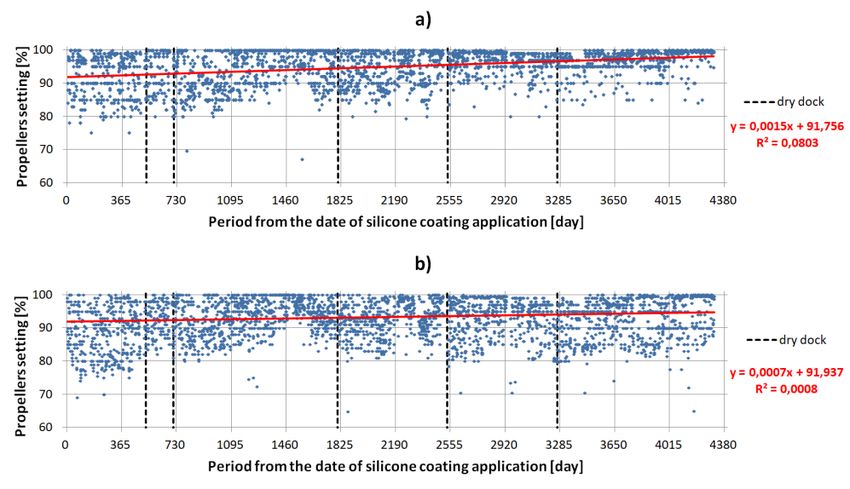
J. Mar. Sci. Eng. 2020, 8, 122                                                                                5 of 13
J. Mar. Sci. Eng. 2019, 7, x                                                                                  5 of 14

       Figure 3. Distribution (%) of the forces and directions of winds observed during the research period.

     The distribution of wind forces (Figure 3) is based on ferry navigator logbook notices, made
only when the ferry undertook voyages, and do not contain periods of planned breaks in ferry
operation. The distance traveled by the ferry was calculated on the basis of the DGPS-log unit. Fuel
consumption data came from flow meters accessible to mechanic officers who also receive data on
the average settings of the propellers.

3. Ferry Fuel
       Figure
     Figure    Consumption
                 Distribution(%)
            3.3.Distribution  (%)Analysis
                                 ofofthe
                                       theforces
                                            forcesand
                                                   anddirections
                                                       directionsofofwinds
                                                                      windsobserved
                                                                            observedduring
                                                                                     duringthe
                                                                                            theresearch
                                                                                                researchperiod.
                                                                                                         period.

 3. Ferry Fuel Consumption Analysis
3.1. General OperationalofCharacteristics
      The distribution        wind forces (Figure 3) is based on ferry navigator logbook notices, made
only  when
 3.1. On  the horizontal axis of all voyages,
      Generalthe   ferry
               Operationalundertook
                              Characteristics
                                        subsequent and   do not
                                                      figures,  thecontain
                                                                    number  periods
                                                                              of daysofwith
                                                                                         planned    breaks in of
                                                                                              the application   ferry
                                                                                                                  the
operation.
silicone    The distance
          coating   is       traveled
                       marked.    Here, by the are
                                         there ferry12was   calculated
                                                        vertical        on the
                                                                 markers,   one basis
                                                                                 for   of the
                                                                                      each     DGPS-log
                                                                                            annual        unit.
                                                                                                     period.     Fuel
                                                                                                             During
       On the horizontal axis of all subsequent figures, the number of days with the application of the
consumption
the  ship's     data came
            docking,          from flow    meters accessible    to mechanic    officers who    also
                                                                                                 Thereceive  data on
 silicone coating    is the silicone
                        marked.       coating
                                    Here, therewas
                                                arewashed     only
                                                     12 vertical    by high one
                                                                   markers,  pressure   water.
                                                                                  for each   annual   characteristics
                                                                                                      period. During
the  average
presented     settings   of the  propellers.
 the ship’s in  Figuresthe
             docking,     4, silicone
                              5, 6, andcoating
                                         7 havewas
                                                 vertical
                                                     washeddashed
                                                               onlylines   placed
                                                                     by high        for each
                                                                               pressure  water.of the
                                                                                                  Thefive  dry dock
                                                                                                       characteristics
cleanings.
 presentedAll    diagrams
             in Figures     4–7include   operational
                                 have vertical  dashed data   as placed
                                                          lines   a function  of the
                                                                         for each      number
                                                                                   of the         of days
                                                                                           five dry   dock since  the
                                                                                                           cleanings.
3. Ferry
silicone Fuel  Consumption
         coatinginclude
                   was applied.   Analysis
 All diagrams               operational data as a function of the number of days since the silicone coating
 was   applied.
3.1. General Operational Characteristics
      On the horizontal axis of all subsequent figures, the number of days with the application of the
silicone coating is marked. Here, there are 12 vertical markers, one for each annual period. During
the ship's docking, the silicone coating was washed only by high pressure water. The characteristics
presented in Figures 4, 5, 6, and 7 have vertical dashed lines placed for each of the five dry dock
cleanings. All diagrams include operational data as a function of the number of days since the
silicone coating was applied.

       Figure 4. Main engine average fuel consumption for the whole period of study on the route
      Figure 4. Main engine average fuel consumption for the whole period of study on the route
       Świnoujście/Trelleborg—both directions.
      Świnoujście/Trelleborg—both directions.
       Figure 4 presents a diagram of average fuel consumption for both directions of voyages. In this
     Figure 4 presents a diagram of average fuel consumption for both directions of voyages. In this
 diagram, fuel consumption fluctuations during each annual period are presented. These fluctuations
diagram, fuel consumption fluctuations during each annual period are presented. These fluctuations
 significantly hinder the selection of the curve for modeling fuel consumption. Nevertheless, the curve
significantly hinder the selection of the curve for modeling fuel consumption. Nevertheless, the
 shows a fairly clear growing tendency of increased fuel consumption over the period studied as
curve shows a fairly clear growing tendency of increased fuel consumption over the period studied
 well as the minimal influence of dry dock cleaning. For the above reasons, it was decided to use
as well as the minimal influence of dry dock cleaning. For the above reasons, it was decided to use
 the simplest possible characteristic—the linear data, based on which an increased consumption from
the simplest
     Figure     possible characteristic—the  linear data, based
                                                          for theonwhole
                                                                    whichperiod
                                                                           an increased
                                                                                     studyconsumption   from
 about   63.8 4.kg/Nm
                  Main to
                       engine averagewas
                          75 kg/Nm     fuelobserved.
                                            consumption
                                                      Calculation   of daily fuelofconsumption
                                                                                           on theon
                                                                                                  route
                                                                                                    the ferry
aboutŚwinoujście/Trelleborg—both
        63.8 kg/Nm to 75 kg/Nmdirections.
                                     was observed. Calculation of daily fuel consumption on the ferry
 route round-trip shows additional     increased daily consumption for the average length of a round-trip
 (11.2 kg/Nm × 2 × 88.8 Nm) 1989 kg.
     Figure 4 presents a diagram of average fuel consumption for both directions of voyages. In this
       The timetables are not symmetrical in both directions, and therefore, the passage times are different
diagram, fuel consumption fluctuations during each annual period are presented. These fluctuations
 for the journey to Świnoujście and to Trelleborg. In addition, the fuel consumption distribution was
significantly hinder the selection of the curve for modeling fuel consumption. Nevertheless, the
 subject to multiple timetable adjustments over a period of almost 13 years. Reduction in the passage
curve shows a fairly clear growing tendency of increased fuel consumption over the period studied
 time entails increasing of speed, which, in turn, implies increasing of fuel consumption. Among other
as well as the minimal influence of dry dock cleaning. For the above reasons, it was decided to use
 things, further analysis is required to eliminate factors interfering with the relationship presented in
the simplest possible characteristic—the linear data, based on which an increased consumption from
 Figure 4.
about 63.8 kg/Nm to 75 kg/Nm was observed. Calculation of daily fuel consumption on the ferry
different for the journey to Świnoujście and to Trelleborg. In addition, the fuel consumption
distribution was subject to multiple timetable adjustments over a period of almost 13 years.
Reduction in the passage time entails increasing of speed, which, in turn, implies increasing of fuel
consumption. Among other things, further analysis is required to eliminate factors interfering with
the relationship
J. Mar. presented
Sci. Eng. 2020, 8, 122 in Figure 4. 6 of 13
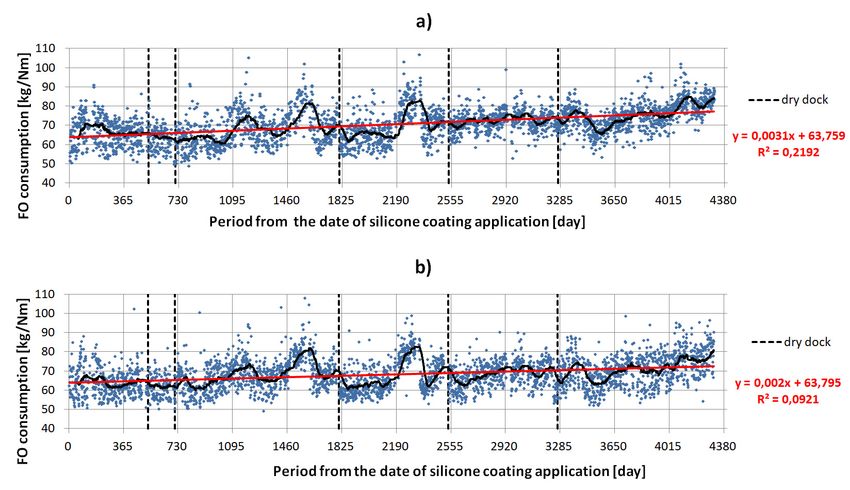
Figure 5. Average variable pitch propeller settings for the entire period of study on the
Figure 5. Average variable
Świnoujście/Trelleborg pitch propeller
route—divided into twosettings
voyagefor the entire
directions. period
Ferry of for
bound study on the
Świnoujście
Świnoujście/Trelleborg route—divided into two voyage directions. Ferry bound for Świnoujście (a)
(a) and for Trelleborg (b).
and for Trelleborg (b).
On the route to Świnoujście, the variable pitch propeller setting changed from 91.7% to 98.2%
On the
(absolute route of
increase to 7.0
Świnoujście, the to
percent), and variable pitchthe
Trelleborg, propeller setting changed
setting changed from
from 91.9% to 91.7% to 98.2%
95.0% (absolute
J.(absolute
increase ofincrease
Mar. Sci. Eng. 2019, 7, xof 7.0The
3.3 percent). percent), and to Trelleborg,
above situation is presentedthe setting5. changed from 91.9% to 95.0%
in Figure 7 of 14
(absolute increase of 3.3 percent). The above situation is presented in Figure 5.
Averagespeed
Figure6.6.Average
Figure speedfor
forthe
theentire
entireperiod
periodofofstudy
studyon
onthe
theroute
routeŚwinoujście/Trelleborg—divided
Świnoujście/Trelleborg—divided
intotwo
into twovoyage
voyagedirections.
directions.Ferry
Ferrybound
boundforforŚwinoujście
Świnoujście(a)
(a)and
andfor
forTrelleborg
Trelleborg (b).
(b).
Asshown
As shownin inFigure
Figure6,6,changes
changestotothe
theaverage
averagespeed
speedofofthe
theferry
ferryto
toŚwinoujście
Świnoujściefrom
from13.76
13.76kts
ktstoto
14.62 kts
14.62 kts (increase
(increaseofof6.4%)
6.4%)occurred andand
occurred on the
on road to Trelleborg,
the road from 13.79
to Trelleborg, fromkts to 13.96
13.79 kts13.96
kts to (increase
kts
of 1.2%). The above increases in average speed needed to be accompanied by an increase
(increase of 1.2%). The above increases in average speed needed to be accompanied by an increase to the setting
to
of the variable pitch propeller (Figure 5).
the setting of the variable pitch propeller (Figure 5).into two voyage directions. Ferry bound for Świnoujście (a) and for Trelleborg (b).
As shown in Figure 6, changes to the average speed of the ferry to Świnoujście from 13.76 kts to
14.62 kts (increase of 6.4%) occurred and on the road to Trelleborg, from 13.79 kts to 13.96 kts
(increase of 1.2%). The above increases in average speed needed to be accompanied by an increase to
J. Mar. Sci. Eng. 2020, 8, 122 7 of 13
the setting of the variable pitch propeller (Figure 5).
Figure 7. Main engine average fuel consumption for the entire period of study on the Świnoujście/Trelleborg
Figure 7. Main engine average fuel consumption for the entire period of study on the
route—divided into two voyage directions. Ferry bound for Świnoujście (a) and for Trelleborg (b).
Świnoujście/Trelleborg route—divided into two voyage directions. Ferry bound for Świnoujście (a)
and for Trelleborg (b).
Figure 7 shows fuel consumption characteristics separated for both directions traveled by
the ferry. While the fuel consumption on the route to Trelleborg increased in the period under
Figure 7 shows fuel consumption characteristics separated for both directions traveled by the
consideration by 8.6 kg/Nm, on the route to Świnoujście, this increase was higher, reaching 13.4 kg/Nm.
ferry. While the fuel consumption on the route to Trelleborg increased in the period under
This demonstrates a systematic shortening of the passage time as a result of timetable changes. At the
consideration by 8.6 kg/Nm, on the route to Świnoujście, this increase was higher, reaching 13.4
same time, the phenomenon of passage shortening can be seen much more clearly in the direction of
kg/Nm. This demonstrates a systematic shortening of the passage time as a result of timetable
Świnoujście. Confirmation of this is shown in Figure 6.
3.2. Detailed Analysis of Fuel Consumption
The general relationship of the ship’s propulsion fuel consumption without the influence of
additional factors, such as shallow water or wind, etc., can be represented as [4]:
Cons = k × V n
where Cons is fuel consumption per unit of time, k is an individual factor, depending on the ship’s
characteristics and type of propulsion, V is the ship’s instantaneous speed, n is an exponent within a
value of 3 to 4.
Speed and fuel consumption are related in theory by the given equation; however, using the
average speed and average fuel consumption rather than the moment-by-moment values makes the
equation inadequate because the speed will vary during the passage, and the type of variation depends
on the weather as well as the need to keep to timetabled arrival and departure times. This is most clearly
demonstrated by the situation on the passage to Trelleborg where, based on an approximation of the
consumption characteristic (Panel (b) on Figures 5 and 6), a 13% increase of specific fuel consumption
caused, in practice, only a barely noticeable increase of the average speed of 0.17 kts. Therefore, it seems
likely that during the tests, there are different impacts on fuel consumption than from an increase
of the variable pitch propeller settings and so, further attempts were made to find an answer to this
question by, firstly, taking into consideration the impact of hydrometeorological conditions on fuel
consumption over time since the application of the silicone anti-fouling coating.
Figures 8–11 show four cases of the ferry’s movement direction relative to the wave pattern. Three
types of weather signaled previously (1–3, 4–6, 7–10 Beaufort scale) have been included:
(1) With the wind and wave—Figure 8.
(2) Against the wind and the wave—Figure 9.anti-fouling coating.
hydrometeorological conditions on fuel consumption over time since the application of the silicone
Figures 8, 9, 10, and 11 show four cases of the ferry's movement direction relative to the wave
anti-fouling coating.
pattern. Three types of weather signaled previously (1–3, 4–6, 7–10 Beaufort scale) have been
Figures 8, 9, 10, and 11 show four cases of the ferry's movement direction relative to the wave
included:
pattern. Three types of weather signaled previously (1–3, 4–6, 7–10 Beaufort scale) have been
1) With the wind and wave—Figure 8.
included:
J. Mar. Sci. Eng. 2020, 8, 122 8 of 13
2) Against the wind and the wave—Figure 9.
1) With the wind and wave—Figure 8.
3) Crosswind and large waves from the side—Figure 10.
2) Against the wind and the wave—Figure 9.
4) Crosswind
(3) Crosswind
Crosswind and
and small waves
large wavesfrom
from the
the side—Figure 11.
side—Figure10.
10.
3) and large waves from the side—Figure
(4) Crosswind
4) Crosswind and
and small
small waves
waves fromfrom the
the side—Figure11.
side—Figure 11.
Figure 8. Average fuel consumption—sailing with the wind and wave. Ferry bound for Świnoujście,
winds
FigureNW/NNW/N (a) consumption—sailing
8. Average fuel and for Trelleborg, winds
withSE/SSE/S
the wind(b).
and wave. Ferry bound for Świnoujście,
Figure 8. Average fuel consumption—sailing with the wind and wave. Ferry bound for Świnoujście,
winds NW/NNW/N (a) and for Trelleborg, winds SE/SSE/S (b).
winds NW/NNW/N (a) and for Trelleborg, winds SE/SSE/S (b).
J. Mar. Sci. Eng. 2019, 7, x 9 of 14
J. Mar. Figure Average
Sci. Eng.9.2019, 7, x fuel consumption—sailing against the wind and the wave. Ferry bound for9 of 14
Figure 9. Average fuel consumption—sailing against the wind and the wave. Ferry bound for
Świnoujście, winds SE/SSE/S (a) and for Trelleborg, winds NW/NNW/N (b).
Świnoujście, winds SE/SSE/S (a) and for Trelleborg, winds NW/NNW/N (b).
Figure 9. Average fuel consumption—sailing against the wind and the wave. Ferry bound for
Świnoujście, winds SE/SSE/S (a) and for Trelleborg, winds NW/NNW/N (b).
Figure 10. Average fuel consumption—sailing crosswind and large waves from the side. Ferry
Average fuelwinds
Figure 10.Świnoujście,
bound consumption—sailing crosswind and large waves from the(b).
side. Ferry bound
Figure for
10. Average fuel NE/ENE/E (a) and
consumption—sailing for Trelleborg,
crosswind andwinds
largeNE/ENE/E
waves from the side. Ferry
for Świnoujście, winds NE/ENE/E (a) and for Trelleborg, winds NE/ENE/E (b).
bound for Świnoujście, winds NE/ENE/E (a) and for Trelleborg, winds NE/ENE/E (b).
Figure 11.
Figure Average fuel
11. Average fuelconsumption—sailing
consumption—sailingcrosswind
crosswind andand
small waves
small fromfrom
waves the side.
the Ferry
side. bound
Ferry
for Świnoujście, winds W/WSW/SW (a) and for Trelleborg, winds W/WSW/SW (b).
bound
Figure for
11.Świnoujście,
Average fuelwinds W/WSW/SW (a) and
consumption—sailing for Trelleborg,
crosswind windswaves
and small W/WSW/SW
from the(b).side. Ferry
bound
Figures for12Świnoujście, winds W/WSW/SW
and 13 introduce (a) andfor
selected options formore
Trelleborg, winds
detailed W/WSW/SW
weather (b). as presented
conditions,
Figures 12 and 13 introduce selected options for more detailed weather conditions, as presented
on previous graphs (Figures 8–11). The primary measure of choice was to analyze conditions for
on previous
Figures graphs
12 and 13 (Figures
introduce8–11). The primary
selected measure
options for of choice
more detailed was toconditions,
weather analyze conditions for
as presented
which the above relationship was the least visible. These conditions were met for navigation in
which the above
on previous relationship
graphs (Figures was theThe
8–11). leastprimary
visible. measure
These conditions
of choicewere
wasmet for navigation
to analyze in both
conditions for
both directions during relatively low wave action, for winds W/WSW/SW (Figure 12). Taking the
directions during relatively low wave action, for winds W/WSW/SW (Figure 12).
which the above relationship was the least visible. These conditions were met for navigation in both Taking the above
above data into consideration ensured a sufficiently large number of records for subsequent analysis.
data into consideration
directions during relatively ensured
low awave
sufficiently
action, large number
for winds of records(Figure
W/WSW/SW for subsequent analysis.
12). Taking The
the above
The afore-mentioned wind directions occurred most often among the observed weather conditions
afore-mentioned wind directions occurred most often among the observed weather
data into consideration ensured a sufficiently large number of records for subsequent analysis. The conditions
(Figure 3), thus, further ensuring the largest possible amount of data for analysis. The following groups
(Figure 3), thus, further
afore-mentioned ensuring the
wind directions largestmost
occurred possible amount
often amongofthe data for analysis.
observed The conditions
weather following
of variable pitch propeller settings were considered:
groups
(Figureof 3),variable pitch propeller
thus, further ensuringsettings werepossible
the largest considered:
amount of data for analysis. The following
97% -100%
97%–100%
groups - full sea
- fullpitch
of variable speed,
sea speed, maximum
maximum
propeller engine power;
settings were considered:
94%
97% -96%
-100% - full- sea
high power
speed, of engines;
maximum engine power;
85%
94% -93%
-96% -- reduced
high power power of engines;
of engines;
75%
85% -84%
-93% -- slowing
reduceddownpowertheof engines
engines;below the required operating speed.
75% -84% - slowing down the engines below the required operating speed.which the above relationship was the least visible. These conditions were met for navigation in both
directions during relatively low wave action, for winds W/WSW/SW (Figure 12). Taking the above
data into consideration ensured a sufficiently large number of records for subsequent analysis. The
afore-mentioned wind directions occurred most often among the observed weather conditions
(Figure 3),Eng.
J. Mar. Sci. thus,
2020,further
8, 122 ensuring the largest possible amount of data for analysis. The following
9 of 13
groups of variable pitch propeller settings were considered:
97% -100% - full sea speed, maximum engine power;
94%–96% - high power of engines;
94% -96% - high power of engines;
85%–93%
85% -93% - reduced power
- reduced of engines;
power of engines;
75%–84%
75% -84% - slowing
- slowing downengines
down the below
the engines the required
below operating
the required speed.
operating speed.
J. Mar. Sci. Eng. 2019, 7, x 10 of 14
Figure 12. Average fuel consumption, sailing crosswind, small waves from the side, variable pitch
Figure 12.
propeller Average
settings. fuelbound
Ferry consumption, sailing crosswind,
for Świnoujście, small waves
winds W/WSW/SW, from
force: the(a),
1-3 B. side,
4-6variable pitch
B. (c), 7-10 B.
propeller settings. Ferry bound for Świnoujście, winds W/WSW/SW, force: 1–3 B.
(e), and for Trelleborg, winds W/WSW/SW, force: 1-3 B. (b), 4-6 B. (d), 7-10 B. (f). (a), 4–6 B. (c), 7–10 B.
(e), and for Trelleborg, winds W/WSW/SW, force: 1–3 B. (b), 4–6 B. (d), 7–10 B. (f).
Figure 13. Average fuel consumption, sailing against the wind/wave, variable pitch propeller settings.
Figure 13. Average fuel consumption, sailing against the wind/wave, variable pitch propeller
Ferry bound for Świnoujście, winds SE/SSE/S, force: 1–3 B. (a), 4–6 B. (c), 7–10 B. (e) and for Trelleborg,
settings. Ferry bound for Świnoujście, winds SE/SSE/S, force: 1-3 B. (a), 4-6 B. (c), 7-10 B. (e) and for
winds NW/NNW/N, force: 1–3 B. (b), 4–6 B. (d), 7–10 B. (f).
Trelleborg, winds NW/NNW/N, force: 1-3 B. (b), 4-6 B. (d), 7-10 B. (f).
Despite the maximum sample size, due to the lack of data, 75%–84% of settings were not
obtained for the very tight timetable trip to Trelleborg (Figure 12). This fact does not change the
conclusion that real operational tests fully confirm the dependence of the specific fuel consumption
on the time period of the silicone coating application.
Figure 13 illustrates the most adverse weather conditions when the ship sails against the windJ. Mar. Sci. Eng. 2020, 8, 122 10 of 13
Despite the maximum sample size, due to the lack of data, 75%–84% of settings were not obtained
for the very tight timetable trip to Trelleborg (Figure 12). This fact does not change the conclusion that
real operational tests fully confirm the dependence of the specific fuel consumption on the time period
of the silicone coating application.
Figure 13 illustrates the most adverse weather conditions when the ship sails against the wind
and waves. With one exception (small amount of data, voyage to Trelleborg, wind NW/NNW/N with
a force of 4–6 Beaufort scale, average pitch propeller setting 94%–96%), the diagram confirms the
relationship between the fuel consumption and the time from the moment of applying the anti-fouling
silicone coating. For severe weather, winds NW/NNW/N 7–10 Beaufort scale, it can be seen that the
fuel consumption for smaller settings of the variable pitch propellers is greater than for large settings.
This apparent inconsistency results from the fact that, for these very heavy conditions, the ferry
tries lower propeller settings (average pitch angle 94%–96%) but with a continuous very high engine
load in order to continue the voyage directly on the shortest route, against the wind and waves.
However, if due to safety reasons this is not possible, the ship undertakes frequent course changes to
avoid wave impacts directly into the bow [11]. In such a situation, the average propeller settings will
rise (pitch angle 97%–100%) because there are no extreme opposing forces and a lower-than-before
average engine load is possible.
3.3. Multiple Linear Regression Analysis of Fuel Consumption
Multiple linear regression was used for the next data analysis. Through the previously proposed
data selection, different weather and operating conditions have been identified for the ferry passages.
Four selected analyses were then carried out for the same data, as shown in the diagrams in Figures 12
and 13, and the following circumstances were distinguished: the ferry is sailing against the wind and
against the waves, the ferry is sailing crosswind and across the waves. The impact of time pressure
resulting from the ferry timetable differences was also taken into account by analyzing data taken
from voyages in two directions: Świnoujście-Trelleborg and Trelleborg-Świnoujście. The following five
independent variables were used to explain the amount of the ferry’s consumption: ferry speed raised
to the second power (speed2 ), time/days elapsed since the silicone anti-fouling coating was applied
(time), the Beaufort scale force of the wind (wind B), the length of the ferry journey (distance), and the
average setting of the variable pitch propellers (propellers). The fuel consumption is known to be related
to speed raised to a power rather than to speed alone, which is then checked to ensure that the model
fits better with speed raised to the second power.
For all variables in the above four cases, the probability p-value is lower than the assumed level of
statistical significance. Therefore, the hypothesis that the proposed variables do not affect the analyzed
specific fuel consumption can be rejected.
Therefore, the hypothesis that the proposed variables do not affect the analyzed specific fuel
consumption can be rejected. The above-mentioned variables at the adopted confidence level (95%)
explain from 54% to 63% of the analyzed data. Not taking into account the variable associated with
time elapsed since the silicone anti-fouling coating was applied (time), meant that the four remaining
variables were only able to explain 48% to 59% of the analyzed data.
The results presented in Table 1 for variables speed and distance require additional explanation.
In two cases, the model coefficient b has a negative value, despite that the impact of these variables
on the model’s accuracy cannot be excluded. This phenomenon is observed due to the correlation
between the variable representing the propellers’ settings and the variable representing the speed of the
ship. A similar correlation occurs between the variable distance and variable wind B, which represents
weather conditions. In this case, to minimize the negative impact of the weather on the ship’s safe
passage, it is necessary to change the ferry course, and thus, the voyage distance is extended.J. Mar. Sci. Eng. 2020, 8, 122 11 of 13
Table 1. Multiple linear regression statistics for the selected data: specific fuel consumption versus
variables time, speed2 , distance, propellers, and wind B.
Sailing Against the Wind/Wave To: Sailing Crosswind To:
Fuel Consumption
Świnoujście, Trelleborg, Winds Świnoujście, Winds Trelleborg, Winds
Model
Winds SE/SSE/S NW/NNW/N W/WSW/SW W/WSW/SW
[kg/Nm]
Multiple R 0.7550 0.7972 0.7372 0.7660
R2 0.5700 0.6355 0.5434 0.5868
Adjusted R2 0.5656 0.6315 0.5412 0.5852
Standard Error 5.4374 5.0543 5.3448 5.1345
Observations 506 466 1214 1338
Coefficient b (time) 0.00194 0.00136 0.00167 0.00116
Coefficient b (speed2 ) −0.0554 −0.0414 −0.0431 −0.0546
Coefficient b (distance) −0.5111 −0.6037 −0.4180 −0.3322
Coefficient b (propellers) 1.0310 0.9056 0.9445 0.9272
Coefficient b (wind B) 1.6658 1.9093 1.0967 1.4240
On the basis of the above-presented reasoning, Table 2 has been made to show multiple regression
with the exception of variables speed and distance. In this case, the variables time, propellers, and wind
B at the adopted confidence level (95%) explain from 54% to 61% of the analyzed data. In this case,
similarly to Table 1, by excluding the variable associated with the time degradation of the quality of the
silicone anti-fouling coating, only 47% to 57% of the analyzed data can be explained. The reasoning
presented above allows again to state that there is a significant impact of the passing time on the fuel
consumption due to the degradation of the silicone coating since its application.
Table 2. Multiple linear regression statistics for the selected data: specific fuel consumption versus
variables time, propellers, and wind B.
Sailing Against the Wind/Wave To: Sailing Crosswind To:
Ferry Fuel
Świnoujście, Trelleborg, Winds Świnoujście, Winds Trelleborg, Winds
Consumption Model
Winds SE/SSE/S NW/NNW/N W/WSW/SW W/WSW/SW
[kg/Nm]
Multiple R 0.7336 0.7819 0.7213 0.7521
R2 0.5381 0.6114 0.5203 0.5657
Adjusted R2 0.5353 0.6088 0.5191 0.5647
Standard Error 5.6238 5.2076 5.4742 5.2601
Observations 506 466 1214 1338
Coefficient b (time) 0.00183 0.00135 0.00156 0.00117
Coefficient b (propellers) 0.8630 0.8032 0.7947 0.9272
Coefficient b (wind B) 1.9998 2.0988 1.3376 1.4240
4. Discussion
The characteristics presented on the graphs in Sections 3.1 and 3.2 validate the relationship
between the increase of fuel consumption and the time that has elapsed since the application of the
silicone anti-fouling coating. From the point of view of formal statistical analysis, the presented
single characteristics do not justify the statement that the available data are accurately matched to the
presented regression equations, because the values of the determination coefficients R2 are relatively
low [12]. However, the multiple linear regressions presented in Section 3.3 justify the impact on average
fuel consumption of the time elapsed since the silicone anti-fouling coating was applied. The singleJ. Mar. Sci. Eng. 2020, 8, 122 12 of 13
linear equations may only lead to an approximate determination of the amount of average increase of
fuel consumption. Equations and multiple linear regressions are disrupted by such factors as:
• Variable hydrometeorological conditions may have changed during the passage,
• Possible errors of the subjective hydrometeorological conditions assessment,
• Large approximation in hydrometeorological data grouping—three groups of wind strength only,
• Large approximation in grouping of variable pitch propeller settings data—four groups of settings,
• Speed changes,
• Different speeds and courses at any stage of the voyage resulting from COLREG,
• Changes of the average speed as a result of ferry timetable adjustments,
• Due to the varying intensity of the shallow water effect resulting from route changes all over the
Trelleborg/Świnoujście area,
• Fluctuations in propulsion efficiency associated with periodic repairs of main engines,
• Differences of fuel quality, especially due to new Sulphur Control Emission Control Areas
implemented during the research period.
The subsequent graphs allow more objective and precise validation of the tendency to increase
specific fuel consumption, as shown in Figures 3–13. The same tendency can be observed in both
voyage directions. The following parameters have been taken into account: variable pitch propeller
settings and hydrometeorological conditions. The above graphs confirm that the average increase of
estimated fuel consumption of abt. 2 tons (abt. 17 percent) per day was observed after nearly 13 years
since the silicone anti-fouling paint was applied. This tendency is confirmed in other research [13–15].
With the help of the proposed characteristics and multiple regression analysis eliminating the
impact of increases of ferry speed, it is also possible to estimate the financial loss resulting from
increased fuel consumption due to degradation of the anti-fouling coating, as presented in the paper.
In this case, fuel consumption monitoring is accessible not only for researches but also for the owner’s
office staff with a knowledge of standard office software packages. It is also more likely to be able to
choose the most appropriate moment for and scope of repair works regarding the underwater section
of the hull. Finally, continuous control over the increase of the ferry’s fuel consumption allows for
decision-making in the context of minimizing exhaust fume emissions.
Moreover, the described approximate technique allows for estimating the tendency and the value
of the average specific fuel consumption after each change of ferry operating conditions. This may
happen after applying new anti-fouling layering, main engine repair or adjustment, hull cleaning or
adjusting the timetable for passage time.
Funding: This research outcome has been achieved under research project No. 1/S/CIRM/16 financed with a
subsidy from the Ministry of Science and Higher Education for statutory activities of the Maritime University
of Szczecin.
Conflicts of Interest: The author declares no conflict of interest.
References
1. Bochetti, D.; Lapore, A.; Palumbo, B.; Vitiello, L. Statistical approach to ship fuel consumption monitoring.
J. Ship Res. 2015, 59, 162–171. [CrossRef]
2. Barras, B. Ship Design and Performance for Masters and Mates; Elsevier: Oxford, UK, 2004.
3. Alderton, P.M. The optimum speed of ship. J. Navig. 1981, 34, 341–355. [CrossRef]
4. Wang, S.; Meng, Q. Sailing speed optimization for container ships in a liner shipping network. Transp. Res.
2012, 48, 701–714. [CrossRef]
5. Carlton, J. Marine Propellers and Propulsion, 2nd ed.; Elsevier: Oxford, UK, 2007.
6. Molland, A.F.; Turnock, S.R.; Hudson, D.A. Ship Resistance and Propulsion, Practical Estimation of Propulsive
Power; Cambridge University Press: New York, NY, USA, 2011.
7. Kowalski, A. Optymalizacja kosztów paliwa statku w czasie podróży morskiej. Autobusy 2013, 3, 575–582.J. Mar. Sci. Eng. 2020, 8, 122 13 of 13
8. Kowalski, A. Wybrane Aspekty Eksploatacji Statku Handlowego—Poradnik Kapitana Statku; Fundacja Promocji
Przemysłu Okr˛etowego i Gospodarki Morskiej: Gdańsk, Poland, 2017.
9. Dzwonkowski, J.; Gucma, M.; Gucma, S.; Kowalski, A. Nawigacja pilotażowa: Nawigacja na akwenach
ograniczonych; Wydawnictwo Naukowe Akademii Morskiej w Szczecinie: Szczecin, Poland, 2019.
10. Bialystocki, N.; Konovessis, D. On the estimation of ship’s fuel consumption and speed curve: A statistical
approach. J. Ocean Eng. Sci. 2016, 1, 157–166. [CrossRef]
11. Nowicki, A. Manewrowanie w Warunkach Specjalnych; Oderratum Ltd.: Szczecin, Poland, 1999.
12. Larose, D.L. Metody i Modele Eksploracji Danych; Wydawnictwo Naukowe PWN: Warszawa, Poland, 2008.
13. Sonak, S.; Giriyan, A.; Pangam, P. A method for analysis of costs and benefits of anti-fouling systems applied
to a ship’s hull. J. Ship Technol. 2010, 6, 73–83.
14. Westergaard, C. Comparison of fouling control coating performance to ship propulsion efficiency. In FORCE
Technology; Report no. 107-24111, Part 2; Hempel Marine Paints A/S: Brøndby, Denmark, 2007.
15. Munk, T.; Kane, D.; Yebra, D.M. The effects of corrosion and fouling on the performance of ocean-going
vessels: A naval architectural perspective. In Advances in Marine Anti-Fouling Coatings and Technologies;
Woodhead Publishing: Cambridge, UK, 2009; pp. 148–176.
© 2020 by the author. Licensee MDPI, Basel, Switzerland. This article is an open access
article distributed under the terms and conditions of the Creative Commons Attribution
(CC BY) license (http://creativecommons.org/licenses/by/4.0/).You can also read