CLIMATE DIAGNOSTICS BULLETIN - MARCH 2021
←
→
Page content transcription
If your browser does not render page correctly, please read the page content below

CLIMATE
       DIAGNOSTICS
         BULLETIN

         MARCH 2021
NEAR REAL-TIME OCEAN / ATMOSPHERE
  Monitoring, Assessments, and Prediction

        U.S. DEPARTMENT OF COMMERCE
   National Oceanic and Atmospheric Administration
               National Weather Service
    National Centers for Environmental Prediction

                          1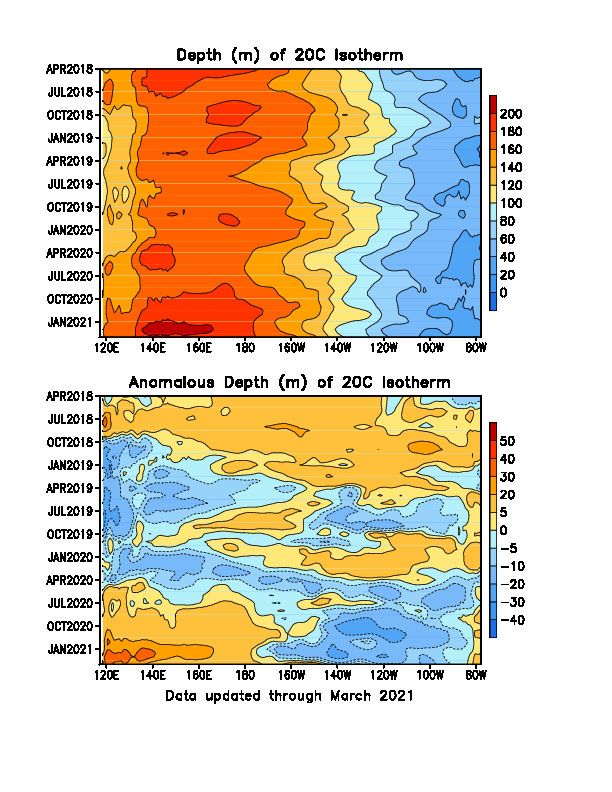
CLIMATE DIAGNOSTICS BULLETIN

                     CLIMATE PREDICTION CENTER
                       Attn: Climate Diagnostics Bulletin
                        Room 3116, NCWCP
                        5830 University Research Court
                        College Park, MD 20740

   Chief Editor: Wei Shi
   Editors: Michelle L’Heureux and Emerson LaJoie
   Bulletin Production: Wei Shi

   ExternalCollaborators:
      Center for Ocean-Atmospheric Prediction Studies (COAPS)
      Cooperative Institute for Research in the Atmosphere (CIRA)
      Earth & Space Research
      International Research Institute for Climate and Society (IRI)
      Joint Institute for the Study of the Atmosphere and Ocean (JISAO)
      Lamont-Doherty Earth Observatory (LDEO)
      NOAA-CIRES, Climate Diagnostics Center
      NOAA-AOML, Atlantic Oceanographic and Meteorological Laboratory
      NOAA-NESDIS-STAR, Center for Satellite Applications and Research
       NOAA-NDBC, National Data Buoy Center
      Scripps Institution of Oceanography

   Software: Most of the bulletin figures generated at CPC are created using the Grid Analysis
and Display System (GrADS).

                                           2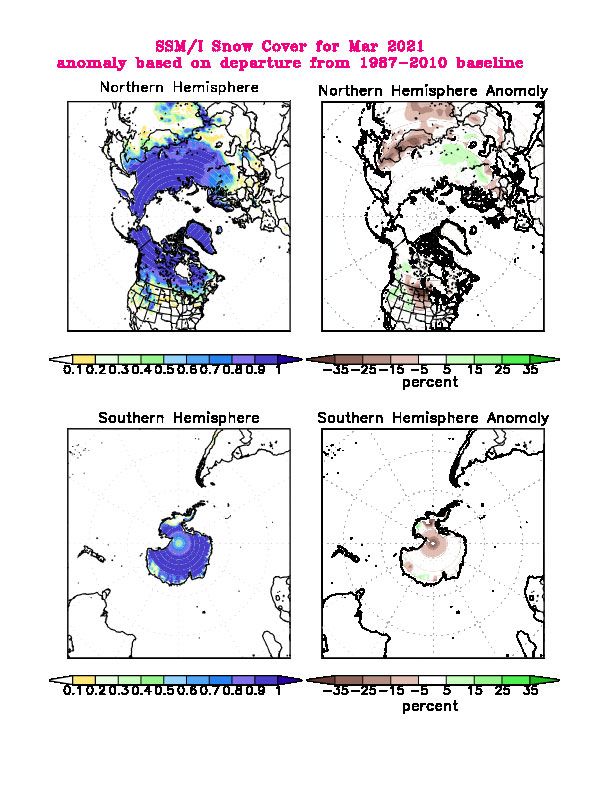
- Climate Diagnostics Bulletin available on the World Wide Web

The CDB is available on the World Wide Web. The address of the online version of the CDB is:

http://www.cpc.ncep.noaa.gov/products/CDB

If you have any problems accessing the bulletin, contact Dr. Wei Shi by E-mail:

                                    Wei.Shi@noaa.gov

                                            3
Table of Contents
TROPICS
    Highlights . . . . . . . . . . page 6
    Table of Atmospheric Indices . . . . . . . . . page 7
    Table of Oceanic Indices . . . . . . . . . page 8
                                                                   FIGURE
           Time Series
                  Southern Oscillation Index (SOI)                 T1
                  Tahiti and Darwin SLP Anomalies                  T1
                  OLR Anomalies                                    T1
                  CDAS/Reanalysis SOI & Equatorial SOI             T2
                  200-hPa Zonal Wind Anomalies                     T3
                  500-hPa Temperature Anomalies                    T3
                  30-hPa and 50-hPa Zonal Wind Anomalies           T3
                  850-hPa Zonal Wind Anomalies                     T4
                  Equatorial Pacific SST Anomalies                 T5
           Time-Longitude Sections
                  Mean and Anomalous Sea Level Pressure            T6
                  Mean and Anomalous 850-hPa Zonal Wind            T7
                  Mean and Anomalous OLR                           T8
                  Mean and Anomalous SST                           T9
                  Pentad SLP Anomalies                             T10
                  Pentad OLR Anomalies                             T11
                  Pentad 200-hPa Velocity Potential Anomalies      T12
                  Pentad 850-hPa Zonal Wind Anomalies              T13
                  Anomalous Equatorial Zonal Wind                  T14
                  Mean and Anomalous Depth of the 20°C Isotherm    T15
           Mean & Anomaly Fields
                  Depth of the 20°C Isotherm                       T16
                  Subsurface Equatorial Pacific Temperatures       T17
                  SST                                              T18
                  SLP                                              T19
                  850-hPa Vector Wind                              T20
                  200-hPa Vector Wind                              T21
                  200-hPa Streamfunction                           T22
                  200-hPa Divergence                               T23
                  200-hPa Velocity Potential and Divergent Wind    T24
                  OLR                                              T25
                  SSM/I Tropical Precipitation Estimates           T26
                  Cloud Liquid Water                               T27
                  Precipitable Water                               T28
                  Divergence & E-W Divergent Circulation           T29 - T30
                  Pacific Zonal Wind & N-S Divergent Circulation   T31 - T32

           Appendix 1: Outside Contributions
                  Tropical Drifting Buoys                          A1.1

                                            4
FIGURE
                    Pacific Wind Stress and Anomalies                     A1.2
                    Satellite-Derived Surface Currents                    A1.3 - A1.4
FORECAST FORUM
    Discussion . . . . . . . . . . page 45
                    Canonical Correlation Analysis Forecasts              F1 - F2
                    NCEP Coupled Model Forecasts                          F3 - F4
                    NCEP Markov Model Forecasts                           F5 - F6
                    LDEO Model Forecasts                                  F7 - F8
                    ENSO-CLIPER Model Forecast                            F9
                    Model Forecasts of Niño 3.4                           F10

EXTRATROPICS
    Highlights . . . . . . . . . . page 57
    Table of Teleconnection Indices . . . . . . . . . . page 59
                    Global Surface Temperature                            E1
                    Temperature Anomalies (Land Only)                     E2
                    Global Precipitation                                  E3
                    Regional Precipitation Estimates                      E4 - E5
                    U. S. Precipitation                                   E6
            Northern Hemisphere
                    Teleconnection Indices                                E7
                    Mean and Anomalous SLP                                          E8
                    Mean and Anomalous 500-hPa heights                    E9
                    Mean and Anomalous 300-hPa Wind Vectors               E10
                    500-hPa Persistence                                   E11
                    Time-Longitude Sections of 500-hPa Height Anomalies   E12
                    700-hPa Storm Track                                   E13
            Southern Hemisphere
                    Mean and Anomalous SLP                                          E14
                    Mean and Anomalous 500-hPa heights                    E15
                    Mean and Anomalous 300-hPa Wind Vectors               E16
                    500-hPa Persistence                                   E17
                    Time-Longitude Sections of 500-hPa Height Anomalies   E18
            Stratosphere
                    Height Anomalies                                      S1 - S2
                    Temperatures                                          S3 - S4
                    Ozone                                                 S5 - S6
                    Vertical Component of EP Flux                         S7
                    Ozone Hole                                            S8
            Appendix 2: Additional Figures
                    Arctic Oscillation and 500-hPa Anomalies              A2.1
                    Snow Cover                                            A2.2

                                                    5
Tropical Highlights - March 2021
During March 2021, sea surface temperatures (SSTs) remained below-average across the central
and eastern equatorial Pacific (Fig. T18). The latest monthly Niño indices were -0.3°C for the Niño
1+2 region, -0.5°C for the Niño 3.4 region and -0.6°C for the Niño 4 region (Fig. T5, Table T2). The
depth of the oceanic thermocline (measured by the depth of the 20°C isotherm) was below-average
in the eastern equatorial Pacific (Figs. T15, T16). The corresponding sub-surface temperatures were
1-3°C below-average (Fig. T17).
Also during March, the lower-level easterly winds and the upper-level westerly winds were
above-average across much of the equatorial Pacific (Fig. T20, Fig. T21). Meanwhile, tropical con-
vection continued to be suppressed over the western and central equatorial Pacific (Figs. T25, E3).
Collectively, these oceanic and atmospheric anomalies were consistent with La Niña conditions.
For the latest status of the ENSO cycle see the ENSO Diagnostic Discussion at:
http://www.cpc.ncep.noaa.gov/products/analysis_monitoring/enso_advisory/index.html
6200-hPa
SLP Anomalies Tahiti 850-hPa Zonal Wind Index Wind OLR Index
minus Index
Month Darwin SOI 5N-5S 5N-5S 5N-5S 5N-5S 5N-5S
Tahiti Darwin 135E-180 175W- 135W- 165W- 160E-160W
140W 120W 110W
MAR 21 0.4 -0.2 0.4 1.3 0.8 0.7 1.3 1.4
FEB 21 0.9 -1.8 1.5 0.4 1.3 1.4 2.3 1.1
JAN 21 2.5 -1.1 1.9 2.1 1.6 -0.6 3.3 2.4
DEC 20 2.5 -0.9 1.8 1.8 1.8 0.0 2.3 2.0
NOV 20 1.4 0.1 0.7 1.7 1.4 0.3 0.4 1.5
OCT 20 0.1 -0.8 0.5 1.0 1.7 2.0 1.6 1.2
1.1 -0.6 0.9 1.1 1.4 1.4 1.5 0.9
7
SEP 20
AUG 20 1.1 -0.9 1.1 0.5 0.4 0.5 0.0 0.9
JUL 20 0.1 -0.7 0.4 1.1 1.0 1.1 0.7 0.9
JUN 20 -0.8 0.0 -0.4 0.5 0.2 1.1 0.0 1.1
MAY 20 1.7 0.9 0.4 0.8 1.2 1.7 1.0 0.7
APR 20 1.0 0.6 0.2 0.4 1.1 0.9 0.9 0.7
MAR 20 0.5 0.8 -0.1 0.4 1.0 1.0 1.1 0.1
TABLE T1 - Atmospheric index values for the most recent 12 months. Indices are standardized by the mean annual standard deviation, except for the Tahiti
and Darwin SLP anomalies which are in units of hPa. Positive (negative) values of 200-hPa zonal wind index imply westerly (easterly) anomalies. Positive
(negative) values of 850-hPa zonal wind indices imply easterly (westerly) anomalies. Anomalies are departures from the 1981-2010 base period means.PACIFIC SST ATLANTIC SST GLOBAL
Month
Niño 1+2 Niño 3 Niño 3.4 Niño 4 N.ATL S. ATL TROPICS
0-10S 5N-5S 5N-5S 5N-5S 5N-20N 0-20S 10N-10S
90W-80W 150W-90W 170W-120W 160E-150W 60W-30W 30W-10E 0-360
MAR 21 -0.3 26.5 -0.4 26.8 -0.5 26.8 -0.6 27.8 0.1 25.7 -0.4 26.8 -0.2 28.2
FEB 21 -0.7 25.5 -0.6 25.8 -0.9 25.8 -1.0 27.2 0.3 26.0 -0.5 26.1 -0.3 27.7
JAN 21 -0.8 23.7 -0.7 25.0 -1.1 25.5 -1.2 27.1 0.7 26.7 -0.1 25.5 -0.3 27.4
DEC 20 -0.7 22.2 -0.8 24.4 -1.0 25.5 -0.8 27.7 0.5 27.3 -0.4 24.3 -0.1 27.6
NOV 20 -0.7 20.9 -1.2 23.8 -1.3 25.3 -0.7 27.9 0.3 27.9 -0.2 23.7 -0.1 27.6
OCT 20 -1.2 19.6 -1.3 23.6 -1.4 25.3 -0.8 27.9 0.3 28.4 -0.1 23.2 -0.1 27.4
8
SEP 20 -0.9 19.5 -1.3 23.6 -1.0 25.8 -0.4 28.3 0.3 28.4 -0.1 22.9 -0.0 27.2
AUG 20 -0.9 19.7 -0.5 24.5 -0.6 26.2 -0.2 28.5 0.4 28.2 0.3 23.4 0.2 27.4
JUL 20 -1.2 20.5 -0.5 25.1 -0.3 26.9 0.1 28.9 0.5 27.8 0.0 23.8 0.2 27.7
JUN 20 -0.7 22.1 -0.7 25.8 -0.4 27.3 0.2 29.1 0.6 27.3 0.4 25.3 0.3 28.3
MAY 20 0.1 24.4 -0.2 26.9 -0.2 27.6 0.2 29.0 0.2 26.6 0.7 26.9 0.4 28.9
APR 20 0.4 26.0 0.5 28.0 0.5 28.3 0.8 29.3 0.4 26.4 0.2 27.2 0.5 29.1
MAR 20 0.5 27.1 0.3 27.4 0.6 27.8 1.0 29.2 0.6 26.2 0.7 27.8 0.6 28.9
TABLE T2. Mean and anomalous sea surface temperature (°C) for the most recent 12 months. Anomalies are departures from the 1981–2010
adjusted OI climatology (Smith and Reynolds 1998, J. Climate, 11, 3320-3323).FIGURE T1. Five-month running mean of the Southern Oscillation Index (SOI) (top), sea-level pressure anomaly (hPa)
at Darwin and Tahiti (middle), and outgoing longwave radiation anomaly (OLR) averaged over the area 5N-5S,
160E-160W (bottom). Anomalies in the top and middle panels are departures from the 1981-2010 base period
means and are normalized by the mean annual standard deviation. Anomalies in the bottom panel are departures
from the 1981-2010 base period means. Individual monthly values are indicated by “x”s in the top and bottom
panels. The x-axis labels are centered on July.
9FIGURE T2. Three-month running mean of a CDAS/Reanalysis-derived (a) Southern Oscillation Index (RSOI), (b)
standardized pressure anomalies near Tahiti (solid) and Darwin (dashed), (c) an equatorial SOI ([EPAC] - [INDO]),
and (d) standardized equatorial pressure anomalies for (EPAC) (solid) and (INDO) (dashed). Anomalies are de-
partures from the 1981-2010 base period means and are normalized by the mean annual standard deviation. The
equatorial SOI is calculated as the normalized difference between the standardized anomalies averaged between
5°N–5°S, 80°W–130°W (EPAC) and 5°N–5°S, 90°E–140°E (INDO).
10FIGURE T3. Five-month running mean (solid lines) and individual monthly mean (dots) of the 200-hPa zonal wind
anomalies averaged over the area 5N-5S, 165W-110W (top), the 500-hPa virtual temperature anomalies averaged
over the latitude band 20N-20S (middle), and the equatorial zonally-averaged zonal wind anomalies at 30-hPa
(red) and 50-hPa (blue) (bottom). In the top panel, anomalies are normalized by the mean annual standard devia-
tion. Anomalies are departures from the 1981-2010 base period means. The x-axis labels are centered on January.
11FIGURE T4. Five-month running mean (solid line) and individual monthly mean (dots) of the standardized 850-hPa
zonal wind anomaly index in the latitude belt 5N-5S for 135E-180 (top), 175W-140W (middle) and 135W-120W
(bottom). Anomalies are departures from the 1981-2010 base period means and are normalized by the mean an-
nual standard deviation.The x-axis labels are centered on January. Positive (negative) values indicate easterly
(westerly) anomalies.
12FIGURE T5. Nino region indices, calculated as the area-averaged sea surface temperature anomalies (C) for the speci-
fied region. The Nino 1+2 region (top) covers the extreme eastern equatorial Pacific between 0-10S, 90W-80W.
The Nino-3 region (2nd from top) spans the eastern equatorial Pacific between 5N-5S, 150W-90W. The Nino 3.4
region 3rd from top) spans the east-central equatorial Pacific between 5N-5S, 170W-120W. The Nino 4 region
(bottom) spans the date line and covers the area 5N-5S, 160E-150W. Anomalies are departures from the 1981-
2010 base period monthly means (Smith and Reynolds 1998, J. Climate, 11, 3320-3323). Monthly values of each
index are also displayed in Table 2.
13FIGURE T6. Time-longitude section of mean (top) and anomalous (bottom) sea level pressure (SLP) averaged between
5N-5S (CDAS/Reanalysis). Contour interval is 1.0 hPa (top) and 0.5 hPa (bottom). Dashed contours in bottom
panel indicate negative anomalies. Anomalies are departures from the 1981-2010 base period monthly means. The
data are smoothed temporally using a 3-month running average.
14FIGURE T7. Time-longitude section of mean (top) and anomalous (bottom) 850-hPa zonal wind averaged between
5N-5S (CDAS/Reanalysis). Contour interval is 2 ms-1. Blue shading and dashed contours indicate easterlies (top)
and easterly anomalies (bottom). Anomalies are departures from the 1981-2010 base period monthly means. The
data are smoothed temporally using a 3-month running average.
15FIGURE T8. Time-longitude section of mean (top) and anomalous (bottom) outgoing longwave radiation (OLR)
averaged between 5N-5S. Contour interval is 10 Wm-2. Dashed contours in bottom panel indicate negative OLR
anomalies. Anomalies are departures from the 1981-2010 base period monthly means. The data are smoothed
temporally using a 3-month running average.
16FIGURE T9. Time-longitude section of monthly mean (top) and anomalous (bottom) sea surface temperature (SST)
averaged between 5N-5S. Contour interval is 1C (top) and 0.5C (bottom). Dashed contours in bottom panel indi-
cate negative anomalies. Anomalies are departures from the 1981-2010 base period means (Smith and Reynolds
1998, J. Climate, 11, 3320-3323).
17FIGURE T10. Time-longitude section of anomalous sea level pressure (hPa) averaged between 5N-5S (CDAS/Re-
anaysis). Contour interval is 1 hPa. Dashed contours indicate negative anomalies. Anomalies are departures from
the 1981-2010 base period pentad means. The data are smoothed temporally using a 3-point running average.
18FIGURE T11. Time-longitude section of anomalous outgoing longwave radiation averaged between 5N-5S. Contour
interval is 15 Wm-2. Dashed contours indicate negative anomalies. Anomalies are departures from the 1981-2010
base period pentad means. The data are smoothed temporally using a 3-point running average.
19FIGURE T12. Time-longitude section of anomalous 200-hPa velocity potential averaged between 5N-5S (CDAS/Re-
analysis). Contour interval is 3 x 10⁶ m2s-1. Dashed contours indicate negative anomalies. Anomalies are departures
from the 1981-2010 base period pentad means. The data are smoothed temporally using a 3-point running average.
20FIGURE T13. Time-longitude section of anomalous 850-hPa zonal wind averaged between 5N-5S (CDAS/Reanalysis).
Contour interval is 2 ms-1. Dashed contours indicate negative anomalies. Anomalies are departures from the 1981-
2010 base period pentad means. The data are smoothed temporally by using a 3-point running average.
21FIGURE T14. Equatorial time-height section of anomalous zonally-averaged zonal wind (m s-1) (CDAS/Reanalysis).
Contour interval is 10 ms-1. Anomalies are departures from the 1981-2010 base period monthly means.
22FIGURE T15. Mean (top) and anomalous (bottom) depth of the 20C isotherm averaged between 5N-5S in the Pacific
Ocean. Data are derived from the NCEP’s global ocean data assimilation system which assimilates oceanic obser-
vations into an oceanic GCM (Behringer, D. W., and Y. Xue, 2004: Evaluation of the global ocean data assimila-
tion system at NCEP: The Pacific Ocean. AMS 84th Annual Meeting, Seattle, Washington, 11-15). The contour
interval is 10 m. Dashed contours in bottom panel indicate negative anomalies. Anomalies are departures from
the 1981-2010 base period means.
23FIGURE T16. Mean (top) and anomalous (bottom) depth of the 20°C isotherm for MAR 2021. Contour interval is
40 m (top) and 10 m (bottom). Dashed contours in bottom panel indicate negative anomalies. Data are derived
from the NCEP’s global ocean data assimilation system version 2 which assimilates oceanic observations into an
oceanic GCM (Xue, Y. and Behringer, D.W., 2006: Operational global ocean data assimilation system at NCEP,
to be submitted to BAMS). Anomalies are departures from the 1981–2010 base period means.
24FIGURE T17. Equatorial depth-longitude section of ocean temperature (top) and ocean temperature anomalies (bottom)
for MAR 2021. Contour interval is 1°C. Dashed contours in bottom panel indicate negative anomalies. Data are
derived from the NCEP’s global ocean data assimilation system version 2 which assimilates oceanic observations
into an oceanic GCM (Xue, Y. and Behringer, D.W., 2006: Operational global ocean data assimilation system at
NCEP, to be submitted to BAMS). Anomalies are departures from the 1981–2010 base period means.
25FIGURE T18. Mean (top) and anomalous (bottom) sea surface temperature (SST). Anomalies are departures from the
1981-2010 base period monthly means (Smith and Reynolds 1998, J. Climate, 11, 3320-3323).
26FIGURE T19. Mean (top) and anomalous (bottom) sea level pressure (SLP) (CDAS/Reanalysis). In top panel, 1000
hPa has been subtracted from contour labels, contour interval is 2 hPa, and values below 1000 hPa are indicated
by dashed contours. In bottom panel, anomaly contour interval is 1 hPa and negative anomalies are indicated by
dashed contours. Anomalies are departures from the 1981-2010 base period monthly means.
27FIGURE T20. Mean (top) and anomalous (bottom) 850-hPa vector wind (CDAS/Reanaysis) for MAR 2021. Contour
interval for isotachs is 4 ms-1 (top) and 2 ms-1 (bottom). Anomalies are departures from the 1981-2010 base
period monthly means.
28FIGURE T21. Mean (top) and anomalous (bottom) 200-hPa vector wind (CDAS/Reanalysis) for MAR 2021. Contour
interval for isotachs is 15 ms-1 (top) and 5 ms-1 (bottom). Anomalies are departures from 1981-2010 base period
monthly means.
29FIGURE T22. Mean (top) and anomalous (bottom) 200-hPa streamfunction (CDAS/Reanalysis). Contour interval is
20 x 106 m2s-1 (top) and 5 x 10⁶ m2s-1 (bottom). Negative (positive) values are indicated by dashed (solid) lines.
The non-divergent component of the flow is directed along the contours with speed proportional to the gradient.
Thus, high (low) stream function corresponds to high (low) geopotential height in the Northern Hemisphere and
to low (high) geopotential height in the Southern Hemisphere. Anomalies are departures from the 1981-2010 base
period monthly means.
30FIGURE T23. Mean (top) and anomalous (bottom) 200-hPa divergence (CDAS/Reanalysis). Divergence and anomalous
divergence are shaded blue. Convergence and anomalous convergence are shaded orange. Anomalies are departures
from the 1981-2010 base period monthly means.
31FIGURE T24. Mean (top) and anomalous (bottom) 200-hPa velocity potential (106m2s) and divergent wind (CDAS/
Reanalysis). Anomalies are departures from the 1981-2010 base period monthly means.
32FIGURE T25. Mean (top) and anomalous (bottom) outgoing longwave radiation for MAR 2021 (NOAA 18 AVHRR
IR window channel measurements by NESDIS/ORA). OLR contour interval is 20 Wm-2 with values greater than
280 Wm-2 indicated by dashed contours. Anomaly contour interval is 15 Wm-2 with positive values indicated by
dashed contours and light shading. Anomalies are departures from the 1981-2010 base period monthly means.
33FIGURE T26. Estimated total (top) and anomalous (bottom) rainfall (mm) based on the Special Sensor Microwave/
Imager (SSM/S) precipitation index (Ferraro 1997, J. Geophys. Res., 102, 16715-16735). Anomalies are computed
from the SSM/I 1987-2010 base period monthly means. Anomalies have been smoothed for display purposes.
34FIGURE T27. Mean (top) and anomalous (bottom) cloud liquid water (g m-2) based on the Special Sensor Microwave/
Imager (SSM/I) (Weng et al 1997: J. Climate, 10, 1086-1098). Anomalies are calculated from the 1987-2010
base period means.
35FIGURE T28. Mean (top) and anomalous (bottom) vertically integrated water vapor or precipitable water (kg m-2) based
on the Special Sensor Microwave/Imager (SSM/I) (Ferraro et. al, 1996: Bull. Amer. Meteor. Soc., 77, 891-905).
Anomalies are calculated from the 1987-2010 base period means.
36FIGURE T29. Pressure-longitude section (100E-80W) of the mean (top) and anomalous (bottom) divergence (contour
interval is 1 x 10⁻⁶ s-1) and divergent circulation averaged between 5N-5S. The divergent circulation is represented
by vectors of combined pressure vertical velocity and the divergent component of the zonal wind. Red shading
and solid contours denote divergence (top) and anomalous divergence (bottom). Blue shading and dashed contours
denote convergence (top) and anomalous convergence (bottom). Anomalies are departures from the 1981-2010
base period monthly means.
37FIGURE T30. Pressure-longitude section (80W-100E) of the mean (top) and anomalous (bottom) divergence (contour
interval is 1 x 10⁻⁶ s-1) and divergent circulation averaged between 5N-5S. The divergent circulation is represented
by vectors of combined pressure vertical velocity and the divergent component of the zonal wind. Red shading
and solid contours denote divergence (top) and anomalous divergence (bottom). Blue shading and dashed contours
denote convergence (top) and anomalous convergence (bottom). Anomalies are departures from the 1981-2010
base period monthly means.
38FIGURE T31. Pressure-latitude section of the mean (top) and anomalous (bottom) zonal wind (m s-1) and divergent
circulation averaged over the west Pacific sector (120E-170E). The divergent circulation is represented by vectors
of combined pressure vertical velocity and the divergent component of the meridional wind. Red shading and
solid contours denote a westerly (top) or anomalous westerly (bottom) zonal wind. Blue shading and dashed
contours denote an easterly (top) or anomalous easterly (bottom) zonal wind. Anomalies are departures from
the 1981-2010 base period monthly means.
39FIGURE T32. Pressure-latitude section of the mean (top) and anomalous (bottom) zonal wind (m s-1) and divergent
circulation averaged over the central Pacific sector (130W-180W). The divergent circulation is represented by
vectors of combined pressure vertical velocity and the divergent component of the meridional wind. Red shading
and solid contours denote a westerly (top) or anomalous westerly (bottom) zonal wind. Blue shading and dashed
contours denote an easterly (top) or anomalous easterly (bottom) zonal wind. Anomalies are departures from the
1981-2010 base period monthly means.
40Tropical Pacific Drifting Buoys R. Lumpkin/M. Pazos, AOML, Miami
During March 2021, 216 satellite-tracked surface drifting buoys were reporting from the tropical
Pacific. The drifters did not reveal large-scale anomalies from March surface current climatology.
Figure A1.1 Top: Movements of drifting buoys in the tropical Pacific Ocean during March 2021. The linear segments
of each trajectory represent a one week displacement. Trajectories of buoys which have lost their subsurface drogues are
gray; those with drogues are black.
Middle: Monthly mean currents calculated from all buoys 1993-2002 (gray), and currents measured by the drogued
buoys this month (black) smoothed by an optimal filter.
Bottom: Anomalies from the climatological monthly mean currents for this month.
4142
FIGURE A1.2.NEAR-SURFACE CURRENTS : MARCH 2021
20N
10N
0N
10S
20S
50 cm/s
120E 140E 160E 180 160W 140W 120W 100W 80W
MARCH 2021 ANOMALIES
20N
10N
0N
10S
20S
50 cm/s
120E 140E 160E 180 160W 140W 120W 100W 80W
FIGURE A1.3. Ocean Surface Current Analysis-Real-time (OSCAR) for MAR 2021 (Bonjean and Lagerloef 2002, J.
Phys. Oceanogr., Vol. 32, No. 10, 2938-2954; Lagerloef et al. 1999, JGR-Oceans, 104, 23313-23326). (top) Total
velocity. Surface currents are calculated from satellite data including Jason sea level anomalies and NCEP winds.
(bottom) Velocity anomalies. The subtracted climatology was based on SSM/I and QuickScat winds and Topex/
Poseidon and Jason from 1993-2003. See also http://www.oscar.noaa.gov.
43NEAR-SURFACE CURRENTS : MARCH 2021
20N 20N
10N 10N
50 cm/s
0N 0N
10S 10S
50 cm/s
20S 20S
80W 60W 40W 20W 0 20E 40E 60E 80E 100E 120E
MARCH 2021 ANOMALIES
20N 20N
44
10N 10N
50 cm/s
0N 0N
10S 10S
50 cm/s
20S 20S
80W 60W 40W 20W 0 20E 40E 60E 80E 100E 120E
FIGURE A1.4. Ocean Surface Current Analysis-Real-time (OSCAR) for MAR 2021 (Bonjean and Lagerloef 2002, J. Phys. Oceanogr., Vol. 32, No. 10, 2938-
2954; Lagerloef et al. 1999, JGR-Oceans, 104, 23313-23326). (top) Total velocity. Surface currents are calculated from satellite data including Jason sea level
anomalies and NCEP winds. (bottom) Velocity anomalies. The subtracted climatology was based on SSM/I and QuickScat winds and Topex/Poseidon and
Jason from 1993-2003. See also http://www.oscar.noaa.gov.Forecast Forum
The canonical correlation analysis (CCA) forecast of SST in the central Pacific (Barnett et al.
1988, Science, 241, 192196; Barnston and Ropelewski 1992, J. Climate, 5, 13161345), is shown
in Figs. F1 and F2. This forecast is produced routinely by the Prediction Branch of the Climate
Prediction Center. The predictions from the National Centers for Environmental Prediction (NCEP)
Coupled Forecast System Model (CFS03) are presented in Figs. F3 and F4a, F4b. Predictions
from the Markov model (Xue, et al. 2000: J. Climate, 13, 849871) are shown in Figs. F5 and F6.
Predictions from the latest version of the LDEO model (Chen et al. 2000: Geophys. Res. Let., 27,
25852587) are shown in Figs. F7 and F8. Predictions from the ENSO CLIPER statistical model
(Knaff and Landsea 1997, Wea. Forecasting, 12, 633 652) are shown in Fig. F9. Niño 3.4 predictions
are summarized in Fig. F10, provided by the Forecasting and Prediction Research Group of the IRI.
The CPC and the contributors to the Forecast Forum caution potential users of this predictive
information that they can expect only modest skill.
ENSO Alert System Status: La Niña Advisory
Outlook
A transition from La Niña to ENSO-Neutral is likely in the next month or so, with an 80%
chance of ENSO-neutral during May-July 2021.
Discussion
La Niña continued during March, reflected by negative sea surface temperatures (SST) anomalies,
which extended across much of the equatorial Pacific Ocean (Fig. T18). Except for Niño-1+2, the
monthly Niño index values were at or near -0.5ºC (Table T2). Sub-surface ocean temperatures also
weakened during the month, with the integrated anomalies averaged between the 180-100°W becom-
ing positive during the middle of the month. Currently, negative subsurface temperature anomalies
are present from the surface to approximately ~100m below the surface only in the eastern Pacific
between 110°W and 80°W (Fig. T17). Low-level easterly wind anomalies are present but weak across
the equatorial Pacific, and are most notable in the far western Pacific (Fig. T20). Upper-level wind
anomalies were westerly across most of the tropical Pacific (Fig. T21). The suppression of tropical
convection over the western and central Pacific persisted during March, although the enhancement
of rainfall around the Philippines and Indonesia weakened (Fig. T25). The Southern Oscillation
and Equatorial Southern Oscillation indices were weakly positive in March (Table T1 & Fig. T2).
Overall, the trend in the coupled ocean-atmosphere system is consistent with a weakening La Niña.
Most of the models in the IRI/CPC plume predict a transition to ENSO-neutral during the
Northern Hemisphere spring 2021 (Figs. F1-F12). The forecaster consensus agrees that a transi-
45tion is imminent, with a 50-50% chance of La Niña or ENSO-neutral for the March-May average,
and then predicts ENSO-neutral to continue at least through the Northern Hemisphere summer. In
part, due to the uncertainty in predictions made at this time of year, the forecast for the Northern
Hemisphere Fall 2021 has lower confidence with a 40-50% chance of either La Niña or ENSO-
Neutral, with a small chance for El Niño. In summary, a transition from La Niña to ENSO-Neutral
is likely in the next month or so, with an 80% chance of ENSO-neutral during May-July 2021.
.
Weekly updates of oceanic and atmospheric conditions are available on the Climate Prediction
Center homepage (El Niño/La Niña Current Conditions and Expert Discussions).
461-Month Lead Forecast and Observed Nino 3.4 1-Month Lead Forecast Correlation Skill
2.5 1
2
1.5 0.8
1
0.5 0.6
0
-0.5 0.4
-1
-1.5 0.2
-2
-2.5 0
AS 2 20
AS 2 20
JA 2 0
21
JA 2 0
21
SO 20 0
M 21
SO 20 0
FM 2 21
MA 2 21
MA 2 1
JF 20 0
J 21
JF 20 0
J 21
A 2
A 2
ON 20 0
1
ON 20 0
1
D 20
D 20
O 02
O 02
J 20
J 20
A 02
J 1
J 1
F 2
F 2
0
0
JJ 20
20
JJ 20
20
N 2
M 02
N 2
M 02
A 0
AM 202
AM 202
DJ 20
MJ 20
DJ 20
MJ 20
ND 20
ND 20
FM 2
J
J
S
S
M
MJ
MJ
2-Month Lead Forecast and Observed Nino 3.4 2-Month Lead Forecast Correlation Skill
2.5 1
2
1.5 0.8
1
0.5 0.6
0
-0.5 0.4
-1
-1.5 0.2
-2
-2.5 0
AS 2 20
21
AS 2 20
21
A 21
A 21
SO 20 0
M 21
SO 20 0
FM 2 21
MA 2 21
MA 2 1
JF 20 0
J 21
JF 20 0
J 21
ON 20 0
1
ON 20 0
1
D 20
D 20
O 02
O 02
J 20
J 20
A 02
J 1
J 1
F 2
F 2
0
20
0
20
JJ 20
JJ 20
N 2
M 02
N 2
M 02
A 0
AM 202
AM 202
DJ 20
MJ 20
DJ 20
MJ 20
JA 2
JA 2
ND 20
ND 20
FM 2
A
A
S
S
M
JJ
JJ
3-Month Lead Forecast and Observed Nino 3.4 3-Month Lead Forecast Correlation Skill
2.5 1
2
1.5 0.8
1
0.5 0.6
0
-0.5 0.4
-1
-1.5 0.2
-2
-2.5 0
20 1
20 1
JA 2 1
JA 2 1
SO 20 20
FM 2 21
21
SO 20 20
M 21
21
MA 2 1
MA 2 21
JF 20 0
J 21
JF 20 0
J 21
S 02
S 02
A 2
A 2
ON 20 0
1
N 20
1
D 20
D 20
J 20
J 20
A 02
J 1
J 1
F 2
F 2
JJ 20
JJ 20
N 2
M 02
M 02
O 0
O 0
A 0
AM 202
AM 202
DJ 20
MJ 20
DJ 20
MJ 20
ON 20
AS S 2
AS S 2
ND 20
ND 20
FM 2
M
JA
JA
FIGURE F1. Canonical correlation analysis (CCA) sea surface temperature (SST) anomaly prediction for the central
Pacific (5N to 5S, 120W to 170W (Barnston and Ropelewski, 1992,i J. Climate, 5, 1316-1345)). The three plots
on the left are, from top to bottom, the 1-month, 2-month, and 3-month lead seasonal forecasts from the past 12
months plus the current month. The triangles in each plot are the observed SST anomaly through the latest avail-
able season. The lines at the mid-points of the forecast error bars represent the real-time CCA predictions based
on the anomalies of quasi-global sea level pressure, the anomalies of tropical Pacific SST, and heat content of the
upper 300 meters of the near-equator tropical Pacific (10S to 10N). The vertical lines represent the two standard
deviation error bars for the predictions based on past performance. The three plots on the right are skill values
for the corresponding seasons, from the correlations of the predicted and observed SST in the prior 10 years of
simulated real-time forecasts. Skill values show a clear annual cycle and are inversely proportional to the length
of the error bars depicted in the forecast time series.
47Canonical Correlation Analysis Nino 3.4 Forecast for 0 to 13 Months Lead
2.5
2
1.5
1
0.5
0
-0.5
-1
-1.5
-2
-2.5
S 20
S 21
A 0
A 1
22
O 20
M 21
O 21
M 22
A 21
A 22
F 0
J 1
F 1
J 2
JJ 02
JJ 02
N 20
M 21
N 21
M 22
D 20
D 21
J 0
J 1
J 1
J 2
DJ 02
MJ 02
DJ 02
MJ 02
JA 20
JA 20
20
AS 20
JF 20
AS 20
JF 20
ND 02
ND 02
FM 20
FM 20
AM 02
AM 02
2
2
SO 20
MA 20
SO 20
MA 20
ON 20
ON 20
2
2
2
2
2
2
2
2
J
MJ
FIGURE F2. Canonical Correlation Analysis (CCA) forecast of sea-surface temperature anomalies for the Nino 3.4
region (5N-5S, 120W-170W) for the upcoming year of three-month overlapping periods. The CCA predictions
are based on anomaly patterns of sea level pressure, tropical Pacific SST, and heat content of the upper 300 me-
ters of the near-equator tropical Pacific (10S to 10N). Small squares at the midpoints of the vertical forecast bars
represent the CCA predictions, and the bars show the one (thick) and two (thin) standard deviation errors. The
triangles and line represent the observed three-month mean SST anomaly in the Nino 3.4 region up to the most
recently available data.
48FIGURE F3. Predicted 3-month average sea surface temperature (left) and anomalies (right) from the NCEP Coupled
Forecast System Model (CFS03). The forecasts consist of 40 forecast members. Contour interval is 1°C, with ad-
ditional contours for 0.5°C and -0.5°C. Negative anomalies are indicated by dashed contours.
49FIGURE F4. Predicted and observed sea surface temperature (SST) anomalies for the Nino 3 (top) and Nino 3.4
(bottom) regions from the NCEP Coupled Forecast System Model (CFS03). The forecasts consist of 40 forecast
members. The ensemble mean of all 40 forecast members is shown by the blue line, individual members are shown
by thin lines, and the observation is indicated by the black line. The Nino-3 region spans the eastern equatorial
Pacific between 5N-5S, 150W-90W. The Nno 3.4 region spans the east-central equatorial Pacific between 5N-5S,
170W-120W.
50FIGURE F5. Predicted 3-month average sea surface temperature anomalies from the NCEP/CPC Markov model (Xue
et al. 2000, J. Climate, 13, 849-871). The forecast is initiated in MAR 2021 . Contour interval is 0.3C and nega-
tive anomalies are indicated by dashed contours. Anomalies are calculated relative to the 1971-2000 climatology.
5152
FIGURE F6. Time evolution of observed and predicted SST anomalies in the Nino 3.4 region (up to 12 lead months) by the NCEP/CPC Markov model (Xue et al.
2000, J. Climate, 13, 849-871). Anomalies are calculated relative to the 1971-2000 climatology. Shown in each panel are the forecasts grouped by three consecu-
tive starting months: (a) is for December, January, and February, (b) is for March, April, and May, (c) is for June, July, and August, and (d) is for September,
October, and November. The observed Nino 3.4 SST anomalies are indicated by the black dashed lines. The Nino 3.4 region spans the east-central equatorial
Pacific between 5N-5S, 170W-120W.FIGURE F7. Forecasts of the tropical Pacific Predicted SST (shading) and vector wind anomalies for the next 3 sea-
sons based on the LDEO model. Each forecast represents an ensemble average of 3 sets of predictions initialized
during the last three consecutive months (see Figure F8).
53FIGURE F8. LDEO forecasts of SST anomalies for the Nino 3 region using wind stresses obtained from (top) Qui-
kSCAT, (middle) NCEP, and (bottom) Florida State Univ. (FSU), along with SSTs (obtained from NCEP), and sea
surface height data (obtained from TOPEX/POSEIDON) data. Each thin blue line represents a 12-month forecast,
initialized one month apart for the past 24 months. Observed SST anomalies are indicated by the thick red line.
The Nino-3 region spans the eastern equatorial Pacific between 5N-5S, 150W-90W.
54Nino 4 (1 April)
2
1.5
1
SSTA (C)
0.5
0
-0.5
-1
-1.5
-2
2019 2019.5 2020 2020.5 2021 2021.5 2022 2022.5 2023 2023.5
YEAR
Nino 3.4 (1 April)
3
2
SSTA (C)
1
0
-1
-2
-3
2019 2019.5 2020 2020.5 2021 2021.5 2022 2022.5 2023 2023.5
YEAR
Nino 3 (1 April)
4
3
2
SSTA (C)
1
0
-1
-2
-3
-4
2019 2019.5 2020 2020.5 2021 2021.5 2022 2022.5 2023 2023.5
YEAR
Nino 1&2 (1 April)
4
3
2
SSTA (C)
1
0
-1
-2
-3
-4
2019 2019.5 2020 2020.5 2021 2021.5 2022 2022.5 2023 2023.5
YEAR
SOI (1 April)
4
Standard Deviations
3
2
1
0
-1
-2
-3
-4
2019 2019.5 2020 2020.5 2021 2021.5 2022 2022.5 2023 2023.5
YEAR
FIGURE F9. ENSO-CLIPER statistical model forecasts of three-month average sea surface temperature anomalies
(green lines, deg. C) in (top panel) the Nino 4 region (5N-5S, 160E-150W), (second panel) the Nino 3.4 region
(5N-5S, 170W-120W), (third panel) the Nino 3 region (5N-5S, 150W-90W), and (fourth panel) the Nino 1+2 region
(0-10S, 90W-80W) (Knaff and Landsea 1997, Wea. Forecasting, 12, 633-652). Bottom panel shows predictions of
the three-month standardized Southern Oscillation Index (SOI, green line). Horizontal bars on green line indicate
the adjusted root mean square error (RMSE). The Observed three-month average values are indicated by the thick
blue line. SST anomalies are departures from the 1981-2010 base period means, and the SOI is calculated from
the 1951-1980 base period means.
55Model Predictions of ENSO from Mar 2021
3.0
CPC CONSOL Dynamical Models
DYN AVG KMA SNU
STAT AVG NASA GMAO
2.5
2.0
IRI/CPC NCEP CFSv2
JMA
SAUDI-KAU
LDEO
COLA CCSM4
MetFRANCE
1.5
Nino3.4 SST Anomaly ( C)
GFDL SPEAR
CMC CANSIP
UKMO
1.0 ECMWF
BCC_CSM11m
AUS-ACCESS
0.5 CS-IRI-MM
IOCAS ICM
0.0
0.5
1.0 Statistical Models
CPC MRKOV
CPC CA
1.5 CSU CLIPR
IAP-NN
FSU REGR
2.0 UCLA-TCD
BCC_RZDM
OBSERVED FORECAST NTU CODA
2.5
DJF Feb FMA MAM AMJ MJJ JJA JAS ASO SON OND NDJ
FIGURE F10. Time series of predicted sea surface temperature anomalies for the Nino 3.4 region (deg. C) from various
dynamical and statistical models for nine overlapping 3-month periods. The Nino 3.4 region spans the east-central
equatorial Pacific between 5N-5S, 170W-120W. Figure provided by the International Research Institute (IRI).
56Extratropical Highlights – March 2021
1. Northern Hemisphere
The 500-hPa circulation during March featured highest above-average heights across the cen-
tral North Pacific, with moderate above-average heights across the eastern half of the U.S., Gulf
of Mexico region, and northern portions of the North Atlantic Ocean and below-average heights
stretching from northern Canada into northern and central Russia (Fig. E9).
The main land-surface temperature signals during March included above-average temperatures
throughout central and eastern portions of Canada and the U.S., southern Eurasia, as well as the
central and eastern portions of Russia. (Fig. E1). The main precipitation signals included above-
average totals in the central regions of the U.S., the northern and western portions of Russia, and
in the vicinity of Egypt and the western Sahara (Fig. E3).
a. North America
The 500-hPa circulation during March featured highest above-average heights across the cen-
tral North Pacific, with moderate above-average heights across the central and eastern portions of
the U.S. and Canada, the Gulf of Mexico and adjacent regions, and below-average heights across
Alaska and adjacent portions of Canada. (Fig. E9). This pattern was associated with an anoma-
lous jet stream pattern across the North Pacific Ocean and enhanced subtropical jet stream across
southwestern and central U.S. (Fig. T21).
These conditions were associated with well above-average surface temperatures across the central
and eastern portions of Canada and the U.S., with departures in many regions exceeding the 90th
percentile of occurrences (Fig. E1). They were also associated with above-average precipitation from
the Great Plains to the upper Midwest in the U.S. (Fig. E3). In these regions, the most significant
precipitation anomalies were observed with totals in the 90th percentile of occurrences (Fig. E5).
b. Eurasia
The 500-hPa circulation during March featured moderate above-average heights across Iceland
to western Europe, thru Saudi Arabia, India, China, and Japan, and the northeastern flanks of Eur-
asia, where the largest departures from normal are observed, and below-average heights stretching
from northern Canada into northern and central Russia toward the vicinity of the Caspian and Black
Seas. Lowest below-average heights are near the East Siberian Sea and the northwestern region of
Russia. (Fig. E9). This pattern ushered in warmer conditions for the southern and eastern portions
of Eurasia and enhanced storm tracks across a southwest to northeast tilt in central Eurasia (Figs.
E1 and E3).
572. Southern Hemisphere
The 500-hPa height field during March featured moderate above-average heights across southern
South America and the south Pacific Ocean with highest departures from normal over the South-
ern Ocean and adjacent portions of Antarctica. Below-average heights in the southeastern portion
of Australia, and the southern portions of the Atlantic Ocean, Indian Ocean, and Pacific Ocean,
specifically near the Ross Sea where the largest departures from normal are located (Fig. E15). In
southeastern Australia, above-average precipitation was recorded during March (Fig. E3). This in-
creased rainfall resulted from increased storminess linked to enhanced upper-level westerlies (Fig.
T21) and cyclonic streamfunction anomalies (Fig. T22) across the region.
The South African monsoon season runs from October to April. During March 2021, precipita-
tion was below-average in the eastern half of southern Africa and above-average in the western half
(Fig. E3). For the monsoon region, area-averaged rainfall totals were below average for March
2021 (Fig. E4). In the preceding 3 months, area-averaged totals had been at the 80th percentile or
above following a drier than average start to the 2020-2021 rainy season (Fig. E4).
58TELECONNECTION INDICES
North Atlantic North Pacific EURASIA
Month NAO EA WP EP-NP PNA TNH EATL/ SCAND POLEUR
WRUS
MAR 21 0.4 -0.2 2.1 -1.3 -1.2 --- 3.0 -0.9 0.6
FEB 21 -0.3 1.2 0.8 -0.8 -0.7 1.3 0.8 0.3 -3.2
JAN 21 -1.8 -0.0 2.5 -0.7 -0.4 -0.1 -1.3 0.3 -1.6
DEC 20 -0.4 -0.8 1.0 --- 1.3 0.2 -1.1 2.3 0.1
NOV 20 2.5 0.0 0.7 -0.7 0.2 --- 0.1 -0.1 -0.6
OCT 20 -0.2 -0.2 -1.2 0.6 -1.1 --- -1.8 1.5 -1.0
SEP 20 1.1 1.9 -2.4 0.1 0.6 --- -0.9 -0.5 0.3
59
AUG 20 0.0 1.6 -0.2 -2.4 1.8 --- 0.6 -1.6 -0.5
JUL 20 -1.2 0.5 -0.5 -2.0 1.2 --- -0.7 -2.3 -0.1
JUN 20 0.2 -0.1 -1.2 -0.7 0.9 --- -2.0 0.6 -0.2
MAY 20 -0.3 0.1 0.1 0.0 0.3 --- -0.5 -2.4 -1.1
APR 20 -1.3 0.6 -1.3 1.5 -1.4 --- 1.8 -1.5 0.4
MAR 20 0.7 -0.1 1.3 0.4 -2.4 --- 0.6 -0.9 1.7
TABLE E1-Standardized amplitudes of selected Northern Hemisphere teleconnection patterns for the most recent thirteen months (computational procedures are described
in Fig. E7). Pattern names and abbreviations are North Atlantic Oscillation (NAO); East Atlantic pattern (EA);West Pacific pattern (WP); East Pacific - North Pacific
pattern (EP-NP); Pacific/North American pattern (PNA); Tropical/Northern Hemisphere pattern (TNH);East Atlantic/Western Russia pattern (EATL/WRUS-called
Eurasia-2 pattern by Barnston and Livezey, 1987, Mon. Wea. Rev., 115, 1083-1126); Scandanavia pattern (SCAND-called Eurasia-1 pattern by Barnston and Livezey
1987); and Polar Eurasia pattern (POLEUR). No value is plotted for calendar months in which the pattern does not appear as a leading mode.FIGURE E1. Surface temperature anomalies (°C, top) and surface temperature expressed as percentiles of the normal
(Gaussian) distribution fit to the 1981–2010 base period data (bottom) for MAR 2021. Analysis is based on sta-
tion data over land and on SST data over the oceans (top). Anomalies for station data are departures from the
1981–2010 base period means, while SST anomalies are departures from the 1981–2010 adjusted OI climatology.
(Smith and Reynolds 1998, J. Climate, 11, 3320-3323). Regions with insufficient data for analysis in both figures
are indicated by shading in the top figure only.
60FIGURE E2. Monthly global (top), Northern Hemisphere (middle), and Southern Hemisphere (bottom) surface tem-
perature anomalies (land only, °C) from January 1990 - present, computed as departures from the 1981–2010 base
period means.
61FIGURE E3. Anomalous precipitation (mm, top) and precipitation percentiles based on a Gamma distribution fit to the 1981–2010 base period data (bottom) for MAR 2021. Data are obtained from a merge of raingauge observations and satellite-derived precipitation estimates (Janowiak and Xie 1999, J. Climate, 12, 3335–3342). Contours are drawn at 200, 100, 50, 25, -25, -50, -100, and -200 mm in top panel. Percentiles are not plotted in regions where mean monthly precipitation is
FIGURE E4. Areal estimates of monthly mean precipitation amounts (mm, solid lines) and precipitation percentiles
   (%, bars) for the most recent 13 months obtained from a merge of raingauge observations and satellite-derived
   precipitation estimates (Janowiak and Xie 1999, J. Climate, 12, 3335–3342). The monthly precipitation climatol-
   ogy (mm, dashed lines) is from the 1981–2010 base period monthly means. Monthly percentiles are not shown
   if the monthly mean is less than 5 mm.

                                                        63
FIGURE E5. Areal estimates of monthly mean precipitation amounts (mm, solid lines) and precipitation percentiles
(%, bars) for the most recent 13 months obtained from a merge of raingauge observations and satellite-derived
precipitation estimates (Janowiak and Xie 1999, J. Climate, 12, 3335–3342). The monthly precipitation climatol-
ogy (mm, dashed lines) is from the 1981–2010 base period monthly means. Monthly percentiles are not shown
if the monthly mean is less than 5 mm.
6465
FIGURE E6. Observed precipitation (upper left), departure from average (upper right), percent of average (lower left), and average precipitation (lower right) for
MAR 2021. The units are given on each panel. Base period for averages is 1981–2010. Results are based on CPC’s U. S. daily precipitation analysis, which
is available at http://www.cpc.ncep.noaa.gov/prodcuts/precip/realtime.FIGURE E7. Standardized monthly Northern Hemisphere teleconnection indices. The teleconnection patterns are
calculated from a Rotated Principal Component Analysis (RPCA) applied to monthly standardized 500-hPa height
anomalies during the 1981-2010 base period. To obtain these patterns, ten leading un-rotated modes are first
calculated for each calendar month by using the monthly height anomaly fields for the three-month period cen-
tered on that month: [i.e., The July modes are calculated from the June, July, and August standardized monthly
anomalies]. A Varimax spatial rotation of the ten leading un-rotated modes for each calendar month results in
120 rotated modes (12 months x 10 modes per month) that yield ten primary teleconnection patterns.The tele-
connection indices are calculated by first projecting the standardized monthly anomalies onto the teleconnection
patterns corresponding to that month (eight or nine teleconnection patterns are seen in each calendar month).
The indices are then solved for simultaneously using a Least-Squares approach. In this approach, the indices
are the solution to the Least-Squares system of equations which explains the maximum spatial structure of the
observed height anomaly field during the month. The indices are then standardized for each pattern and calendar
month independently. No index value exists when the teleconnection pattern does not appear as one of the ten
leading rotated EOF’s valid for that month.
66FIGURE E8. Northern Hemisphere mean and anomalous sea level pressure (CDAS/Reanalysis) for MAR 2021. Mean
values are denoted by solid contours drawn at an interval of 4 hPa. Anomaly contour interval is 2 hPa with values
less (greater) than -2 hPa (2 hPa) indicated by dark (light) shading. Anomalies are calculated as departures from
the 1981-2010 base period monthly means.
67FIGURE E9. Northern Hemisphere mean and anomalous 500-hPa geopotential height (CDAS/Reanalysis) for MAR
2021. Mean heights are denoted by solid contours drawn at an interval of 6 dam. Anomaly contour interval is 3
dam with values less (greater) than -3 dam (3 dam) indicated by dark (light) shading. Anomalies are calculated as
departures from the 1981-2010 base period monthly means.
68FIGURE E10. Northern Hemisphere mean (left) and anomalous (right) 300-hPa vector wind (CDAS/Reanalysis) for
MAR 2021. Mean (anomaly) isotach contour interval is 10 (5) ms-1. Values greater than 30 ms-1 (left) and 10 ms-1
(rights) are shaded. Anomalies are departures from the 1981-2010 base period monthly means.
69FIGURE E11. Northern Hemisphere percentage of days during MAR 2021 in which 500-hPa height anomalies greater
than 15 m (red) and less than -15 m (blue) were observed. Values greater than 70% are shaded and contour interval
70FIGURE E12. Northern Hemisphere: Daily 500-hPa height anomalies for MAR 2021 averaged over the 5° latitude
band centered on 40°N. Positive values are indicated by solid contours and dark shading. Negative values are
indicated by dashed coutours and light shading. Contour interval is 60 m. Anomalies are departures from the
1981-2010 base period daily means.
71FIGURE E13. Northern Hemisphere 500-hPa heights (thick contours, interval is 6 dam) overlaid with (Top) Standard
deviation of 10-day high-pass (HP) filtered height anomalies and (Bottom) Normalized anomalous variance of
10-day HP filtered height anomalies. A Lanczos filter is used to calculate the HP filtered anomalies. Anomalies are
departures from the 1981-2010 daily means.
72FIGURE E14. Southern Hemisphere mean and anomalous sea level pressure(CDAS/Reanalysis) for MAR 2021. Mean
values are denoted by solid contours drawn at an interval of 4 hPa. Anomaly contour interval is 2 hPa with values
less (greater) than -2 hPa (2 hPa) indicated by dark (light) shading. Anomalies are calculated as departures from
the 1981-2010 base period monthly means.
73FIGURE E15. Southern Hemisphere mean and anomalous 500-hPa geopotential height (CDAS/Reanalysis) for MAR
2021. Mean heights are denoted by solid contours drawn at an interval of 6 dam. Anomaly contour interval is 3
dam with values less (greater) than -3 dam (3 dam) indicated by dark (light) shading. Anomalies are calculated as
departures from the 1981-2010 base period monthly means.
74FIGURE E16. Southern Hemisphere mean (left) and anomalous (right) 300-hPa vector wind (CDAS/Reanalysis) for
MAR 2021. Mean (anomaly) isotach contour interval is 10 (5) ms-1. Values greater than 30 ms-1 (left) and 10 ms-1
(rights) are shaded. Anomalies are departures from the 1981-2010 base period monthly means.
75FIGURE E17. Southern Hemisphere percentage of days during MAR 2021 in which 500-hPa height anomalies greater
than 15 m (red) and less than -15 m (blue) were observed. Values greater than 70% are shaded and contour interval
76FIGURE E18. Southern Hemisphere: Daily 500-hPa height anomalies for MAR 2021 averaged over the 5° latitude
band centered on 40°S. Positive values are indicated by solid contours and dark shading. Negative values are
indicated by dashed coutours and light shading. Contour interval is 60 m. Anomalies are departures from the
1981-2010 base period daily means.
77FIGURE S1. Stratospheric height anomalies (m) at selected levels for MAR 2021. Positive values are indicated by
solid contours and dark shading. Negative values are indicated by dashed contours and light shading. Contour
interval is 60 m. Anomalies are calculated from the 1981-2010 base period means. Winter Hemisphere is shown.
78FIGURE S2. Height-longitude sections during MAR 2021 for height anomalies (contour) and temperature anomalies
(shaded). In both panels, positive values are indicated by solid contours and dark shading, while negative anoma-
lies are indicated by dashed contours and light shading. Contour interval for height anomalies is 60 m and for
temperature anomalies is 2°C. Anomalies are calculated from the 1981-2010 base period monthly means. Winter
Hemisphere is shown.
7950hPa JFM Mean Temperature Anomalies
Temperature Anomaly (C)
10
5
0
-5
65N to 90N
-10
79 80 81 82 83 84 85 86 87 88 89 90 91 92 93 94 95 96 97 98 99 00 01 02 03 04 05 06 07 08 09 10 11 12 13 14 15 16 17 18 19 20 21 22
Temperature Anomaly (C)
4
2
0
-2
25N to 65N
-4
79 80 81 82 83 84 85 86 87 88 89 90 91 92 93 94 95 96 97 98 99 00 01 02 03 04 05 06 07 08 09 10 11 12 13 14 15 16 17 18 19 20 21 22
Temperature Anomaly (C)
4
2
0
-2
25S to 25N
-4
79 80 81 82 83 84 85 86 87 88 89 90 91 92 93 94 95 96 97 98 99 00 01 02 03 04 05 06 07 08 09 10 11 12 13 14 15 16 17 18 19 20 21 22
Temperature Anomaly (C)
4
2
0
-2
65S to 25S
-4
79 80 81 82 83 84 85 86 87 88 89 90 91 92 93 94 95 96 97 98 99 00 01 02 03 04 05 06 07 08 09 10 11 12 13 14 15 16 17 18 19 20 21 22
Temperature Anomaly (C)
10
5
0
-5
90S to 65S
-10
FIGURE S3. Seasonal mean temperature anomalies at 50-hPa for the latitude bands 65°–90°N, 25°–65°N, 25°N–25°S,
25°–65°S, 65°–90°S. The seasonal mean is comprised of the most recent three months. Zonal anomalies are taken
from the mean of the entire data set.
80-15
Zonal Mean Temperature for 2020 & 2021 -5
-20 10 hPa 65N to 90N -10 10 hPa 65S to 90S
-15
-25
-20
-30
-25
TEMPERATURE (C)
-35 -30
TEMPERATURE (C)
-40 -35
-40
-45
-45
-50
-50
-55 -55
-60 -60
-65
-65
-70
-70
-75
-75 -80
-80 -85
Jan FebMar Apr May Jun Jul Aug Sep Oct Nov Dec Jan FebMar Apr May Jun Jul Aug Sep Oct Nov Dec Jan FebMar Apr May Jun Jul Aug Sep Oct Nov Dec Jan FebMar Apr May Jun Jul Aug Sep Oct Nov Dec
2020 2021 2020 2021
2020, 2021 79-18 Mean 79-18 Max 79-18 Min
10 15
5 2 hPa 65N to 90N 10 2 hPa 65S to 90S
0 5
-5 0
-10
-5
-15
TEMPERATURE (C)
TEMPERATURE (C)
-10
-20
-15
-25
-20
-30
-25
-35
-30
-40
-35
-45
-50 -40
-55 -45
-60 -50
-65 -55
Jan FebMar Apr May Jun Jul Aug Sep Oct Nov Dec Jan FebMar Apr May Jun Jul Aug Sep Oct Nov Dec Jan FebMar Apr May Jun Jul Aug Sep Oct Nov Dec Jan FebMar Apr May Jun Jul Aug Sep Oct Nov Dec
2020 2021 2020 2021
FIGURE S4. Daily mean temperatures at 10-hPa and 2-hPa (thick line) in the region 65°–90°N and 65°–90°S for
the past two years. Dashed line depicts the 1981-2010 base period daily mean. Thin solid lines depict the daily
extreme maximum and minimum temperatures.
81Monthly Mean Ozone Anomalies (%)
10
Percent Ozone Anomaly
5
0
-5
50N to 30N
-10
79 80 81 82 83 84 85 86 87 88 89 90 91 92 93 94 95 96 97 98 99 00 01 02 03 04 05 06 07 08 09 10 11 12 13 14 15 16 17 18 19 20 21 22
6
Percent Ozone Anomaly
4
2
0
-2
-4
25N to 10N
-6
79 80 81 82 83 84 85 86 87 88 89 90 91 92 93 94 95 96 97 98 99 00 01 02 03 04 05 06 07 08 09 10 11 12 13 14 15 16 17 18 19 20 21 22
6
Percent Ozone Anomaly
4
2
0
-2
-4
10N to 10S
-6
79 80 81 82 83 84 85 86 87 88 89 90 91 92 93 94 95 96 97 98 99 00 01 02 03 04 05 06 07 08 09 10 11 12 13 14 15 16 17 18 19 20 21 22
6
Percent Ozone Anomaly
4
2
0
-2
-4
10S to 25S
-6
79 80 81 82 83 84 85 86 87 88 89 90 91 92 93 94 95 96 97 98 99 00 01 02 03 04 05 06 07 08 09 10 11 12 13 14 15 16 17 18 19 20 21 22
10
Percent Ozone Anomaly
5
0
-5
30S to 50S
-10
79 80 81 82 83 84 85 86 87 88 89 90 91 92 93 94 95 96 97 98 99 00 01 02 03 04 05 06 07 08 09 10 11 12 13 14 15 16 17 18 19 20 21 22
FIGURE S5. Monthly ozone anomalies (percent) from the long term monthly means for five zones: 50N-30N (NH
mid-latitudes), 25N-10N (NH tropical surf zone), 10N-10S (Equatorial-QBO zone), 10S-25S (SH tropical surf
zone), and 30S-50S (SH mid-latitudes). The long term monthly means are determined from the entire data set
82MARCH PERCENT DIFF (2021 - AVG[79-86])
Northern Hemisphere
90E
120E
60
60E
150E
50
30E
40
180
30
EQ
150W
20
30W
10
120W
S-NPP v8
OMPS-NP OZONE
60W Pct Difference
0 MARCH 2021
90W ANALYSIS
0 10 20 30 40 50NO DATA BEYOND60 78
Southern Hemisphere
90W
60W
60
120W
30W
50
150W
40
0
30
180
30E
20
150E
10
60E
S-NPP v8
OMPS-NP OZONE
Pct Difference
120E MARCH 2021
0 90E ANALYSIS
0 10 20 30 40 50NO DATA BEYOND60 77
45
FIGURE S6. Northern (top) and Southern (bottom) Hemisphere total ozone anomaly (percent difference from monthly
mean for the period 1979-1986). The region near the winter pole has no SBUV/2 data.
83FIGURE S7. Daily vertical component of EP flux (which is proportional to the poleward transport of heat or upward
transport of potential energy by planetary wave) at 100 hPa averaged over (top) 30°N–90°N and (bottom) 30°S–90°S
for MAR 2021. The EP flux unit (kg m-1 s-2) has been scaled by multiplying a factor of the Brunt Vaisala frequency
divided by the Coriolis parameter and the radius of the earth. The letter ‘M’ indicates the current monthly mean
value and the letter ‘C’ indicates the climatological mean value. Additionally, the normalized departures from the
monthly climatological EP flux values are shown.
8440
OZONE HOLE AREA
35
2020 10-19 Mean 10-19 Range
30
Million Sq Km 25
20
15
10
5
0
August September October November December
40
SH VORTEX AREA
35
30
Million Sq Km
25
20
15
10
5
0
May June July August September October NovemberDecember
40
SH PSC AREA
35
30
25
Million Sq Km
20
15
10
5
0
May June July August September October NovemberDecember
FIGURE S8. Daily time series showing the size of the SH polar vortex (representing the area enclosed by the 32 PVU
contour on the 450K isentropic surface), and the areal coverage of temperatures < -78C on the 450K isentropic
surface.
85FIGURE A2.1. (a) Daily amplitudes of the Arctic Oscillation (AO) the North Atlantic Oscillation (NAO), and the Pacific-
North American (PNA) pattern. The pattern amplitudes for the AO, (NAO, PNA) are calculated by projecting the
daily 1000-hPa (500-hPa) height anomaly field onto the leading EOF obtained from standardized time- series of
daily 1000-hPa (500-hPa) height for all months of the year. The base period is 1981–2010.
(b-d) Northern Hemisphere mean and anomalous 500-hPa geopotential height (CDAS/Reanalysis) for selected
periods during MAR 2021 are shown in the remaining 3 panels. Mean heights are denoted by solid contours
drawn at an interval of 8 dam. Dark (light) shading corresponds to anomalies greater than 50 m (less than -50 m).
Anomalies are calculated as departures from the 1981-2010 base period daily means.
86You can also read