Monthly Commentary - June 2021 - BT Investment Solutions
←
→
Page content transcription
If your browser does not render page correctly, please read the page content below

BT Investment Solutions

Monthly Commentary -
June 2021
June started with the continuing outbreak of COVID-19                  For those that have lost less than 20 hours, the payment is $324,
in Melbourne and by the end of the month, Sydney was                   and for those who have lost 20 hours or more, the payment is
f eeling the f ull f orce of the Delta variant. The resulting          $500.
three-week lockdown has seen considerable pressure                     Early in the month global COVID-19 vaccinations reached 2
being placed on the domestic economy. Whilst the RBA                   billion doses, over 7.5 million of which were administered in
stayed f irm on its 0.10% cash rate at its June 1 meeting,             Australia. At the current pace, it is predicted that it will take nine
industry consensus is leaning f urther towards a pre-                  more months to vaccinate 75% of the world’s population, the
2024 rate hike, despite what has been indicated by the                 threshold some report as providing herd immunity.
RBA. Neighbouring China will allow couples to have a
third child to combat a f alling birth rate, whilst in Europe          Chart 1: Total COVID-19 Vaccines administered in Australia
consumer conf idence rose f rom -5.1 to -3.3 in June,
representing a return to pre-pandemic levels. Global
COVID-19 vaccinations reached 2 billion doses early in
the month.

Developments in the global economy

COVID-19 Update
In Australia, the start of the month saw Melbourne’s COVID-19
outbreak grow, with lockdowns being extended until June 10.
                                                                                                                  Source: Trading Economics
Concurrently, the Bondi cluster in Sydney continued to spread,
eventuating in a three-week lockdown until July 16. Other states
followed suit with their own lockdowns, including Western
                                                                       In other global COVID-19 news, the UK reported the most cases
Australia, the Northern Territory and Queensland, while South
                                                                       since January due to the Delta mutation, although Prime Minister
Australia implemented additional restrictions.
                                                                       Johnson said an end to restrictions is “very likely” to go ahead on
The outbreaks come largely as a result of the Delta variant, which     July 19. Hong Kong, Portugal and Spain subsequently imposed
Victorian Chief Health Officer Brett Sutton describes as moving
                                                                       new restrictions on British travellers.
“faster than any other strain”.
Sydney and its surrounding areas are home to around 6.6 million        Australia
people and the area represents approximately 25% of Australian
GDP. As a result, the current three-week lockdown is estimated         The remarkable economic recovery co ntinued in the March
to reduce national economic activity by around $2 billion (or 0.1%     quarter of 2021, with the Australian economy growing by a
of GDP). Compounding this loss, Perth’s four- day lockdown will        stronger than expected 1.8% for the quarter, beating consensus
cost another $200 million and Queensland’s three-day lockdown,         expectations for a rise of 1.5%. Economic activity has now
$300 million. This follows the $1.5 billion hit caused by Victoria’s   recovered to its pre-pandemic levels, with the economy now 0.8%
two-week lockdown in late May.                                         bigger than it was before the pandemic. Australia represents one
                                                                       of only a few countries around the world that have already
Continuing in Australia, the AstraZeneca vaccine will now only be
                                                                       recovered the ouput lost as a result of COVID-19. Leading the
recommended by the Therapeutic Goods Adminitration (TGA) for
                                                                       charge in this recovery was consumer spending, which continued
people aged 60 and over, up from the previous recommendation
                                                                       to underpin economic activity in the March quarter. Falling
of people aged 50+. However, in news released at the end of the
                                                                       unemployment, low interest rates, and elevated confidence
month, adults of all ages in Australia may request the
                                                                       asistsed with this economic bounce back.
AstraZeneca jab from GPs. Notably, it was also confirmed that
come September all aged care workers must have received at
least one dose of the vaccine.
For those in the NSW lockdown, the COVID-19 disaster relief
payment is available to those who are eligible. It is a one-off
payment for workers who are unable to work due to COVID-19.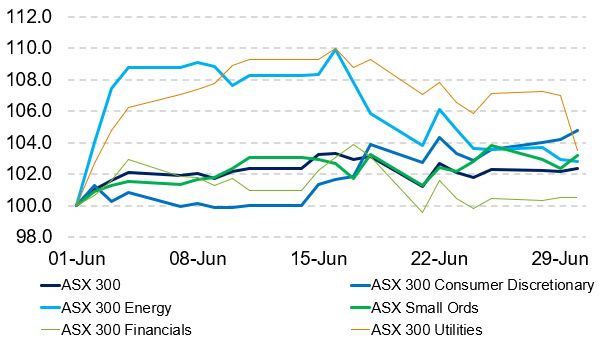
The RBA met at the outset of the month but left policy settings        Job data released during June was nothing short of amazing, with
unchanged. Despite this, over the course of the month, industry        jobs surging by 115.2k in May, well above the consensus forecast
consensus tended increasingly in favour of the cash rate hiking        of 30.0k. What is even more remarkable is that job gains over the
before 2024. Minutes released from the June 1 RBA meeting              twelve months to May summed to 987.2k, the best on record.
reaffirmed expectations that the 3-year yield target under the         Unemployment fell 0.4% to 5.1%, the lowest rate since December
yield curve control (YCC) will not be rolled to the November 2021      2019. This makes it even more likely that the unemployment rate
bond and that quantiative easing (QE) will transition to an open-      will have a ‘4’ in front this year and hit full employment in the
ended, flexible model.                                                 middle of next year, which will generate wage and inflation
Consumer sentiment declined by 5.2% to 107.2 in June,                  pressures.
according to the latest Melbourne Institute and Westpac surveys.       Total household wealth rose 4.3% in the March quarter to reach
This decline likely reflects some impact from the two -week            a new record. Over the year, growth was 15.3% - the strongest
lockdown in Melbourne, which may only be further exacerbated           growth in 11 years. Wealth per capita also rose to a record high
by the current Sydney lockdown. This decline, however, is              of $492,055. The continued growth has been driven by higher
coming off an 11-year high in April. Notably, sentimen t remains       residential property prices, support from government incentives
high and well above its long -run average.                             and a recovery in the labour market.

Chart 2: Australian Consumer Confidence                                United States
                                                                       In the US, the ADP jobs report showed 978k jobs were added in
                                                                       May, well above the 650k expected and the largest increase
                                                                       since June 2020. The unemployment rate rose conservatively in
                                                                       June to 5.9% from 5.8% in May, however it remains elevated
                                                                       relative to its pre-pandemic levels of around 3.5%.

                                                                       Chart 4: US Unemployment Rate

                                           Source: Trading Economics

During the month, the Fair Work Commission (FWC) raised the
minimum wage by 2.5%, representing more than double the rate
of inflation. This will increase the hourly rate of more than 2.2
million workers from $19.84 to $20.33. The FWC said the
decision followed the economy’s stronger-than-expected
economic recovery.                                                                                               Source: Trading Economics

In other data released during the month, the house price index         Amid other signs the labour market continues to gradually
published by the ABS rose 5.4% in the March quarter, following         recover, mid-June saw a downward trend in workers filing for
a rise of 3.0% in the December quarter.                                unemployment benefits. Initial jobless claims, a proxy for layoffs,
                                                                       moved lower in the middle of the month to 411,000 from an
Chart 3: Australia House Price Index QoQ                               upwardly revised 418,000 the prior week, when claims rose. The
                                                                       4-week moving average for claims, which smooths out volatility
                                                                       in the weekly figures, rose slightly off a pandemic low to 397,750.
                                                                       While these initial jobless claims were higher than projected and
                                                                       claims overall remain above pre-pandemic levels, their downward
                                                                       trajectory, along with a pickup in hiring, a falling unemployment
                                                                       rate and elevated consumer confidence, points to an improving
                                                                       labour market.
                                                                       President Biden reportedly proposed a corporate tax floor of 15%,
                                                                       setting aside an earlier plan to raise them as high as 28%, which
                                                                       was unpopular with Republicans. During the month, Biden was
                                           Source: Trading Economics
                                                                       also able to reach an agreement with a bipartisan group of
Annually, house prices rose 7.5%. The strong demand for                senators on a $579 billion infrastructure plan. The bill will move
housing was supported by record low interest rates, government         in tandem with a much larger package of spending and tax
initiatives like the HomeBuilder Scheme, and elevated consumer         increases that Republicans oppose and of course passage of this
confidence. Across all states, Sydney had the highest increase in      bill is not assured.
prices in the quarter with a 6.1% gain, followed by Melbourne and
Brisbane, which rose 5.1% and 4.0%, respectively.

2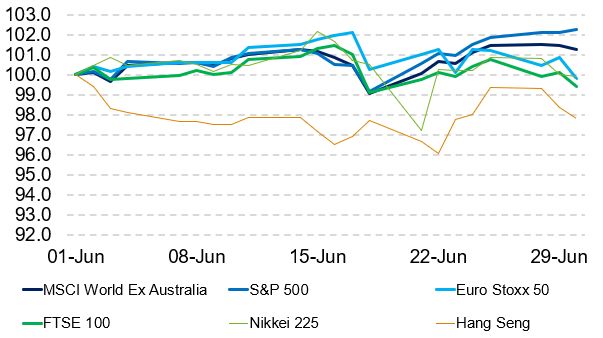
The University of Michigan survey showed that consumer                 Chart 5: Japan Retail Sales MoM
sentiment slipped in the second half of June, remaining at
subdued levels. The final reading of the index of consumer
sentiment was 85.5 in June, down from the preliminary reading
mid-month of 86.4 and below consensus expectations that
centred on an outcome of 86.5.
The Dallas Fed manufacturing index remained in expansionary
territory. General business activity declined from 34.9 to 31.1, but
production, new orders and prices paid indices all rose.
The US Federal Reserve (FED) moved markets this month after
the Chair, Jerome Powell, said that the central bank had begun
discussing a slowing of the bank’s US$120 billion per month bond       Source: Trading Economics
buying program. At the June 15-16 meeting the FED Market
Committee left its target range for the federal funds rate             Europe
unchanged at 0-0.25 per cent.
                                                                       During the month, the European Central Bank (ECB) left policy
                                                                       settings unchanged, as expected. Over the coming quarter, the
Asia                                                                   ECB expects net purchases under the pandemic emergency
China will allow couples to have a third child to boost the nation’s   purchase program to continue to be conducted at a significantly
falling birth rate. This comes despite 2016 reforms which allowed      higher pace than during the first few months of the year. In other
second children but did little to reverse the declining birth rate.    news, the ECB raised its GDP forecasts for 2021 and 2022 and
                                                                       had a more balanced view on risks to the economic outlook.
Tensions between Australia and China continue as China seeks
                                                                       However, the central bank is still forecasting 1.4% p/a inflation in
World Trade Organisation (WTO) rulings on the alleged dumping
                                                                       2023, which is well below the 2% target and suggests that policy
of goods by Australia.
                                                                       will remain accommodative for some time yet.
In May, China’s manufacturing sector expanded at the fastest
                                                                       Eurozone inflation dropped conservatively to 1.9% p/a, down
pace in five months, despite the surge in prices for raw materials.
                                                                       from 2.0% p/a in May.
The Caixin manufacturing PMI rose modestly in May to 52.0, from
51.9 in April.                                                         In reports released during the month, the unemployment rate in
                                                                       the Euro area fell 0.2%to 7.9% in May down from 8.1% in both
China’s trade surplus widened to US$45.5 billion in May, as
                                                                       March and April.
imports grew faster than exports. Exports rose 27.9% from a year
earlier, fuelled by strong global demand as the UK and US both         As infection rates fell and restrictions eased in the Eurozone,
emerged from months of lockdown, fuelling consumer spending.           consumer confidence increased, up from -5.1 to -3.3 in June.
Imports grew 51.1% in the year to May, the fastest pace in 10          Confidence is now well above its pre-pandemic level.
years. The increase was largely due to the rise in commodity           Chart 6: Eurozone Consumer Confidence
prices. Aggregate financing was 1.92 trillion Yuan in May, up from
1.85 trillion Yuan in April, broadly in line with expectations.
The Bank of Japan maintained its policy settings in June, as
widely expected. The short-term policy rate and 10-year
government bond yield target remained unchanged at 0.1% and
0.0%, respectively. The central bank decided to extend its
pandemic relief prog ram by 6 months from September 2021 to
March 2022 and announced a new back-financing program for
climate change. The program aims to commence by the end of
the year. Retail sales in Japan contracted 4.6% in April,
compared to a 1.2% increase in March, larg ely due to ongoing                                                    Source: Trading Economics
COVID-19 restrictions. Over the year, retail sales rose 12%
reflecting base effects from a sharp decline in spending following     The Eurozone PMI rose from 64.4 in May to 64.9 in June with the
the onset of the pandemic.                                             services PMI rising from 55.2 to 58.0 and the composite index
                                                                       lifting to a record high of 59.2.
                                                                       Over in the UK and the GfK Consumer Confidence Barometer
                                                                       remained at -9 in June, unchanged from May and matching pre-
                                                                       pandemic levels. Consumer confidence may weaken as the
                                                                       country continues its post COVID recovery, with expectations that
                                                                       retail price inflation will rise.

3
Chart 7: UK Consumer Confidence International shares
Despite building inflationary pressures, global markets mostly
increased over June. Tech mega caps lifted during the month with
Microsoft up (+2.8%) and Apple up (+1.2%). Despite a sharp fall
in the US after the FED’s mid-month meeting which signalled two
potential interest rate hikes in 2023, reversals at the end of the
month returned US markets into positive territory. End of month
saw a mixed bag in global share markets, affected by end -of-
month and end -of-quarter squaring, compounding with concerns
mounting around increased COVID-19 infections attributable to
the rising Delta variant.
Source: Trading Economics
The MSCI World ex Australia Unhedged index ended the month
By the end of the month, the FTSE 100 fell 0.9% after up +4.71%. The S&P ended the month up +2.33%, the NASDAQ
governments from Europe to Asia imposed new limits on travel finished up +5.55%, as did Dow Jones up just 0.02%. The
from Britain following a spike in COVID-19 cases. respective 1 year returns on the three US markets are +40.79%,
+45.23% and +36.34%. European shares were similar, the Euro
The average asking price for a home in the UK grew 0.8% in June
STOXX up +1.36%. France’s CAC 40 and Germany’s DAX Index
to a new record high, with buyer demand remaining strong whilst
ended up +0.94% and +0.71%, respectively. With the 1 year
property availability was low.
returns on these respective markets being +25.67%, +31.84% and
+26.16%.
World Asian share markets saw a mix of returns over June. Japan’s
The Group of Seven (G7) nations reached a landmark deal in Nikkei saw a conservative dip , ending -0.08% return over the
June to impose a minimum corporate tax rate of at least 15% on month, with 1 year returns of +31.26%. China’s Shanghai
foreign earnings. The rules could help states collect tax from Composite finished the month down -0.67% and the Hang Seng
digital (or technology) companies based on where they make was down -1.11%. The Korean KOSPI increased from May,
money instead of purely where they are headquartered. G7 ending up +2.90%, bringing its one-year return to +56.36%.
leaders also debated their responses to China’s continued effort Chart 11: Major Market Indices (rebased to 100)
to win influence around the world as well as rebuking the nation
for its alleged forced labour practices.
Developments in financial markets
Australian shares
June saw another month of strong returns for the Australian Share
market, continuing the strong rally of CY 2021 and regaining
losses caused by the pandemic. The ASX300 Accumulation
returned +2.25%, while the ASX Small Ordinaries Accumulation
gained +3.08% over the month. The one year returns on these
respective indices is +28.49% and +33.23%. The market was led
by strong performance in the Information Technology sector which
Source: BTIS/Bloomberg
ended the month up (+11.32%). The Utilities and Consumer
Discretionary sectors also did well, ending up ( +3.14%) and Fixed interest
(+4.20%), respectively. The Financials sector struggled over the Over June, the 10-year US Treasury yield increased by eight basis
month, ending down (-0.74%). points to 1.52%, whilst the US FED left its target range for the
Chart 10: Australian Shares (rebased to 100) federal funds rate unchanged at 0-0.25%. Across the pond and
the Bank of England kept its monetary policy stable at 0.1%, with
the RBA keeping its cash rate and three-year government bond
target intact at 0.10% at its June 1 meeting. Despite this, doubt is
cast upon the RBA’s assertion that it will wait until 2024 to raise
the cash rate; this comes after data released during the month
showed Australian jobs surged in May and unemployment fell to
pre-COVID-19 levels.
The Bloomberg AusBond Composite (0+Y) index ending up
+0.69% up from +0.27% in May. For international fixed interest
markets, the Barclays Global Aggregate TR Hedged index ’s one-
month number closed at +0.49%. The 10-year Treasury bond
yields in Australia finishing the month at +1.51%, while the US
ended at +1.47%.
Source: BTIS/Bloomberg
4Currencies
The end of the financial year saw the AUD slip below 75 US cents,
down by -3.05% from May, ending the month at 0.7498. With the
market focused on labour market performance and US monetary
policy, the AUD remains vulnerable in the near term, with an
extended break below 0.75 looking likely.
Additionally, the Euro is also down from April at -3.02% against
the USD, ending May at 1.1858. Moreover, the GBP ended down
-2.38% to 1.3831.
The People’s Bank of China took steps to restrict the Yuan’s
appreciation by increasing the reserve ratio required for banks’
foreign-currency deposits from June 15. This decision underlines
the authorities’ determination to stabilise currency. The change
caused offshore Yuan to weaken slightly.
Chart 12: Major Currencies (rebased to 100)
Source: BTIS/Bloomberg
Commodities
Key major commodities had another strong month as economies
around the world continue to reopen. The short-term supply
impact of the shut down to the colonial pipeline in May cleared
through the system. As the US enter into the warmer months, we
do expect to see a higher demand for oil (petrol) as we see a return
to the summer driving season. Oil increased in May with Brent
Crude oil finishing the month at +8.38% to US$75.13 while WTI
Oil performed even better, up +10.78% to US$73.47. The potential
for sanctions to be lifted against Iran could see more oil flow into
the global supply, which may create downward price pressure.
Iron Ore also continued its upward trajectory of the last 12 months,
ending the month up +5.01% to US$210.98. Iron ore is now up
+115.26% over the last 12 months. Gold fell, ending the month
down -7.17% to US $1770.11. The Bloomberg Commodity Index
reported a gain of +1.85% up to 94.5412.
Chart 13: Major Commodities (rebased to 100)
Source: BTIS/Bloomberg
5June 2021 Market Data
Australian shares 1 Month 3 Months 1 Year 3 Years 5 Years
S&P/ASX 300 Accumulation 2.25% 8.48% 28.49% 9.77% 11.26%
S&P/ASX 300 Industrials Accumulation 2.78% 8.66% 27.93% 9.27% 9.67%
S&P/ASX 300 Resources Accumulation 0.22% 7.80% 30.52% 11.76% 18.95%
S&P/ASX 300 Accumulation A-REIT 5.56% 10.74% 33.91% 8.23% 6.25%
S&P/ASX Small Ords Accumulation 3.08% 8.50% 33.23% 8.60% 11.24%
Global shares 1 Month 3 Months 1 Year 3 Years 5 Years
MSCI World ex Australia Unhedged in
4.71% 9.33% 27.50% 14.50% 14.73%
$A
EPRA/NAREIT Developed Index Hedged
1.76% 9.03% 30.19% 4.93% 4.68%
A$
STOXX Europe 600 Total Return 1.36% 5.41% 25.67% 6.03% 6.54%
S&P 500 Total Return 2.33% 8.55% 40.79% 18.67% 17.65%
Nikkei 225 Total Return -0.08% -1.17% 31.26% 11.03% 15.28%
Fixed interest 1 Month 3 Months 1 Year 3 Years 5 Years
Bloomberg AusBond Bank Bill Index 0.00% 0.01% 0.06% 0.96% 1.29%
Bloomberg AusBond Composite (0+Y) 0.69% 1.52% -0.84% 4.22% 3.19%
Barclays Global Aggregate TR Hedged
0.49% 0.94% -0.17% 4.03% 2.87%
A$
Month End
Commodities 1 Month 3 Months 1 Year 3 Years 5 Years
Price
Bloomberg Commodity Index 94.5412 1.85% 13.30% 45.50% 2.65% 1.25%
Generic Brent Crude Oil 75.13 8.38% 18.24% 82.58% -1.84% 8.62%
Generic WTI Crude Oil 73.47 10.78% 24.19% 87.09% -0.31% 8.74%
Gold US$/oz 1770.11 -7.17% 3.65% -0.61% 12.22% 6.01%
Iron Ore 210.98 5.01% 36.79% 115.26% 51.70% 31.53%
Month End
Currencies 1 Month 3 Months 1 Year 3 Years 5 Years
Price
AUD/USD 0.7498 -3.05% -1.32% 8.62% 0.42% 0.13%
EUR/USD 1.1858 -3.02% 1.09% 5.55% 0.49% 1.32%
USD/JPY 111.11 1.40% 0.35% 2.95% 0.11% 1.49%
GBP/USD 1.3831 -2.68% 0.35% 11.53% 1.55% 0.77%For more information bt.com.au | 132 135 | GPO Box 2861 Adelaide SA 5001 Disclaimer This document has been created by Westpac Financial Services Limited (ABN 20 000 241 127, AFSL 233716). It provides an overview or summary only and it should not be considered a comprehensive statement on any matter or relied upon as such. This information has been prepared without taking account of your objectives, financial situation or needs. Because of this, you should, before acting on this information, consider its appropriateness, having regard to your objectives, financial situation and needs. Projections given above are predicative in character. Whilst every effort has been taken to ensure that the assumptions on which the projections are based are reasonable, the projections may be based on incorrect assumptions or may not consider known or unknown risks and uncertainties. The results ultimately achieved may differ materially from these projections. This document may contain material provided by third parties derived from sources believed to be accurate at its issue date. While such material is pub lished with necessary permission, Westpac Financial Services Limited does not accept any responsibility for the accuracy or completeness of or endo rses any such material. Except where contrary to law, Westpac Financial Services Limited intends by this notic e to exclude liability for this material. The responsible entity for the Multi-Blend Funds named in this document (Advance Funds) is Advance Asset Management Limited ABN 98 002 538 329 AFSL 240902. A Product Disclosure Statement or other disclosure document (PDS) for the Advance Funds can be obtained by contacting BT on 132 135 or by visiting http://www.advance.com.au. You should obtain and consider the relevant PDS before deciding whether to acquire, continue to hold or dispose of interests in the Advance Funds. An investment in an Advance Fund does not represent an investment in, deposit with, or other liability of Westpac Banking Corporation ABN 33 007 457 141 AFSL and Australian credit licence 233714 (Westpac) or any other member of the Westpac Group. It is subject to investment risk, including possible delays in the payment of withdrawals and loss of income or capital invested. No member of the Westpac Group (including Advance) stands behind or otherwise guarantees the capital value or performance of the Advance Funds. Past performance is not a reliable indicator of future performance . Information current as at 8 July 2021. © Westpac Financial Services Limited 2019
You can also read