Corrosion Behavior of Cast Iron in the Presence of Acidithiobacillus Ferrooxidans
←
→
Page content transcription
If your browser does not render page correctly, please read the page content below
Int. J. Electrochem. Sci., 16 (2021) 210236, doi: 10.20964/2021.02.19

                                                                          International Journal of
                                                                          ELECTROCHEMICAL
                                                                                  SCIENCE
                                                                                 www.electrochemsci.org

Corrosion Behavior of Cast Iron in the Presence of
Acidithiobacillus Ferrooxidans
Li Lin1,2,4, Cheng Liu2,4, Lei Fu3, Ying Zeng1,*, Min Gong2,4,**, Xue jun Cui2,4, Junchen Meng2,4, Xin jie
Huang3
1
  College of Materials and Chemistry and Chemical Engineering, Chengdu University of Technology,
Chengdu 610059, China
2
  Key Laboratory of Material Corrosion and Protection of Sichuan Province, Zigong 643000, China
3
  School of Mechanical Engineering, Sichuan University of Science & Engineering, Zigong 643000,
China
4
  School of Material Science and Engineering, Sichuan University of Science & Engineering, Zigong
643000, China
*
 E-mail: zengy@cdut.edu.cn
**
  E-mail: gongmin@suse.edu.cn

Received: 1 October 2020 / Accepted: 28 November 2020 / Published: 31 December 2020

Ferrooxidans bacteria occur widely in acid mine drainage water. This work examined the corrosion
behavior of cast iron in the presence of the acidophilic iron-oxidizing bacterium Acidithiobacillus
ferrooxidans (T.f). Results showed this bacterium accelerated corrosion of cast iron by a factor of two
compared with that of acidic (pH 2) water. This bacterium oxidizes ferrous ions to ferric ions as a
source of energy and the produced ferric ions is quickly hydrolyzed to generate hydrogen ions, which
partly offsets that consumed in the corrosion reaction. Besides, pitting was found on the cast iron
surface in culture medium containing Acidithiobacillus ferrooxidans.

Keywords: Cast iron; MIC; Weight loss; morphology; EIS

1. INTRODUCTION

        Iron-oxidizing bacteria (IOB) and iron-reducing bacteria (IRB) are widespread in nature. As
electron donors and acceptors, respectively, IOB and IRB exerted primary controls on the redox-
induced cycling of iron in the environment by using Fe2+ and Fe3+ bound in solid-phase iron minerals
[1-3]. IRB were capable of completely removing previously formed rusting on the surface of carbon
steel coupons using Fe3+ ions as electron acceptors [4]. Bioaugmentation with IRB was an effective
method to enhance the activity of iron reduction [5]. In particular, Pseudomonas (an IOB) was found
Int. J. Electrochem. Sci., Vol. 16, 2021 2
to inhibit corrosion of Q235 carbon steel in a magneticfield [6]. The metabolic products of
Pseudomonas and some coatings were found to have a corrosion inhibition [7-9].
T.f is an IOB. It is an important industrial microorganism that was first discovered by Colmer
and Hinkle in 1947 in coal mine wastewater and found to promote the oxidation of pyrite in a coal
mining environment [10]. T.f is Gram-negative. It has characteristics of chemical autotrophy, is aerobic
and acidophilic and is suitable for use in a medium-temperature environment. T.f is able to capitalize
on Fe2+ as an electron donor and oxidize ferrous to ferric ions, which can couple with the generation of
nicotinamide dehydrogenase (NADPH) and the synthesis of adenosine triphosphate (ATP) to provide
energy to cells [11]. It was shown by starvation experiments that bacteria could obtain energy by
extracellular electron transfer, too [12].
The step enabled biological oxidation to proceed smoothly.
Cell Wall
Rusticyanin Cytochrome C Cytochrome A Periplasm
Cytomembrane
2Fe3+
H 2O
1
2e- O2 +2 H ADP +Pi Cytoplasm
2
2H +
2Fe 2+ ATP
H2
F0F1ATP ase Proton Pump 2H +
2H +
Fe
Figure 1. Schematic diagram of electron transfer in cells
Many scholars have studied the biological oxidation of ferrous sulfate by T.f [13-16]. Electrons
from the bacterial outer membrane are transported to cytochrome c in the periplasm through
rusticyanin; the reduced cytochrome c binds to the cell membrane and then passes electrons to
cytochrome a. Reduced cytochrome a then releases electrons to oxygen molecules to generate water.
The possible process of electron in the biological oxidation chain is summarized as follows:
e rusticyanin cytochrome c cytochrome a O2 O2- H2O.
Energy is released in each step of this electron-transfer process, which provides for the growth
of T.f and generation of NADPH (reduction of coenzyme II, which is involved in the electron-transfer
chain). In this process, ferrous ions react in an acid solution containing T.f as follow:Int. J. Electrochem. Sci., Vol. 16, 2021 3
(1)
the pH initially increases because ferrous oxidation is accompanied by the consumption of H + when T.f
is grown in ferrous sulfate solution [17]; ferric ions are hydrolyzed to produce acid, which lowers the
pH.
Fe3+ + H2O FeOH2+ + H+ (2)
Fe3+ + 2H2O Fe(OH)2+ + 2H+ (3)
Fe3+ + 3H2O Fe(OH)3 + 3H+ (4)
T.f is widely used for desulfurization, bioleaching, and treatment of wastewater and heavy
metal sludge due to its ability to oxidize ferrous ions and sulfides. Rai desulphurized coal containing
2% ~ 8% sulfur using T.f, and found that 80%~85% of pyritic sulfur could be effectively removed
[18]. Yang et al. found that the presence of T.f was conducive to improving Ni yield, shortening
leaching time, and reducing costs in the bioleaching of pentlandite: a Ni leaching extent of 83.8% was
obtained after 5 days [19]. Torma et al. studied the bioleaching of stibnite, and the results showed that
the biooxidation rate of stibnite more than doubled in the presence of T.f [20]. Kaewkannetra et al.
investigated bioleaching of zinc from a 12% zinc-bearing gold deposit in Thailand, and showed that
the leaching rate was greatly improved by the presence of this bacterium [21]. Wood et al.
immobilized T.f on sand, designed a continuous process, and demonstrated that it worked well in the
repeated treatment of acid mine-drainage [22]. Gόmez et al. utilized T.f to extract 80% of the heavy
metals(cadmium, cobalt, copper, and zinc) present in a rainwater sludge, and found that bioleaching
had a certain remediation effect on heavy metal-contaminated soil [23].
T.f resulted in a greater dissolution of silica and a higher silicide corrosion rate [24]. The
corrosion behavior of mild steel C1010 was studied in the environment containing this IOB. Results
showed that T.f accelerated mild steel C1010 corrosion by a factor of 3–6 times that of acidic water at
pH 2 [25]. Pisapia et al. found that T.f aggravated pitting corrosion of pyrite [26]. Corrosion pits were
found on the surface after 10CrNiCu steel had been immersed in the existing T.f bacterial system for
21 days, whereas no pitting resulted after immersion for the same time in a sterile system [27]. Some
anaerobic bacteria also caused serious corrosion of steel materials, such as sulfate-reducing bacteria
(SRB) [28-31].
T.f, widely presented in acidic mine drainage could oxidize ferrous to ferric ion. In this study,
the corrosion behavior of cast iron was studied by using different characterization methods, such as
weight loss, scanning electron microscopy (SEM), open-circuit potential (OCP) and electrochemical
impedance spectroscopy (EIS). Electrochemical measurements were used for the first time to
investigate the corrosion of cast iron in an environment that contained T.f. Changes in the Ecor and EIS
of the cast iron were obtained from electrochemical tests, and the electron transfer of cast iron was
discussed. Local corrosion and crevice corrosion of cast iron was analyzed. The corrosion behavior
and mechanism of microbiologically induced corrosion (MIC) was discussed in the hope that
innovative pipeline materials and corrosion inhibitors could be created and the service life of iron-
based equipments could be prolonged.Int. J. Electrochem. Sci., Vol. 16, 2021 4
2. EXPERIMENTAL SECTION
2.1 Materials
Cast iron was used in the experiment, and its composition was listed in Table 1.
Table 1. Composition of cast iron (wt%)
elements C Si Mn P S Mg Fe
content 3.6-3.9 1.8-2.4 0.25-0.4Int. J. Electrochem. Sci., Vol. 16, 2021 5
remained unchanged when it was cultivated in the sterile system. Burnished coupons were placed in
the two solution systems. Each experimental group contained three large and two small coupons,
which were incubated under the same conditions (30℃ and 100 rpm/min).
2.3 Analysis of corrosion morphology
Each group of coupons was immersed in the culture medium for a predetermined time and then
removed. After freeze-drying, the morphology of the coupon products was observed by SEM (VegaIII,
TESCAN, CZ). The corrosion products were then thoroughly removed to observe the morphology of
the corrosion pits on the sample surface.
2.4 Electrochemical measurement
The electrochemical tests were conducted by using a potentiostat (Solartron SI 1287+ Solartron
SI 1260, AMETEK, UK). A three-electrode system was used, which consisted of a polished cast iron
sample, a saturate calomel electrode (SCE) and a platinum foil as the working electrode, reference
electrode and auxiliary electrode, respectively. The electrochemical experiments were controlled by
using Zplot and Corrware software.
The OCP and EIS of the working electrodes immersed in the sterile and T.f systems were
measured for different contact time. EIS was measured at the self-etching potential. The excitation
signal was a 5mV sine wave and the test frequency range was 10 mHz-100 kHz. The EIS results were
fitted by ZSimpWin software.
3. RESULTS AND DISCUSSION
3.1 Corrosion weight loss
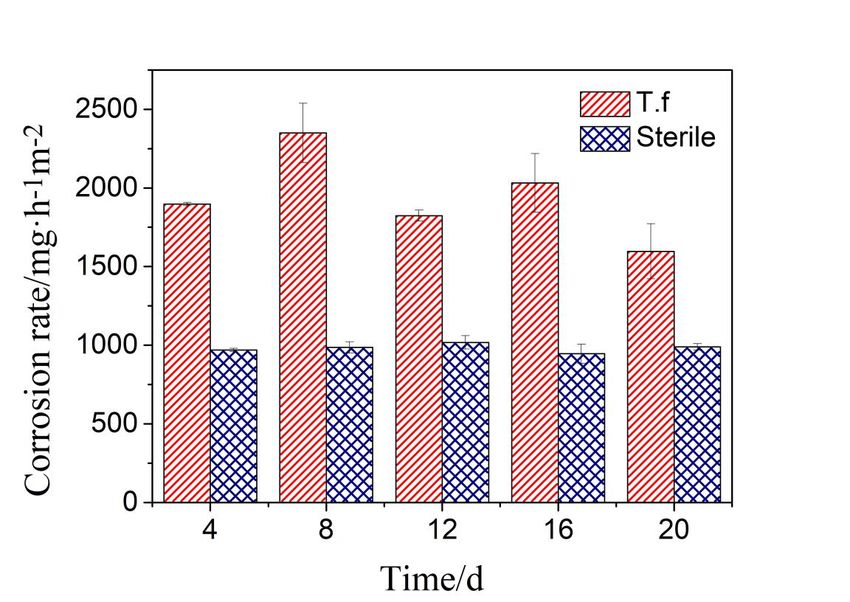
The average corrosion rates of cast iron immersed in the sterile and T.f systems were calculated
based on weight loss method after immersion for 4, 8, 12, 16, and 20 days. The sterile liquid and T. f
medium were replaced every 4 days.
The results in Fig. 2 showed that the corrosion weight losses of T.f and sterile systems differed
significantly: that of the T.f system was about twice that of the sterile system, indicating that the T.f
strain grew steadily in the bacterial liquid and played an oxidation role. Ferrous iron was oxidized to
ferric iron, and hydrogen ions were hydrolyzed by the continuous consumption of ferric iron. Ferric
iron hydrolyzed easily to form hydrogen ions according to Equations (2-4). According to the principles
of chemical equilibrium, ferrous iron continued to lose electrons to form ferric iron in the bacterial
system, so the reaction of iron dissolution to form ferrous iron continued, resulting in increased
corrosion of the cast iron coupons. Two kinds of electron transfer mediators, flavin adenine
dinucleotide (FAD) and riboflavin, accelerated considerably pitting of C1018 steel in P. aeruginosa
[33]. These results resulted from electron transfer.Int. J. Electrochem. Sci., Vol. 16, 2021 6
Figure 2. Corrosion rates of cast iron coupons exposed in T.f and sterile cultures for different days
3.2 pH value
The coupons reacted in acidic solution to yield hydrogen gas, so the pH increased owing to the
consumption of H+.
Fe + 2H+ Fe2+ + H2 (5)
The evolution of small bubbles was observed during the experiment. Owing to the oxidation of
T.f, ferrous iron was converted to ferric, the hydrolysis of which produced acid, which, in turn, led to
continuous reaction and increasing corrosion. The reaction was presented as Equation (2-4).
The pH values of the two systems were measured during the reaction. Similarly,
Acidithiobacillus caldus SM-1 could decrease the pH under the biofilm, which lead to severe pitting
against S32654 stainless steel, which was usually considered a corrosion-resistant metal [34].
Table 2. The pH of in T.f and sterile for different days
time T.f sterile
(d) pH pH
0.5 2.5±0.1 3.0±0.1
1 2.7±0.1 3.5±0.1
2 3.3±0.1 3.8±0.1
4 3.5±0.1 4.0±0.1
8 3.5±0.1 4.0±0.1
12 3.5±0.1 4.0±0.1
16 3.5±0.1 4.0±0.1Int. J. Electrochem. Sci., Vol. 16, 2021 7
Table 2 showed that the final pH of the T.f system was lower than that of the sterile system,
indicating that the former produced acid stably during this process.
Iron was oxidized to ferrous iron, and then the ferrous was oxidized to ferric iron. In this
oxidation process, T.f obtained energy for its growth needs, and accelerated metal corrosion. Ferric
iron was subsequently hydrolyzed to release acid in aqueous solution, which partially offset the H +
consumed by corrosion of the coupons. As a result, the pH of the T.f system eventually reached a value
of about 3.5, which was lower than that of the sterile system. Three reactions, i.e. (2), (3), and (4),
were responsible for the continuation corrosion and the viability of the cells at a low pH (3.5±0.1).
3.3 Surface analysis
3.3.1 Corrosion film morphology
As shown in Fig. 3, after 6 h immersion, obvious corrosion product films were formed on the
surfaces of the coupons in both systems.
(b)
20μm
Figure 3. (a) The corrosion morphology of cast iron in T.f system for 6h (b) The corrosion morphology
of cast iron in sterile system for 6h
In the T.f system, the corrosion products took the form of fragments in some regions and
spheres in others, with cracks on the surface. This result differed from the experimental consequence
where corrosion products were round, compact and loose around the center by Li [35]. This result may
be ascribed to the difference in metal material. The uneven distribution of corrosion products and
cracks easily created an oxygen concentration difference cell, which enabled conditions for local or
crevice corrosion of the materials. In the sterile system, the corrosion products were denser and
thicker, and there were lamellar products arranged in a dense and orderly manner in local areas. The
relatively dense corrosion product film inhibited corrosion of cast iron to some extent.Int. J. Electrochem. Sci., Vol. 16, 2021 8
3.3.2 Scanning electron microscopy of corrosion morphology
Fig. 4 showed SEM images of the corrosion morphologies of the coupon surfaces taken at 400
times magnification for the T.f and sterile system for different immersion periods.
(a) (b)
50μm 50μm
(c) (d)
50μm 50μm
(e) (f)
50μm 50μmInt. J. Electrochem. Sci., Vol. 16, 2021 9
(g) (h)
50μm 50μm
(i) (j)
50μm 50μm
Figure 4. The SEM images of corrosion morphology (composite film removed) for different days, T.f :
(a) 0.25d; (c) 0.5d; (e) 1d; (g) 2d; (i) 4d; Sterile: (b) 0.25d; (d) 0.5d; (f) 1d; (h) 2d; (j) 4d;
After immersion for 6 h, the SEM images showed that the cast iron in both systems exhibited
uniform corrosion. In the T.f system, the surface of the iron had a greater number and deeper corrosion
pits; in the sterile system, the surface was flat and the number of corrosion pits was small. In both
systems, the surface morphology showed uniformly distributed corrosion pits, but their depth varied.
One reason for this difference was that metal atoms in positions of dislocation outcrops, spiral
dislocation step ends, and similar structures were preferentially removed from the lattice when the
metal underwent anodic dissolution. Secondly, impurities in the metal gave the cast iron an uneven
composition, which impacted the electrochemical performance. Preferential corrosion occurred in
regions with low electrode potential, resulting in different depths of corrosion pits. Thirdly, the
adsorption of bacteria was random in the T.f system, and corrosion was more serious in regions where
there were a large number of bacteria.
After soaking for 12 h, the area of surface corrosion was larger, and the corrosion pits had
become linked in the T.f system. This may be ascribed to the formation of a biofilm on the surface of
the cast iron by T.f during the initial experimental period and bacteria accumulated on the surface,
which accelerated the corrosion. In the sterile system, the areas and depths of corrosion pits on theInt. J. Electrochem. Sci., Vol. 16, 2021 10
surface of cast iron were less than those in the T.f system, and linkages of corrosion pits did not occur
on the surface.
After 1-4 d of immersion, the corrosion surface of the sample in the sterile control system was
flat, but there were still corrosion pits, the depths of which were less than those of the T.f system. In
the later stages of the experiment, the number of pits increased; these were round, deep, and
concentrated. In the T.f system, ferrous iron was sequentially oxidized by T.f, which circulated and
accelerated the corrosion, causing the pitting corrosion to continuously deepen until the required
inorganic substances and energy were exhausted and the bacterial strain stopped growing. Pitting
formation resulted from bacterial accumulation that resulted in local pH reduction and a difference in
biofilm. In addition, an oxygen-concentration cell formed [35].
It could be seen from Fig. 4(i) and (j) that the corrosion pits of the coupon in sterile group
seemed deeper than those in T.f. However, compared with the weight loss results, it could be known
that the coupon in T.f was corroded much more seriously because the surface of the sample had been
etched away and it became much thinner while only some pits appeared at the surface of the specimen
in sterile group.
In summary, the corrosion in the T.f system intensified with increasing immersion time. The
corrosion pits became linked together and their depth gradually increased. The extent of corrosion in
the sterile system also increased, but not to the same extent. In short, T.f promoted the corrosion of cast
iron. The conclusion was the same as corrosion weight loss.
3.4 Electrochemical test results
3.4.1 Open circuit potential
In the electrochemical test process, the bacterial medium was precultured for 3 days and then
transferred to a modified electrochemical test reactor that comprised a four-necked flask. Changes in
the OCP of cast iron measured in the T.f and sterile systems with time were shown in Figs. 5(a) and
(b), respectively.
The OCP of the electrode shifted in the negative direction and changed significantly when the
coupons were soaked in the T.f system for 6-12 h. This was due to excessive bacterial growth during
the initial soaking stage and incomplete biofilm formation on the cast iron surface. The matrix of the
material was therefore vulnerable to the corrosion medium and the corrosion tendency of the material
gradually increased. The negative shift of the OCP of the working electrode was not obvious from 12 h
to 1 d because the bacteria formed a biofilm on its surface and the corrosion product was dense, which
acted as a barrier. For immersion 1-5 d, the cast iron samples were continuously corroded and the OCP
continued to be shifted to more negative potentials.Int. J. Electrochem. Sci., Vol. 16, 2021 11
-0.58
2d
0.25d
3d
-0.59 0.5d
4d
1d
5d
Potential/V
-0.60
-0.61
-0.62
-0.63
0 200 400 600 800 1000 1200 1400
Time/s
Figure 5. (a) OCP of cast iron in T.f system
-0.55
-0.56
-0.57
-0.58 0.25d 2d
Potential/V
0.5d 3d
-0.59 1d 4d
5d
-0.60
-0.61
-0.62
-0.63
0 200 400 600 800 1000 1200
Time/s
Figure 5. (b) OCP of cast iron in sterile system
In the sterile system, the OCP showed a trend to negative shifts because hydrogen evolution
occurred throughout the entire period. The tendency for metal corrosion gradually increased. Fig. 5(a)
showed that the OCP significantly shifted in the negative direction during the first 3 days of
immersion, and then tended to remain constant for the next two days. The presence of bacteria in the
first 3 days may have accelerated corrosion. Over the following two days, the bacteria began to decay,Int. J. Electrochem. Sci., Vol. 16, 2021 12
and both systems then became dominated by hydrogen evolution corrosion at similar rates. This
indicated that the bacteria could promote corrosion of cast iron.
3.4.2 Electrochemical impedance spectroscopy
Nyquist plots of cast iron in the T.f and sterile systems were shown Figs. 6(a) and (b),
respectively.
Hydrogen evolution from the cast iron occurred in the acidic medium. The radii of the
capacitating arcs increased with time in the T.f system as shown in Fig. 6(a).
The radii of the impedance spectra of samples immersed for 6-12 h decreased which could be
ascribed to an enhancement in the surface area of the working electrode owing to generation of
corrosion pits and the fewer formation of corrosion products on the surface of cast iron during the
initial stage of corrosion. T.f kept accumulating on the surface of the matrix, causing the corrosion rate
to increase. Zhao found that EIS inhibited the growth of bacteria biofilm [36].
According to the principles of chemical equilibrium, as the bacterial strain oxidized Fe2+ to
Fe3+ to provide energy for its own growth, the anodic reaction Fe - 2e → Fe2+ continued, and the
sample was continuously corroded. The extent of corrosion reached a maximum after 12 h of
immersion. However, for immersion of the coupons for periods ranging from 12 h – 5 d, the radii of
the impedance spectra increased because corrosion products and extracellular polymeric substance
continually accumulated on the surface of the working electrode in this study. Similarly, the EIS of
steel A3 in T.f system tended to increase with an extension of immersion time [37].
18
16
14
12 0.25d
-Z''(Ω·cm2)
10 0.5d
1d
8 2d
6 3d
4d
4 5d
2
0
-2
20 30 40 50 60 70 80
Z'(Ω·cm2)
Figure 6. (a) EIS of cast iron in T.f systemInt. J. Electrochem. Sci., Vol. 16, 2021 13
7 0.25d
0.5d
6 1d
2d
5 3d
4d
-Z''(Ω·cm2)
4 5d
3
2
1
0
-1
10 15 20 25 30 35
Z'(Ω·cm2)
Figure 6. (b) EIS of cast iron in Sterile system
This composite membrane layer, which formed a barrier that protected the matrix of the
coupons, became increasingly dense and the capacitive reactance arc modulus enlarged with time,
giving rise to a decrease of roughness and a well-distributed electric field at the surface of the working
electrodes. Therefore, the corresponding Rt (charge-transfer resistance) and Rb (biofilm resistance)
increased and the rate of anodic corrosion slowed down, the impedance spectral radius increased, and
the corrosion rate of cast iron slowed down.
Two anodic reactions occurred in the T.f system:
Fe - 2e Fe2+ (6)
Fe2+ - e Fe3+ (7)
cathodic reaction:
2H+ + 2e H2 (8)
This sequence contradicted that proposed by Liu and Lv, who indicated that oxygen inhalation
reactions occurred as followed [6,38] :
1/2O2 + H2O + 2e 2OH- (9)
The difference may be attributed to the neutral solution pH. Reaction (8) was dominant
compared with reaction (9) in the initial phase. In addition, Li found that the biofilm changed the
anode and cathode reactions [39]. Owing to the oxidation of T.f, reactions (1) and (5) continued in the
forward direction, which accelerated dissolution and the corrosion rate of the cast iron. Likewise,
electrochemical measurements by Moradi and Duan showed that the corrosion rate of 316 stainless
steel increased obviously in the presence of IOB [40]. After two days, T.f formed a dense composite
film of corrosion products on the electrode surface, which blocked and protected the matrix and
slowed down the corrosion.Int. J. Electrochem. Sci., Vol. 16, 2021 14
In the sterile system, the impedance arc first decreased and then increased. In general, the size
of the impedance arc was related to the formation of a corrosion product film on the electrode surface.
A dense corrosion product film could protect the electrode. When the film had good integrity, the
impedance arc was large; if the impedance arc decreased, the film formed was defective or broken.
In these experiments, the measured impedance spectra radii for immersion times of 6 h to 2d
gradually decreased, which might result from an increase in contact area between H+ and the matrix in
the solution as the corrosion time and number of surface corrosion pits increased, resulting in an
increase in the corrosion rate. Furthermore, the corrosion product film that formed was thin or
incomplete, leading to a smaller impedance arc. The measured impedance spectra radii gradually
increased after 2 days, which might be due to densification of the corrosion products attached to the
surface of the cast iron matrix, which then acted as a barrier and protected the matrix from corrosion;
thus, the corrosion rate slowed down as the radii of the impedance spectra increased.
Throughout the entire experimental period, the impedance spectra of cast iron in the two
experimental systems took the shape of a half arc, and the radii first decreased and then increased.
Moreover, for the same immersion period, the impedance radii of the cast iron electrode in the T.f
system were smaller than those of the sterile system, which demonstrated that the corrosion trend was
larger. This result indicated that T.f was beneficial to the corrosion of cast iron, which was consistent
with the results of weight loss and morphology observation.
Figure 7. Equivalent circuit diagram of EIS
All data for the T.f and sterile systems were analyzed using an R(Q(R(QR))) equivalent circuit
diagram (Fig. 7), where Rs represented solution resistance, Qdl represented double layer capacitance, Rt
represented charge transfer resistance, Qb and Rb represented the capacitance and the resistance of the
biofilm or corrosion product film, respectively.
Table 3 The fitting results of EIS parameters in two systems for different time
Time Rs Qdl Rt Qb Rb Chsq
(h) (Ω·cm ) 2
(uF·cm )-2
(Ω·cm ) 2 -2
(uF·cm ) (Ω·cm )2
(χ2)
T.f 6h 13.81 0.0116 7.756 0.002472 8.771 1.05E-04
12h 7.02 0.01135 5.751 5.172 1.436 6.64E-05
1d 19.18 0.01418 3.452 0.006473 7.022 7.88E-05
2d 20.53 0.009157 4.03 0.01619 11.42 6.47E-05Int. J. Electrochem. Sci., Vol. 16, 2021 15
3d 24.74 0.004674 4.67 0.0229 16.66 1.51E-04
4d 26.42 0.003161 7.254 0.02401 21.3 4.31E-04
5d 40.73 0.003723 5.374 0.02798 32.14 1.14E-03
sterile 6h 14.05 0.001188 16.46 0.02934 0.2757 1.02E-04
12h 12.12 0.002554 8.801 0.6943 0.107 3.27E-05
1d 12.57 0.006387 7.292 9.049 0.3728 4.37E-05
2d 12.93 0.1075 5.067 0.004278 1.873 6.75E-05
3d 13.99 0.1078 2.86 0.00931 4.429 1.97E-04
4d 15.14 0.02952 12.22 0.9735 4.531 2.74E-04
5d 15.6 0.0241 13.89 0.3377 16.58 4.36E-04
The data in Table 3 showed that Rb was lowest for the 12 h coupons in the T.f system,
indicating that the corrosion rate of cast iron was largest for this immersion time. Because bacteria and
H+ attached to the surface of the iron, the generated biofilm was not uniform, which accelerated its
corrosion of cast iron.
After 12 h, Rb continued to grow and the corrosion products on the surface of cast iron
gradually increased. Under these conditions, it was not easy for the corrosive medium to contact the
surface of the matrix and the corrosion rate decreased.
Rt was used as a standard to evaluate the relative corrosion rates. Comparing the Rt values for
different immersion durations in the sterile system showed that the charge-transfer resistance gradually
decreased and corrosion occurred easily from 6 h-3 d, but Rt increased significantly from 3 to 5 d. This
was due to the formation of a thick corrosion product film on the surface, slowing down of the surface
electrochemical process, and a corresponding decline in the corrosion rate.
4. CONCLUSIONS
The corrosion behavior of cast iron in the presence of T.f was studied. Serious corrosion was
detected on cast iron associated with this bacterium and the corrosion rate in the presence of T.f was
about twice that of acidic water. The results from this study showed that T.f bacteria oxidized Fe2+ to
Fe3+ when the bacteria used Fe2+ as the energy source and as electron donors, which accelerated
corrosion of cast iron. The pH in the T.f medium was lower than in the sterile system, which promoted
continuation of the corrosion reaction. SEM results demonstrated that the corrosion product film was
loose and flawed for coupons immersed in the presence of T.f, but more compact and with lamellar
products arranged in a dense and orderly manner in local areas for the sterile coupons. When the film
was removed, the corrosion pits of the bacteria system were large and deep, and formed in series.
Uniform corrosion generation was expected, but pitting was discovered on the cast iron surface in the
existence of T.f, which could have arisen from localized corrosive surroundings or crevice corrosion
owing to attached T.f bacteria.Int. J. Electrochem. Sci., Vol. 16, 2021 16
ACKNOWLEDGMENTS
This project is supported financially by the Opening Project of Key Laboratory of Material Corrosion
and Protection of Sichuan Province (No. 2020CL18), the undergraduate innovation and business
startups training program of SUSE (No. CX2020012), the Opening Foundation of Sichuan Province
Engineering Center for Powder Metallurgy(No. SC-FMYJ2019-07), the Opening Project of Sichuan
Province University Key Laboratory of Bridge Non-destruction Detecting and Engineering Computing
(No. 2018QYJ03, 2018QZY01).
References
1. J., M., Byrne, N., Klueglein, C., Pearce, K., M. and Rosso, Science, 347 (2015) 1473.
2. J.M. Mcbeth and E. David, Front. Microbiol., 7 (2016) 767.
3. R. Sachan and A.K. Singh, Anti-corros. Method. M., 66 (2019) 19.
4. J. Starosvetsky, R. Kamari, Y. Farber, D. Bilanovic and R. Armon, Corros. Sci., 102 (2016) 446.
5. Yuanyuan, Pan, Xunan, Yang, Meiying, Xu, Guoping and Sun, Front. Microbiol., 8 (2017) 1.
6. H. Liu, T. Gu, G. Zhang, Y. Cheng, H. Wang and H. Liu, Corros. Sci., 102 (2016) 93.
7. M.A.D.D. Rienzo, M. Aguirre, P.J. Martin and M. Galicia, Anti-corros. Method. M., 65 (2018)
152.
8. F. Xu, Z. Qiu, R. Qiu, J. Yang and C. Lin, Anti-corros. Method. M., 65 (2018) 46.
9. I.M. Zin, V.I. Pokhmurskii, S.A. Korniy, O.V. Karpenko, S.B. Lyon, O.P. Khlopyk and M.B.
Tymus, Anti-corros. Method. M., 65 (2018) 517.
10. A.R. Colmer and M.E. Hinkle, Science, 106 (1947) 253.
11. M. Nemati, S.T.L. Harrison, G.S. Hansford and C. Webb, Biochem. Eng. J., 1 (1998) 171.
12. R. Jia, D. Yang, D. Xu and T. Gu, Corros. Sci., 145 (2018) 47.
13. R.C. Blake and E.A. Shute, J. Biol. Chem., 262 (1987) 14983.
14. J.C. Cox and D.H. Boxer, Biotechnol. Appl. Biochem., 8 (1986) 269.
15. A. Djebli, P. Proctor, R.C.B. Ii and M. Shoham, J. Mol. Biol., 227 (1992) 581.
16. W.J. Ingledew and A. Houston, Biotechnol. Appl. Biochem., 8 (1986) 242.
17. A.B. Jensen and C. Webb, Process Biochemistry, 30 (1995) 225.
18. C. Rai, Biotechnol. Prog., 1 (1985) 200.
19. X. Yang, X. Zhang, Y. Fan and H. Li, Biochem. Eng. J., 42 (2008) 166.
20. A.E. Torma and G.G. Gabra, Anton. Leeuw. Int. J. G., 43 (1977) 1.
21. P. Kaewkannetra, F.J. Garcia-Garcia and T.Y. Chiu, Int. J. Miner., Metall. Mater., 16 (2009) 368.
22. T. Wood, K. Murray and J. Burgess, Appl. Microbiol. Biotechnol., 56 (2001) 560.
23. C. Gόmez and K. Bosecker, Geomicrobiol. J., 16 (1999) 233.
24. D. Dierksen, P. Kühner, A. Kappler and K.G. Nickel, J. Eur. Ceram. Soc., 31 (2011) 1177.
25. H. Wang, L.K. Ju, H. Castaneda, G. Cheng and B.M.Z. Newby, Corros. Sci., 89 (2014) 250.
26. C. Pisapia, B. Humbert, M. Chaussidon and C. Mustin, Geomicrobiol. J., 25 (2008) 261.
27. K. Soe, S.M. Li, J.H. Liu and M. Yu, Acta Phys.-Chim. Sin., 24 (2011) 2633.
28. G. F. Xi, X. D. Zhao, S. Wang, J. Yang, J. Sun, Z. Y. An, Y. Li and X. Qu, Int. J. Electrochem.
Sci., 15 (2020) 361.
29. D. Xu, Y. Li and T. Gu, Bioelectrochemistry, 110(2016) 52.
30. X. Zhao, K. Chen, J. Yang, G. Xi, H. Tian and Q. Chen, Int. J. Electrochem. Sci., 14 (2019) 875.
31. P. Angella and K. Urbanicb, Corros. Sci., 42 (2000) 897.
32. S. Feng, H. Yang, Y. Xin, L. Zhang, W. Kang and W. Wang, J. Ind. Microbiol. Biotechnol., 39
(2012) 1625.
33. R. Jia, D. Yang, D. Xu and T. Gu, Bioelectrochemistry, 118 (2017) 38.
34. Y. Dong, B. Jiang, D. Xu, C. Jiang, Q. Li and T. Gu, Bioelectrochemistry, 123 (2018) 34.
35. S. M. Li, Y. Y. Zhang, J. H. Liu and M. Yu, Acta Phys. Chim. Sin., 24(2008)1553. (in Chinese)Int. J. Electrochem. Sci., Vol. 16, 2021 17
36. Y. Zhao, E. Zhou, Y. Liu, S. Liao, Z. Li, D. Xu, T. Zhang and T. Gu, Corros. Sci., 126 (2017) 142.
37. S. M. Li, Y. Y. Zhang, J. Du, J. H. Liu and M. Yu, Acta Chim. Sin., 68(2010)67. (in Chinese)
38. M. Y. Lv, M. Du, X. Li, Y. Y. Yue and X. C, Chen, J. Mater. Res. Technol., 8(2019)4066.
39. Q. Li, L. Dong, Y. Yang, Z. Wu, H. Zhu, Y. Dong, Y. Shen, L. Zhang and Q. Lu, Int. J.
Electrochem. Sci., 15 (2020) 470.
40. M. Moradi, J. Duan, H. Ashassi-Sorkhabi and X. Luan, Corros. Sci.,53 (2011) 4282.
© 2021 The Authors. Published by ESG (www.electrochemsci.org). This article is an open access
article distributed under the terms and conditions of the Creative Commons Attribution license
(http://creativecommons.org/licenses/by/4.0/).You can also read