Effects of Microstructure, Mechanical and Physical Properties on Machinability of Graphite Cast Irons - MDPI
←
→
Page content transcription
If your browser does not render page correctly, please read the page content below
metals
Article
Effects of Microstructure, Mechanical and Physical
Properties on Machinability of Graphite Cast Irons
Jiangzhuo Ren 1 , Fengzhang Ren 2, *, Fengjun Li 3 , Linkai Cui 3 , Yi Xiong 4 and
Alex A. Volinsky 5
 1   Faculty of Engineering, University of Alberta, Edmonton T6G 1H9, AB, Canada; ren6@ualberta.ca
 2   School of Materials Science and Engineering, Henan University of Science and Technology, Luoyang 471023,
     China
 3   Third Assembly Plant, First Tractor Co. Ltd., Luoyang 471004, China; lifengjun@tsinghua.org.cn (F.L.);
     cuilinkai@126.com (L.C.)
 4   Henan Collaborative Innovation Center of Nonferrous Metals, Luoyang 471023, Henan, China;
     xy_hbdy@163.com
 5   Department of Mechanical Engineering, University of South Florida, Tampa, FL 33620, USA;
     volinsky@usf.edu
 *   Correspondence: renfz@haust.edu.cn; Tel.: +86-379-6425-2673

 Received: 3 February 2020; Accepted: 20 February 2020; Published: 21 February 2020

 Abstract: Flake (FGI) and spheroidal (SGI) graphite cast irons are often used to produce workpieces,
 which often need to be machined. Machinability differences under various machining methods are
 the basis for choosing machining equipment and technology. In this work, FGI and SGI were used to
 produce tractor front brackets, and the machinability of both materials under turning and drilling
 processes was compared. The machinability (turning and drilling ability) has been evaluated in terms
 of machining load, chips shape, surface roughness, and tool temperature. The influence of materials
 microstructure and thermal conductivity on the machinability was analyzed. In the turning process,
 the cutting force and its standard deviation of the FGI were larger than the SGI due to the higher
 volume fraction of pearlite. The surface roughness was similar in both materials. In the drilling
 process, the even action of the friction and cutting force on the bit turned into similar drilling loads
 for both materials. Higher friction and lower thermal conductivity caused a higher bit temperature in
 SGI drilling compared to FGI. The chip breaking was worse in SGI drilling, where the longer chips
 scratched the internal surface of the holes, resulting in the higher surface roughness.

 Keywords: graphite cast iron; turning ability; drilling ability; machining load; roughness;
 tool temperature

1. Introduction
      General graphite cast iron workpieces are usually machined using automated machining centers.
The main influencing factor of the machining efficiency is machinability [1]. Poor machinability leads
to frequent replacement of the cutting tools and decreases the machining efficiency. The machinability
of materials is generally evaluated in terms of tool wear, surface roughness, and machining load [2].
Nayyar et al. [3] measured the cutting force, cutting temperature, and tool life during turning flake (FGI),
compacted (CGI), and spheroidal (SGI) graphite irons. They found that the surface cutting temperature
was roughly the same for various cast irons, but the cutting force and tool life were significantly
different. SGI with lower hardness and lesser pearlite has a higher cutting force and shorter tool life
compared to the FGI. Seker et al. [4] reported that austempering heat treatment of SGI significantly
improved the surface quality and resulted in a relatively small change in cutting forces in the turning

Metals 2020, 10, 285; doi:10.3390/met10020285                                    www.mdpi.com/journal/metals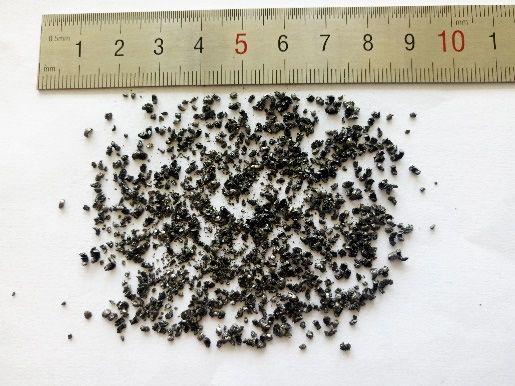
Metals 2020, 10, 285                                                                                   2 of 13

process. For various cast irons with equal tensile strength, Ren et al. [5] investigated the effects of
microstructure and mechanical properties on the cutting force of different cast irons with similar tensile
strength in the turning process. Results showed that there is a positive correlation between the cutting
force, hardness, and pearlite content for cast irons with equal tensile strength. SGI with lower hardness
and less pearlite has lower cutting force compared with FGI. Tooptong et al. [6] compared flank wear
when turning FGI, CGI, and SGI under dry conditions. They found the main reason for the poor
machinability of CGI and SGI is that the cutting temperature is much higher than FGI. Heck et al. [7]
investigated the reason why CGI has poor machinability compared to conventional FGI in the cutting
process. The reason is the formation of the MnS layer on the tool surface when machining FGI. The
MnS layer acts as a lubricant and prevents the adhesion of workpiece particles. However, this layer
cannot form when machining CGI and SGI because the formation of MnS-inclusions is not possible in
both materials due to the higher magnesium content, which, in turn, is responsible for the formation of
the graphite vermicles and nodules. De Sousa et al. [8] investigated the torque, power consumption,
tool life, and surface roughness of continuous ductile iron bars during the milling process. The tool life
and torque were different during milling of different regions, but power consumption and surface
roughness were not statistically different. Dias et al. [9] researched the effects of gray cast iron matrix
structure on the cutting force and tool life in milling operations. They found that the higher pearlite
content led to faster tool wear and higher cutting force. Amir et al. [10] examined the influence of
microstructure and mechanical properties of compacted graphite iron on tool wear in the face milling
process. They found that the microstructure has a significant effect on tool wear. A lower amount
of abrasive carbonitride particles and lower content of pearlite reduce tool wear. Da Silva et al. [11]
analyzed cutting tools wear during milling of FGI and CGI. The results showed that the workpiece
material strongly influenced the tool life and wear. The wear mechanisms of both materials were
abrasion and adhesion. Ren et al. [12] investigated the influence of inoculating addition on drill bit
wear for drilling flake graphite iron, and optimal combinations of compound inoculants with smallest
drill wear were obtained. Meena et al. [13] studied the drilling properties of green austempered ductile
iron. Results showed that the specific cutting energy and cutting force coefficients increased with
decreasing feed rate and increasing cutting speed. Jan et al. [14] investigated the effects of drill bit
wear on the cutting torque and axial force during drilling spheroidal graphite cast iron. The results
showed that the small feed and high cutting speed resulted in a loss of cutting ability in the area
of accelerated wear. Li et al. [15] investigated the wear mechanism of the dill in the drilling of CGI
under dry and minimum quantity lubrication. The results showed that the main wear mechanism of
drilling of CGI is adhesion and abrasion. These previous studies mainly focused on the machinability
evaluation for only one type of cast iron, or on the machinability comparisons of different cast irons
only using a machining method. Perhaps for different cast irons, the machinability of certain cast iron
is good under one machining method, and its machinability is bad under another machining method.
Then, it is necessary to compare the machinability under different machining methods. Finding out
their machinability differences under various machining methods is the basis to choose machining
equipment and technology. In addition, contrasting the machinability of FGI and SGI, some literature
reports gave inconsistent results. For example, the authors of both [3,7] reported that FGI has a lower
cutting force compared to SGI, but the authors of [5] reported that FGI has a higher cutting force.
Thus, the machinability comparison of two or more graphite cast irons still needs further research.
Meanwhile, the relationships between the machinability and microstructure, and physical properties
under various processing conditions require further examination.
      This study derived from the actual production problems. A famous tractor manufacturing
company originally adopted low-cost FGI to cast tractor front brackets. The FGI brackets sometimes
broke during the tractor operation. Then FGI was replaced by SGI with higher strength, and then the
brackets no longer broke. However, statistical analysis showed faster drill bit wear during drilling of
the SGI brackets. The drill bit life in drilling SGI brackets was only half of FGI. The technical staff of the
company guessed that faster drill bit wear could be due mainly to the longer chips. The objective of
Metals 2019, 9, x FOR PEER REVIEW                                                                                    3 of 13

drilling of the SGI brackets. The drill bit life in drilling SGI brackets was only half of FGI. The
technical staff of the company guessed that faster drill bit wear could be due mainly to the longer
chips. The objective of this study was to compare the machinability (turning and drilling ability)
Metals 2020, 10, 285
                                                                                                                     in
                                                                                                                3 of 13
terms of machining load, chips shape, surface roughness, and tool temperature of the two cast irons
used to produce tractor front brackets and to investigate the relationships between the materials
this study was to
machinability,         compare the machinability
                     microstructure,    and thermal(turning     and drilling
                                                       conductivity.          ability) inresults
                                                                        The research      terms of machining
                                                                                                 will contribute load,
                                                                                                                     to
chips  shape,    surface  roughness,   and  tool temperature   of the two cast irons  used  to produce
identifying the reasons for the drill wear difference between the two materials. Furthermore, the       tractor front
brackets   and to
results could        investigate
                  offer  guidancethefor
                                      relationships
                                        the structurebetween
                                                        design the  materials
                                                                of SGI         machinability,
                                                                        brackets,  such as what microstructure,
                                                                                                  ratio of ferriteandto
thermal
pearlite conductivity.
           in the matrixThe  canresearch
                                  make SGI results willa contribute
                                                 have                to identifying
                                                          good drilling              the reasons
                                                                          ability (good           for the drill
                                                                                           chip-breaking    andwear
                                                                                                                  low
difference   between the two materials. Furthermore, the results could offer guidance for the structure
surface roughness).
design of SGI brackets, such as what ratio of ferrite to pearlite in the matrix can make SGI have a good
2. Materials
drilling  abilityand   Experimental
                   (good               Procedures
                           chip-breaking    and low surface roughness).

2.
2.1.Materials  andBracket
     Tractor front Experimental
                          CastingsProcedures
      Tractorfront
2.1. Tractor    front   brackets
                   Bracket          were cast using flake cast iron HT250 (Chinese grade, equivalent to
                             Castings
American No.35 grade) and spheroidal graphite cast iron QT450 (Chinese grade, equivalent to
      Tractor front brackets were cast using flake cast iron HT250 (Chinese grade, equivalent to American
American 65-45-12 grade), respectively. The raw materials of HT250 were ~15 wt.% pig iron, 55
No.35 grade) and spheroidal graphite cast iron QT450 (Chinese grade, equivalent to American 65-45-12
wt.% steel scrap, and the return scrap. The raw materials of QT450 were 35 wt.% pig iron, 35 wt.%
grade), respectively. The raw materials of HT250 were ~15 wt.% pig iron, 55 wt.% steel scrap, and the
steel scrap, and the return scrap. Raw materials were melted in a medium-frequency induction
return scrap. The raw materials of QT450 were 35 wt.% pig iron, 35 wt.% steel scrap, and the return
furnace of 10,000 kg capacity. The molding of tractor front brackets of both materials was in a sand
scrap. Raw materials were melted in a medium-frequency induction furnace of 10,000 kg capacity.
mold, and the mold was opened when the front brackets were cooled to room temperature. The
The molding of tractor front brackets of both materials was in a sand mold, and the mold was opened
inoculation approach of both materials was an in-ladle treatment in front of the furnace. Inoculant
when the front brackets were cooled to room temperature. The inoculation approach of both materials
was FeSi75 (74.6 wt.% Si, 1.3 wt.% Al, and the remainder Fe; 0.2–1 mm particle size), and was added
was an in-ladle treatment in front of the furnace. Inoculant was FeSi75 (74.6 wt.% Si, 1.3 wt.% Al, and
into molten iron in the amount of 0.4 wt.% for HT250 and 1 wt.% for QT450, respectively.
the remainder Fe; 0.2–1 mm particle size), and was added into molten iron in the amount of 0.4 wt.%
Inoculation and spheroidization treatments of QT450 were carried out simultaneously. La-Mg
for HT250 and 1 wt.% for QT450, respectively. Inoculation and spheroidization treatments of QT450
nodulizer (main composition: 3 wt.% RE, 8 wt.% Mg: 5–10 mm particle size) was used and its
were carried out simultaneously. La-Mg nodulizer (main composition: 3 wt.% RE, 8 wt.% Mg: 5–10
addition was 1 wt.%. The tapping and casting temperatures were 1450 °C and 1350 °C for HT250,
mm particle size) was used and its addition was 1 wt.%. The tapping and casting temperatures were
and 1480 °C and 1370 °C for QT450, respectively.
1450 ◦ C and 1350 ◦ C for HT250, and 1480 ◦ C and 1370 ◦ C for QT450, respectively.
                       front brackets
      The qualified front     brackets of
                                        of the
                                            the two
                                                two materials
                                                     materials were
                                                                were randomly
                                                                       randomly extracted
                                                                                  extracted for
                                                                                             for testing.
                                                                                                  testing. The front
                                                  sampling parts for tensile
bracket casting and its testing parts (the sampling                     tensile and
                                                                                and turning
                                                                                     turning specimens,
                                                                                              specimens, and the
drilling site) are shown in FigureFigure 11 (700
                                             (700 mm
                                                  mm maximum
                                                       maximum length,
                                                                    length, 630
                                                                            630 mm
                                                                                 mm maximum
                                                                                      maximum width,width, 190 mm
                                                                                                                mm
maximum thickness).
maximum      thickness).The  Thedesign
                                   design
                                        andand   actual
                                              actual (one(one  furnace)
                                                           furnace)       chemical
                                                                     chemical       composition
                                                                               composition   of HT250of HT250    and
                                                                                                         and QT450
QT450 materials
materials  is listedisinlisted
                          Tablein1.Table 1.

                                                                  Turning specimens part

                                      Tensile specimens parts             Drilling site

                               Figure 1. The front bracket casting and its tested parts.
                               Figure 1. The front bracket casting and its tested parts.
                               Table 1. The composition of HT250 and QT450 in wt.%.

      Material             C          Si          Mn              Cr              S         P         Mg         Rare Earths
             Design     3.15–3.3    1.6–1.8      0.8–1          0.2–0.3        ≤0.12       ≤0.10        -              -
  HT250
             Actual        3.26       1.80        0.83            0.17          0.055       0.03        -              -
             Design       3.6–4      2.7–3       ≤0.35              -          ≤0.035      ≤0.07   0.035–0.055    0.02–0.04
  QT450
             Actual        3.55       2.93        0.26              -           0.018      0.031      0.055          0.02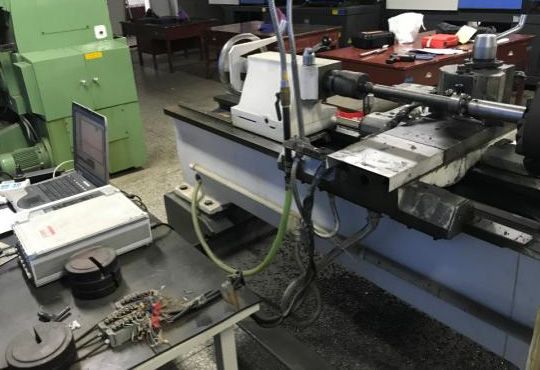
Table 1. The composition of HT250 and QT450 in wt.%.
Material C Si Mn Cr S P Mg Rare Earths
Design 3.15–3.3 1.6–1.8 0.8–1 0.2–0.3 ≤0.12 ≤0.10 - -
HT250
Actual 3.26 1.80 0.83 0.17 0.055 0.03 - -
Metals 2020,Design
QT450 10, 285 3.6–4 2.7–3 ≤0.35 - ≤0.035 ≤0.07 0.035–0.055 0.02–0.04
4 of 13
Actual 3.55 2.93 0.26 - 0.018 0.031 0.055 0.02
2.2. Performance Testing
Testing and
and Microstructure
Microstructure Observations
Observations
2.2.1. Mechanical and
2.2.1. Mechanical and Physical
Physical Properties
Properties and
and Microstructure
Microstructure
The
The tensile
tensilespecimen
specimenblanks
blankswere
werecutcutfrom
from the
thefront bracket
front castings
bracket castings(as(as
shown
shownin Figure 1) of1)the
in Figure of
two materials and then machined into cylindrical tensile specimens. The sizes of
the two materials and then machined into cylindrical tensile specimens. The sizes of the gauge the gauge portions of
the tensileofspecimens
portions forspecimens
the tensile TH250 andforQT450
TH250 wereandΦ QT450
16 mm × 30 mm
were and
Φ 16 mmΦ 10 mm
× 30 mm× 50 mm,
and Φ respectively
10 mm × 50
(National Standards
mm, respectively of the People’s
(National Republic
Standards of the of China, Republic
People's GB/T 9439-2010 andGB/T
of China, GB/T9439-2010
1348-2009.andChinese
GB/T
standards referred to ASTM A48/A48M-2003 and ASTM A571/A571M-2015).
1348-2009. Chinese standards referred to ASTM A48/A48M-2003 and ASTM A571/A571M-2015). Four tensile specimens
were
Four prepared for each ofwere
tensile specimens the two materials.
prepared The tensile
for each of the strength was measured
two materials. The tensileusing a universal
strength was
tensile testing machine. The samples for hardness, thermal conductivity, and metallographic
measured using a universal tensile testing machine. The samples for hardness, thermal conductivity, testing
were cut from the tensile
and metallographic testingspecimen
were cut whose
from the tensile strength
tensile waswhose
specimen the closest
tensiletostrength
the mean wasvalue of the
the closest
four
to thetensile
meanspecimens.
value of theBrinell hardness
four tensile was measured
specimens. Brinell at 5 locations
hardness wason the sample
measured at 5surface.
locationsSamples
on the
cutting sites and hardness measurement locations are shown in Figure 2.
sample surface. Samples cutting sites and hardness measurement locations are shown in Figure 2.
Figure
Figure 2. Schematic diagram
2. Schematic diagram of
of samples
samples cutting
cutting sites
sites and
and hardness
hardness measurement
measurement locations.
locations.
The
The size
size ofof thermal
thermal conductivity
conductivity samples
samples waswas ΦΦ 12.7 mm ×× 1.5
12.7 mm 1.5 mm.
mm. Thermal
Thermal conductivity
conductivity waswas
measured at 323 K, 423 K, 473 K, and 573 K by the DLF-1300 (TA Instruments,
measured at 323 K, 423 K, 473 K, and 573 K by the DLF-1300 (TA Instruments, Newcastle, PA, Newcastle, PA, USA)
USA)
pulse
pulse laser
laserthermal
thermal conductivity
conductivity instrument. The measurements
instrument. The measurements complied with the with
complied National
the Standards
National
of the People’s Republic of China GB/T 22588-2008. After the samples were heated
Standards of the People's Republic of China GB/T 22588-2008. After the samples were heated to the to the measurement
temperature,
measurementthe sample’s surface
temperature, was shone
the sample's by a was
surface lasershone
pulse byforaalaser
shortpulse
time, for
andathen
shortthe temperature
time, and then
change of the surface was detected with an infrared thermometer. Thermal
the temperature change of the surface was detected with an infrared thermometer. Thermal conductivity was calculated
according
conductivity to the
wastemperature change. to the temperature change.
calculated according
The cut metallographic samples were ground and polished with sandpaper and polishing cloth
The cut
(polishing metallographic
liquid: water), andsamples were with
then etched groundtheand polished
solution withacid
of nitric sandpaper and polishing
and alcohol cloth
(3 vol.% nitric
(polishing
acid). An liquid:
opticalwater), and then
microscope Zeissetched
Axio with
Vert the
A1 solution of nitric acid Germany)
(Zeiss, Oberkochen, and alcoholequipped
(3 vol.% nitric
with
metallographic image analysis software was used to observe and analyze the microstructure. with
acid). An optical microscope Zeiss Axio Vert A1 (Zeiss, Oberkochen, Germany) equipped
metallographic image analysis software was used to observe and analyze the microstructure.
2.2.2. Turning Tests
2.2.2. Turning Tests
The turning specimens blanks were cut from the front bracket castings (shown in Figure 1) made
from The
the two materials
turning and then
specimens machined
blanks wereinto
cutthe Φ 28
from mm
the × 285
front mm size
bracket bar specimens.
castings (shown in Two turning
Figure 1)
specimens
made fromwere prepared
the two for each
materials andofthen
the machined
two materials.
into Inthethe
Φ turning
28 mm ×process,
285 mm thesize
main
barcutting force
specimens.
was
Twomeasured in real-time.
turning specimens wereThe used lathe
prepared for(Shenyang
each of theFirst
two Machine
materials.Tool Factory,
In the Shenyang,
turning process, China),
the main a
cutting
cutting tool
force (Sumitomo
was measuredElectricinIndustries
real-time.Ltd,
TheOsaka,
used Japan), and measurement
lathe (Shenyang system Tool
First Machine of theFactory,
cutting
force (Donghua
Shenyang, China), Testing Technology
a cutting Co. Ltd.,
tool (Sumitomo Taizhou,
Electric China) were
Industries the same
Ltd, Osaka, as that
Japan), andinmeasurement
the previous
paper [5]. Luis Norberto López de Lacalle et al. [16] adopted the dynamometric table KISTLER 9255B
to measure the cutting force. It is a three-component quartz dynamometer for measuring the three
orthogonal components of a force and the three induced torques. It has the advantage of convenient
application. In our work, an elastomer (octagonal ring dynamometer) and twenty resistance strain
gauges were combined together to measure the cutting force. This is a traditional and more economical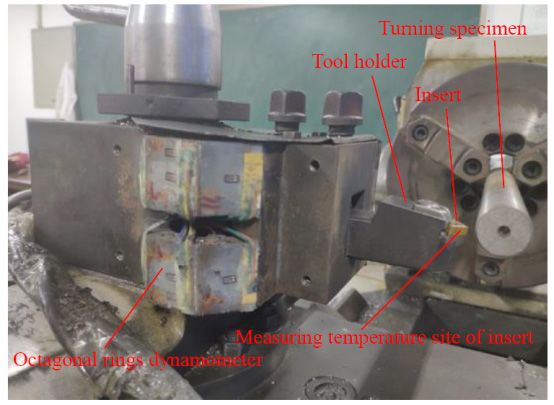
system of the
that in the cuttingpaper
previous force (Donghua Testing Technology
[5]. Luis Norberto López de Lacalle Co. Ltd.,et al.Taizhou, China)the
[16] adopted were the same as
dynamometric
that in the previous paper [5]. Luis Norberto López de Lacalle et al.
table KISTLER 9255B to measure the cutting force. It is a three-component quartz dynamometer for [16] adopted the dynamometric
table KISTLER
measuring the 9255B to measure the
three orthogonal cutting force.
components of a Itforce
is a three-component
and the three induced quartztorques.
dynamometer
It has for the
measuring
advantage of theconvenient
three orthogonalapplication.components
In our work,of a anforce and the(octagonal
elastomer three induced torques. It has and
ring dynamometer) the
advantage of convenient
twenty resistance strain application.
gauges wereIncombined our work,together
an elastomer (octagonal
to measure the ring dynamometer)
cutting force. This and is a
Metals 2020, 10, 285 5 of 13
twenty resistance
traditional and more straineconomical
gauges were combined
method. The together
cutting to toolmeasure the cutting
and octagonal ringforce. This is a
dynamometer
traditional
installation and more in
are shown economical
Figure 3. The method.
octagonalThering cutting tool and was
dynamometer octagonal
fixed onring the dynamometer
lathe. The tool
installation
holder was
method. The are shown
fixed on the
cutting in octagonal
tool Figure 3. The
and octagonal ringoctagonal
dynamometer ring dynamometer
ring dynamometer cuttingwas
and ainstallation fixed
insert
are wasonfastened
shown the
inlathe.toThe
Figure the3. tool
tool
The
holder
holder.was
octagonal Twentyfixed
ring on the octagonal
resistance
dynamometer strain ring on
wasgauges
fixed dynamometer
were attached
the lathe. Theand
on athe
tool cutting insert
ring internal
holder was was
fixed fastened
surface.
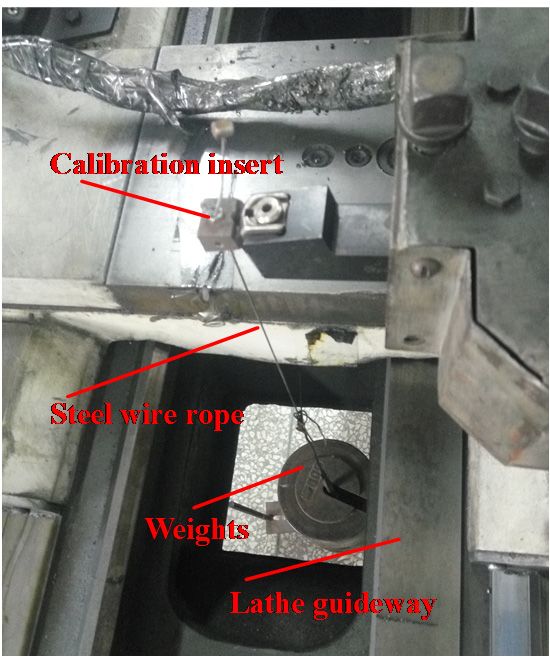
on the Beforeto the
octagonal tool
cutting,
ring
holder.
measuringTwenty
dynamometer force resistance
andsystem
a cutting strain
was gauges
calibrated
insert were attached
using
was fastened a to
slung on the
load
the tool ring Twenty
method.
holder. internal surface.
The insert wasBefore
resistance straincutting,
replaced by a
gauges
measuring
calibration
were attached force
insert system
on the ring was
during calibrated
calibrating.
internal surface.Theusing a cutting,
slung insert
calibration
Before load method.
can be
measuring Thesystem
loaded
force insert
bywaswascalibrated
the replaced
slung load by(as
using a
calibration
ashown
slung in
load insert
Figure
method.during
4). Cutting calibrating.
The insert force
was was The calibration
measured
replaced by a according insertto
calibration can be loaded
the operation
insert during by the slung
procedure
calibrating. Thegivenload (as
in [17],
calibration
shown
whichcan
insert in Figure
ensured
be loaded 4). Cutting
high bymeasurementforceload
the slung was measured
precision.
(as shown according
Thein authors
Figure 4).to Cutting
of the operation
[17] pointed
forcewhenprocedure
was given
the cutting
measured in [17],
force
according is
which
compared
to ensured
the operation high
for different measurement
procedure given ainprecision.
materials, mechanically
[17], which Theensured
authorshigh
clamped of [17]
tool pointed
should
measurement when
be used, thethe
and
precision.cutting
insertforce
can be
The authors is
compared
replaced,
of for different
but
[17] pointed the
when tool materials,
theholder
cuttingshoulda mechanically
force isbe mounted
compared clamped
foronce toolmaterials,
only
different should
for beaused,
all subsequent andtests.
mechanically the insert cantool
The spindle
clamped be
replaced,
should but
rotationbespeed
used, the
of
andtool
the the holder
lathe
insertwas should
can180
be rpm be andmounted
replaced, the the
but once
toolonly
feeding rate for
holder was all0.51
should subsequent
mm/rev.
be mounted tests.
The The
initial
once onlyspindle
turning
for all
rotation
diameterspeed
subsequent was ofmm
28
tests. the
Theandlathe
spindlewas
the 180 rpm
cutting
rotation depth andwas
speed thethe
of 2feeding
mm and
lathe rate
was3 mm was(diameter
180 0.51and
rpm mm/rev. The initial
reduction),
the feeding turning
respectively.
rate was 0.51
diameter
Measurement
mm/rev. was 28 mm and
sceneturning
The initial is shown the cutting
in Figure
diameter depth was 2 mm and 3 mm (diameter reduction),
was5.28 mm and the cutting depth was 2 mm and 3 mm (diameter respectively.
Measurement scene is shown
reduction), respectively. in Figure scene
Measurement 5. is shown in Figure 5.
Figure 3.
Figure 3. Cutting
Cutting tool
tool and
and octagonal
octagonal ring
ring dynamometer installation.
dynamometer installation.
Figure 3. Cutting tool and octagonal ring dynamometer installation.
Metals 2019, 9, x FOR PEER REVIEW 6 of 13
Figure
Figure 4. Calibration of
4. Calibration of measuring
measuring force
force system.
system.
Figure 4. Calibration of measuring force system.
Figure 5. Measurement scene.
Figure 5. Measurement scene.
During the turning process, at the same cutting length of ~70 mm, the insert temperature was
measured on the side of the insert (measurement site is shown in Figure 3) using an infrared
thermometer PT90 (Shan Xi RG Automatic Instrument Co., Ltd., Xi’an, China).
Metals 2020, 10, 285                                                                                         6 of 13

    During the turning process, at the same cutting length of ~70 mm, the insert temperature
was measured on the side of the insert (measurement site is shown in Figure 3) using an infrared
thermometer PT90 (Shan Xi RG Automatic Instrument Co., Ltd., Xi’an, China).
    The surface roughness of the turning specimens was measured by an optical microscope ZAG-1
(Shanghai Optical Instrument Factory, Shanghai, China).

2.2.3. Drilling Tests
      Drilling was performed on a horizontal machining center NH8000 DCG (Mori Seiki Manufacturing
Company, Nagoya, Japan). The drilling site is shown in Figure 1. Two bits were used. One is a
cemented carbide bit with Φ 14.5 mm diameter, and the other is a high-speed steel bit with Φ 19 mm
diameter. When the Φ 14.5 mm bit was used, two adopted drilling processes were 1500 rpm rotating
speed with 0.27 mm/rev feed rate and 800 rpm rotating speed with 0.5 mm/rev feed rate, respectively.
Obviously, the drilling speed of the two drilling processes was the same: ~400 mm/min. Two holes
were drilled for each material and each drilling process. When the Φ 19 mm bit was used, two adopted
drilling processes were 240 rpm rotating speed with 0.42 mm/rev feed rate and 200 rpm rotating
speed with 0.5 mm/rev feed rate, respectively. The drilling speed of 100 mm/min was the same for the
two drilling processes. Two holes were also drilled for each material and each drilling process. The
relative torque and feed force (bit axial force) on the bit were automatically measured by the horizontal
machining center. Here, the relative load (torque or feed force) is the ratio of the actual load on the bit
to the maximum designed output load of the machining center.
      The depth of all drilled holes was 40 mm. When the bit just exited the hole after drilling, the
temperature of the bit tip was measured using the infrared thermometer PT90. The drilled holes
were cut along the central axis and the roughness of the internal surface was measured by the ZAG-1
microscope. The shape of the internal surface was measured by the three-dimensional surface profiler
(NanoFocus AG, Oberhausen, Germany).

3. Results and Discussion

3.1. Microstructure Effects on Mechanical Properties
     The mechanical properties of HT250 and QT450 are listed in Table 2. The tensile strength of each
material was the average value obtained from four specimens, and the hardness of each material was
the mean value of the five locations. In Table 2, the tensile strength of the two materials from the front
brackets did not reach the required strength (>250 MPa for HT250 and >450 MPa for QT450). However,
during the front brackets production, the individually cast tensile specimens reached the required
strength, and thus the front brackets were considered as qualified products.

                       Table 2. The microstructure and mechanical properties of HT250 and QT450.

                           Graphite          Graphite
                                                                Pearlite           Tensile            Brinell
     Material             Shape and          Length or
                                                             Content, vol.%    Strength, MPa       Hardness, HB
                         Content, vol.%    Diameter, mm
      HT250                 Flake, 100        0.12–0.25          45–55              191                163
      QT450                 Sphere, 90        0.03–0.06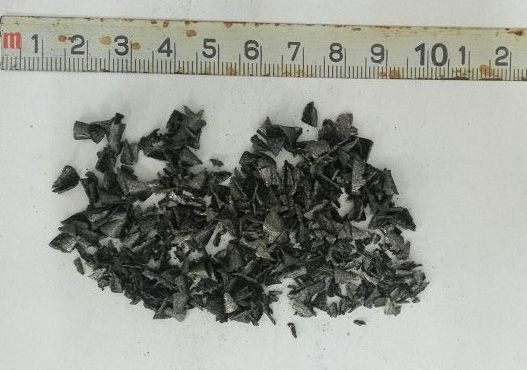
percentage is the volume percentage, which is calculated based on the area percentage in the
metallograph (the volume percentage equals to the area percentage), and refers to the percentage of
this type of graphite to the total graphite or the pearlite to the matrix. The microstructure of the two
materials is shown in Figure 6. Flake graphite length of HT250 is 0.12–0.25 mm, and its pearlite
Metals
content is10,about
2020, 285 half of the matrix. The nodularity of QT450 is ~90%, and the graphite sphere 7 of 13
diameter is 0.03–0.06 mm. The matrix structure of QT450 is basically ferrite.
(a) (b)
Pearlite
Ferrite Graphite
Ferrite
Graphite
Figure 6. The microstructure of two materials: (a) HT250 and (b) QT450.
The
The tensile
tensile strength
strength of
of graphite
graphite cast
cast irons
irons is
is determined
determined by by graphite
graphite shape
shape andand size,
size, pearlite
pearlite
content,
content, and interlaminar spacing [18], and among them, the graphite shape is the most important
and interlaminar spacing [18], and among them, the graphite shape is the most important
factor.
factor. Spherical
Spherical graphite,
graphite,compared
comparedtotoflakeflakegraphite,
graphite, not only
not reduces
only reducesthethe
stress concentration
stress at the
concentration at
phase interface, but also reduces the segmentation of matrix structure. The two
the phase interface, but also reduces the segmentation of matrix structure. The two reasons lead to reasons lead to the
tensile strength
the tensile of HT250
strength to betosignificantly
of HT250 lower
be significantly thanthan
lower QT450.
QT450.
For graphitic cast irons, Brinell hardness of graphite is only ~3 HBS [19], which can be ignored
For graphitic
compared cast
to pearlite andirons, Brinell
ferrite. hardness
The pearlite of graphite
hardness is only ~3 HBS
is dramatically [19],
higher thanwhich canFor
ferrite. beexample,
ignored
compared
in the Fe-Cr-Bto pearlite and
alloy, the ferrite. of
hardness The pearlite
pearlite andhardness
ferrite isis290–330
dramatically
HV [20]higher than ferrite.
and 160–220 For
HV [21],
example, in the Fe-Cr-B alloy, the hardness of pearlite and ferrite is 290–330 HV [20]
respectively. Meanwhile, the pearlite hardness was mainly controlled by interlamellar spacing [22]. and 160–220 HV
[21], respectively.
Thus, Meanwhile,
Brinell hardness the pearlite
of graphitic hardness
cast irons mainly was mainlyon
depends controlled by interlamellar
the pearlite spacing
content and pearlite
interlamellar spacing. The pearlite content of HT250 was significantly higher than QT450, so and
[22]. Thus, Brinell hardness of graphitic cast irons mainly depends on the pearlite content the
pearlite interlamellar
hardness spacing. The higher
of HT250 is significantly pearlitethan
content of HT250 was significantly higher than QT450, so
QT450.
the hardness of HT250 is significantly higher than QT450.
3.2. Microstructure and Physical Properties Effects on Turning and Drilling Ability
3.2. Microstructure and Physical Properties Effects on Turning and Drilling Ability
3.2.1. Chips Shape
3.2.1.The
Chips
shapeShape
and size of drilling chips were roughly the same for the same diameter bit with different
drilling
Theprocesses
shape and (rotating
size ofspeed andchips
drilling feed rate)
werefor the same
roughly thematerial.
same for Thethelarger
samethe cutting depth
diameter or
bit with
the bit, the bigger the chips should be for the same material. However, for different
different drilling processes (rotating speed and feed rate) for the same material. The larger the materials, whether
in turning
cutting depthor drilling processes,
or the bit, the the
the bigger shape
chipsandshould
size ofbe
chips were
for the samedifferent under
material. the samefor
However, machining
different
conditions, as shown
materials, whether in in Figures
turning or7drilling
and 8. The turningthe
processes, chips
shapeandand
drilling chips
size of chipsarewere
obviously different,
different under
resulting
the same machining conditions, as shown in Figures 7 and 8. The turning chips and drilling chipswith
from the difference of the geometric parameters of the insert and bit blades. Compared are
HT250,
obviously in both the turning
different, andfrom
resulting drilling
the processes,
difference the chips
of the breakingparameters
geometric of QT450 was worse,
of the especially
insert and bit
during
blades. drilling.
Compared Thiswith
is because
HT250,ofinthe microstructure
both the turning difference
and drillingbetween the two
processes, thematerials. First, the
chips breaking of
graphite
QT450 was morphology of TH250 during
worse, especially and QT450 was flakes
drilling. This isand spheres,ofrespectively.
because The round
the microstructure edge of
difference
spherical
between the graphite reduces theFirst,
two materials. stresstheconcentration at the phase of
graphite morphology interface
TH250(i.e.,
andreduces
QT450 the
wasnotch effect),
flakes and
making the crack initiation more difficult [23]. The spherical graphite reduces the surface areas of
graphite in the structure (for the same volume of graphite, the surface area of spherical graphite is less
than flake graphite), and then reduces partitioning to the matrix [24]. Second, the matrix of QT450 was
ferrite (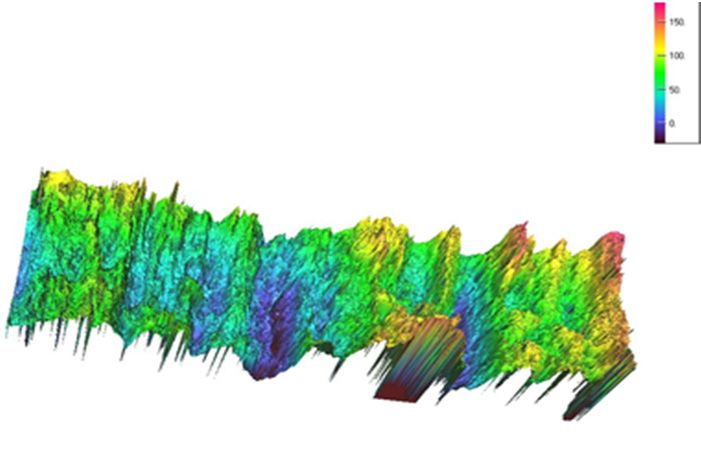
phase
phase interface
        interface (i.e.,
                     (i.e., reduces
                            reduces thethe notch
                                            notch effect),
                                                  effect), making
                                                           making the
                                                                    the crack
                                                                         crack initiation
                                                                                initiation more
                                                                                            more difficult
                                                                                                   difficult [23].
                                                                                                             [23]. The
                                                                                                                   The
spherical
spherical graphite
             graphite reduces
                         reduces thethe surface
                                          surface areas
                                                  areas of
                                                         of graphite
                                                            graphite inin the
                                                                          the structure
                                                                               structure (for
                                                                                          (for the
                                                                                                the same
                                                                                                    same volume
                                                                                                           volume of  of
graphite,
graphite, thethe surface
                   surface area
                              area ofof spherical
                                         spherical graphite
                                                    graphite isis less
                                                                  less than
                                                                        than flake
                                                                              flake graphite),
                                                                                     graphite), and
                                                                                                  and then
                                                                                                        then reduces
                                                                                                              reduces
partitioning
partitioning to  to the
                     the matrix
                           matrix [24].
                                    [24]. Second,
                                            Second, the
                                                    the matrix
                                                         matrix ofof QT450
                                                                     QT450 waswas ferrite
                                                                                    ferrite (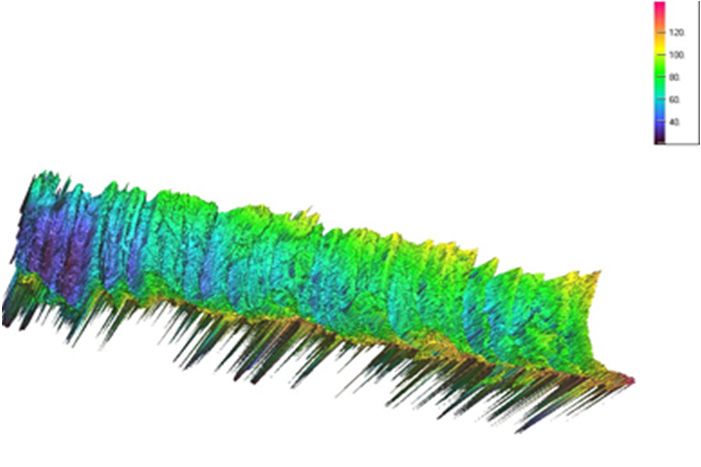
Metals 2020, 10, 285 9 of 13
Metals 2019, 9, x FOR PEER REVIEW 9 of 13
(a) (b)
µm µm
(c) (d)
µm µm
Figure 9. Three-dimensional shape of the holes internal surface of the HT250 borehole: (a) Φ 14.5 mm
Figure 9. Three-dimensional shape of the holes internal surface of the HT250 borehole: (a) Φ 14.5 mm
bit and (b) Φ 19 mm bit; QT450 borehole: (c) Φ 14.5 mm bit and (d) Φ 19 mm bit (1.6 mm measured
bit and (b) Φ 19 mm bit; QT450 borehole: (c) Φ 14.5 mm bit and (d) Φ 19 mm bit (1.6 mm measured
length).
length).
During turning, the differences in surface roughness were not obvious for different materials or
During turning, the differences in surface roughness were not obvious for different materials or
different cutting depth. However, during drilling, the internal surface roughness of the hole is different
different cutting depth. However, during drilling, the internal surface roughness of the hole is
for different materials or bit diameters. The QT450 roughness was higher than HT250 for the same bit.
different for different materials or bit diameters. The QT450 roughness was higher than HT250 for
When drilled by the Φ 14.5 mm bit, the hole roughness of QT450 was 45% higher than HT250, and
the same bit. When drilled by the Φ 14.5 mm bit, the hole roughness of QT450 was 45% higher than
when drilled by the Φ 19 mm bit, it was 78% higher. The QT450 surface roughness during drilling was
HT250, and when drilled by the Φ 19 mm bit, it was 78% higher. The QT450 surface roughness
higher because of the worse chip breaking, leading to longer chips. It was harder to remove the longer
during drilling was higher because of the worse chip breaking, leading to longer chips. It was harder
chips from the holes, resulting in a rougher uneven hole surface. According to the analysis of the chips
to remove the longer chips from the holes, resulting in a rougher uneven hole surface. According to
breaking the performance of QT450, increased pearlite content in the QT450 spheroidal graphite cast
the analysis of the chips breaking the performance of QT450, increased pearlite content in the QT450
iron structure improved chips breaking performance, and thus improves the surface quality. In the
spheroidal graphite cast iron structure improved chips breaking performance, and thus improves
turning process, difficult chip removal did not exist, so the surface roughness differences between
the surface quality. In the turning process, difficult chip removal did not exist, so the surface
QT450 and HT250 turning specimens are not obvious.
roughness differences between QT450 and HT250 turning specimens are not obvious.
3.2.3. Insert and Bit Temperature during Turning and Drilling
3.2.3. Insert and Bit Temperature during Turning and Drilling
The insert and bit temperatures are listed in Table 4 for the QT450 and HT250 turning and drilling.
The
The bit insert andisbit
temperature thetemperatures
average valueare listed in
obtained by Table 4 two
drilling for the QT450
holes. As seenandinHT250
Table 4,turning
for the and
two
drilling. The bit temperature is the average value obtained by drilling
machined materials, the insert temperature was roughly the same for the same cutting depth, two holes. As seen in whereas
Table 4,
for the
the two machined
bit temperature wasmaterials,
obviouslythe insert temperature
different was roughly
for the same drilling process the(bit
same for therotating
diameter, same cutting
speed
depth, whereas the bit temperature was obviously different for the
and feed rate). Under the same drilling conditions, two reasons caused the bit temperature during same drilling process (bit
QT450 drilling to be higher than HT250. First, during QT450 drilling, higher friction occurred becausethe
diameter, rotating speed and feed rate). Under the same drilling conditions, two reasons caused of
bit temperature
the difficult chip during
removal, QT450 drilling
resulting to be higher
in a higher than HT250.
temperature First,
of the bit. duringthe
Second, QT450
thermaldrilling, higher
conductivity
friction
of QT450occurred because
is significantly of the
lower thandifficult
HT250,chip removal,
as listed resulting
in Table 5, whichin resulted
a higherintemperature of the bit.
lower heat dissipation
during QT450 drilling, and thus higher temperature. In production, drilling is continuouslyTable
Second, the thermal conductivity of QT450 is significantly lower than HT250, as listed in carried5,
which
out resulted
multiple in lower
times, heat dissipation
so the temperature during
rise of the bitQT450
used todrilling, andwill
drill QT450 thusbehigher
higher,temperature.
leading to wear In
production, drilling is continuously carried out multiple times, so the temperature
degradation of the bit. The difference of friction-generated heat between the chip and the insert during rise of the bit
used to ofdrill
turning QT450QT450 will beis higher,
and HT250 small due leading to wearshape
to the similar degradation
and size ofof the
theQT450
bit. The
anddifference
HT250 chips. of
friction-generated
Opposite to drillingheat between hole,
an enclosed the chip and the
the insert insert so
is open, during turning
the effects of QT450thermal
of different and HT250 is small
conductivity
due to the similar shape and size of the QT450 and HT250 chips. Opposite
of QT450 and HT250 on the insert temperature were relatively weak. This led to roughly the same to drilling an enclosed
hole, the
insert insert is open,
temperature during soturning
the effects
QT450 of different
and HT250. thermal conductivity of QT450 and HT250 on the
insert temperature were relatively weak. This led to roughly the same insert temperature during
turning QT450 and HT250.
Metals 2020, 10, 285                                                                                                         10 of 13

                                         Table 4. The insert and bit temperature in ◦ C.

                                    Insert                          Φ 14.5 mm Bit                          Φ 19 mm Bit
    Material                                                  n = 1500,          n = 800,           n = 240,          n = 200,
                           t=2                t=3              v = 0.27           v = 0.5           v = 0.42           v = 0.5
     HT250                   87                116                98                 89                 86                  92
     QT450                   93                114               126                102                105                 124
                       Note: t is the cutting depth (mm); n is the bit speed (rpm); v is the feed rate (mm/rev).

                            Table 5. Thermal conductivity at a different temperature, W/(m·K).

       Material                       323 K                     423 K                       473 K                    573 K
         HT250                          49                        46                         44                       41
         QT450                          31                        33                         34                       36

3.2.4. Turning and Drilling Load
     The average values and standard deviation of the main cutting force over 70 mm cutting length at
2 mm and 3 mm cutting depth are listed in Table 6. The average value and standard deviation of the
main cutting force of HT250 were obviously higher than QT450. At 2 mm cutting depth, the cutting
force of HT250 was 9% higher than QT450, and at 3 mm cutting depth, it was 19% higher. The HT250
(FGI) with higher hardness and lower tensile strength had a higher cutting force compared with QT450
(SGI). In [5] (our previous work), the cutting force of FGI was also higher with higher hardness and
lower tensile strength than CGI and SGI. FGI with 250 HB hardness and 347 MPa tensile strength had
1438 N cutting force at 2.5 mm cutting depth, whereas CGI with 162 HB hardness and 345 MPa tensile
strength had 1156 N cutting force, and SGI with 181 HB hardness and 525 MPa tensile strength had
1254 N cutting force. However, in [3], there was no such phenomenon observed, as shown in Table 7.
The cutting force of FGI with higher hardness (175 HB) was obviously smaller than SGI with lower
hardness (155 HB). The results in different references are obviously inconsistent. This inconsistent
situation can be explained as follows. The cutting force should also be closely related to lubricant on
the tool surface, cut material deformation and fracture resistance besides tool material and geometric
parameters. During cutting, the share rates of these factors (lubricant, cut material deformation, and
fracture resistance) in the cutting force are still unclear. These inconsistent results of this work and of
the works in [3,5] are likely due to sulfur content differences of their respective FGI. Heck et al. [7]
pointed the reason why FGI had good machinability compared with CGI was due to the formation of
the MnS layer on the tool surface when machining FGI, but this layer cannot form when machining
CGI due to addition of vermiculizer containing magnesium during CGI casting. Likewise, this layer
cannot form when machining SGI due to the addition of nodularizer containing magnesium during
SGI casting. The MnS layer acts as a lubricant and prevents the adhesion of workpiece particles, which
dramatically decreases the cutting force and tool wear. For graphite cast irons with different graphite
shapes, the influence of the MnS layer on the cutting force is different. Yet, the influence of the MnS
layer should not be classified as the influence of graphite shape.

                  Table 6. The average value and standard deviation of the main cutting force, N.

                                        Cutting Depth of 2 mm                                Cutting Depth of 3 mm
       Material
                                    Average                  Deviation                    Average                  Deviation
         HT250                         964                        40                        1415                      58
         QT450                         882                        31                        1192                      37
Metals 2020, 10, 285 11 of 13
Table 7. The average cutting force, N [3].
Turning Boring
Material
v = 30, f = 0.2, t = 1.5 v = 30, f = 0.3, t = 1.5
FGI 615 790
CGI 700 920
SGI — 940
Note: v is the cutting speed (m/min), f is the feed rate (mm/rev), and t is the cutting depth (mm).
The sulfur content was 0.055 wt.% in HT250 (The sulfur content of FGI was also low in our
previous work because all castings were produced by the same company.), but the content of FGI
in [3,7] was relatively high, up to 0.09 wt.% and 0.085 wt.%, respectively. Due to lower sulfur content
in HT250, the MnS lubricant layer could not be formed or was discontinuous, and its effect on the
cutting force was lower, which resulted in the larger cutting force during HT250 cutting. Meanwhile,
as described above, graphitic cast irons with higher pearlite content have higher hardness. Higher
hardness resulted in higher deformation resistance. Only from the deformation resistance, the higher
the pearlite content in the HT250 matrix led to the larger cutting force of HT250. Based on plenty of
experimental data in our previous work, the pearlite content is the main cutting force influencing factor
under our experimental conditions. The fracture resistance during cutting is different from the tensile
strength because of the different stress states. However, there should be a positive correlation between
the two. The magnitude of the effect of the tensile strength on cutting force is still unclear.
The single ferrite in the QT450 matrix led to a smaller cutting force standard deviation of QT450.
The relative torque and feed force on the bit under different drilling processes are listed in Table 8.
Under the same drilling conditions, the difference of the drilling load (relative torque and feed force)
between the two materials was small. Two factors caused this result. First, compared with HT250, the
friction between the bit and chips during drilling of QT450 is severe. The larger friction force resisted
bit rotation and feeding and resulted in the larger drilling load. Second, the cutting mechanism of
the cutting edges of both insert and bit was the same [25]. The cutting force on the insert was smaller
during QT450 turning, and the cutting force on the bit edge was also relatively smaller during QT450
drilling. The smaller cutting force on the bit edge should lead to a smaller drilling load. The even
action of the larger friction force and the smaller cutting force on the bit during QT450 drilling resulted
in the drilling loads of QT450 and HT250 being roughly the same.
Table 8. Relative torque and relative feed force on the drilling bits.
Φ 14.5 mm Bit Φ 19 mm Bit
Material Measuring Project n = 1500, N = 800, n = 240, N = 200,
v = 0.27 V = 0.5 v = 0.42 V = 0.5
Relative torque, % 16 7 5 6
HT250
Relative feed force, % 62 59 — —
Relative torque, % 15 8 5 6
QT450
Relative feed force, % 63 61 — —
Note: n is bit the rotating speed (rpm); v is the feed rate (mm/rev).
In summary, during rough turning, compared with QT450, the turning ability of HT250 was worse
due to its larger cutting force. However, the drilling ability of HT250 was better due to its smaller hole
surface roughness and lower temperature of the bit. To increase drill bit life in drilling SGI, appropriate
surface treatment for drill bit may be an efficient method. Rodriguez-Barrero et al. [26] concluded
that the proper coatings (TiAlSiN, mAlTiN, and AlTiSiN) can offer the best performance (including
long life of drill bit) in drilling low and medium carbon steels according to flank wear, adhesion, chipMetals 2020, 10, 285 12 of 13
evacuation, and thrust force evolution criteria. Their research results are used for reference for the
choice and design of the drill bit during drilling the SGI front brackets.
4. Conclusions
(1) During rough turning, the average value and standard deviation of the cutting force of HT250
with lower sulfur content were obviously larger than QT450. At 2 mm cutting depth, the cutting force
of HT250 was 9% higher than QT450, and at 3 mm cutting depth, it was 19% higher. However, the
surface roughness of the two materials was roughly the same.
(2) During drilling, the even action of the larger friction force and the smaller cutting force on the
bit during QT450 drilling caused the drilling loads of QT450 and HT250 to be roughly the same.
(3) Compared with HT250, the much higher friction and lower thermal conductivity lead to a
higher temperature of the bit during QT450 drilling. The chips breaking situation was worse and the
longer chips badly scratched the surface of the holes, resulting in the larger surface roughness. When
drilled by the Φ 14.5 mm bit, the hole roughness of QT450 was 45% higher than HT250, and when
drilled by the Φ 19 mm bit, it was 78% higher.
Author Contributions: J.R. drafted the manuscript and performed a part of experiments; F.R. contributed to
the study concept; F.L. contributed to the bracket production; L.C. performed the experiments; Y.X. and A.A.V.
performed the data analysis and revised the manuscript. All authors have read and agreed to the published
version of the manuscript.
Funding: This study was supported by China’s National Overseas Study Fund (CSC201808180001) and the
National Natural Science Foundation of China (U1804146).
Conflicts of Interest: The authors declare no conflicts of interest.
References
1. Ezugwu, E.O.; Wang, Z.M. Titanium alloys and their machinability—A review. J. Mater. Process. Tech. 1997,
68, 262–274. [CrossRef]
2. Günay, M.; Korkut, I.; Aslan, E.; Seker, U. Experimental investigation of the effect of cutting tool rake angle
on main cutting force. J. Mater. Process. Tech. 2005, 166, 44–49. [CrossRef]
3. Nayyar, V.; Kaminski, J.; Kinnander, A.; Nyborg, L. An experimental investigation of machinability of
graphitic cast iron grades; flake, compacted and spheroidal graphite iron in continuous machining operations.
Procedia Cirp 2012, 1, 488–493. [CrossRef]
4. Seker, U.; Hasirci, H. Evaluation of machinability of austempered ductile irons in terms of cutting forces and
surface quality. J. Mater. Process. Tech. 2006, 173, 260–268. [CrossRef]
5. Ren, J.Z.; Li, Z.L.; Xiong, Y.; Li, F.J.; Ren, F.Z.; Volinsky, A.A. Effect of microstructure and mechanical
properties on cutting force of different cast irons with similar tensile strength. China Foundry 2019, 16, 177–183.
[CrossRef]
6. Tooptong, S.; Park, K.H.; Kwon, P. A comparative investigation on flank wear when turning three cast irons.
Tribol. Int. 2018, 120, 127–139. [CrossRef]
7. Heck, M.; Ortner, H.M.; Flege, S.; Reuter, U.; Ensinger, W. Analytical investigations concerning the wear
behaviour of cutting tools used for the machining of compacted graphite iron and grey cast iron. Int. J.
Refract. Met. Hard Mater. 2008, 26, 197–206. [CrossRef]
8. De Sousa, J.A.G.; Sales, W.F.; Guesser, W.L.; Machado, Á.R. Machinability of rectangular bars of nodular cast
iron produced by continuous casting. Int. J. Adv. Manuf. Tech. 2018, 98, 2505–2517. [CrossRef]
9. Dias, L.R.M.; Diniz, A.E. Effect of the gray cast iron microstructure on milling tool life and cutting force. J.
Braz. Soc. Mech. Sci. 2013, 35, 17–29. [CrossRef]
10. Amir, M.; Rohollah, G.; Carsten, B. Effects of workpiece microstructure, mechanical properties and machining
conditions on tool wear when milling compacted graphite iron. Wear 2018, 410, 190–201.
11. Da Silva, M.B.; Naves, V.T.G.; De Melo, J.D.B.; De Andrade, C.L.F.; Guesser, W.L. Analysis of wear of
cemented carbide cutting tools during milling operation of gray iron and compacted graphite iron. Wear
2011, 271, 2426–2432. [CrossRef]Metals 2020, 10, 285 13 of 13
12. Ren, F.Z.; Li, F.J.; Liu, W.M.; Ma, Z.H.; Tian, B.H. Effect of inoculating addition on machinability of gray cast
Iron. J. Rare Earth 2009, 27, 294–299. [CrossRef]
13. Meena, A.; El Mansori, M. Drilling performance of green austempered ductile iron (ADI) grade produced by
novel manufacturing technology. Int. J. Adv. Manuf. Tech. 2012, 59, 9–19. [CrossRef]
14. Jan, J.; Rafal, K.; Tomasz, T. Operational tests of wear dynamics of drills made of low-alloy high-speed
Hs2-5-1 steel. Eksploat. Niezawodn. 2016, 18, 271–277.
15. Li, Y.; Wu, W.W. Investigation of drilling machinability of compacted graphite iron under dry and minimum
quantity lubrication. Metals 2019, 9, 1095. [CrossRef]
16. De Lacalle, L.N.L.; Lamikiz, A.; Sanchez, J.A.; de Bustos, I.F. Simultaneous measurement of forces and
machine tool position for diagnostic of machining tests. IEEE Trans. Instrum. Meas. 2005, 54, 2329–2335.
17. Ren, F.Z.; Zhang, D.W.; Volinsky, A.A. Experimental investigation of the cutting force measurements in
machinability evaluations of metals. J. Test. Eval. 2014, 42, 1541–1545.
18. Hernando, J.C.; Elfsberg, J.; Ghassemali, E.; Dahle, A.K.; Diószegi, A. The effect of coarsening of primary
austenite on the ultimate tensile strength of hypoeutectic compacted graphite Fe-C-Si alloys. Scr. Mater.
2019, 168, 33–37. [CrossRef]
19. Qian, L.; Zhang, H.B.; Zhao, Y.C.; Chen, J.P. Relationship between cutting machining properties of
graphite-containing cast irons and their structures. Mod. Cast Iron 2005, 25, 17–20.
20. Tian, Y.; Ju, J.; Fu, H.G.; Ma, S.Q.; Lin, J.; Lei, Y.P. Effect of chromium content on microstructure, hardness,
and wear resistance of as-cast Fe-Cr-B alloy. J. Mater. Eng. Perform. 2019, 28, 6428–6437. [CrossRef]
21. Buchely, M.F.; Gutierrez, J.C.; Leon, L.M.; Toro, A. The effect of microstructure on abrasive wear of hardfacing
alloys. Wear 2005, 259, 52–61. [CrossRef]
22. Zhao, Y. Effects of raw material proportioning on pearlitic lamellar spacing and hardness of ductile iron.
Foundry 2011, 60, 397–400.
23. Sun, T.; Song, R.B.; Li, Y.P.; Yang, F.Q.; Wu, C.J.; Wang, Z.Y. Influence of nodularizing and inoculation
treatment on the microstructure characteristic and mechanical property of lower bainite cast iron. J. Mech.
Eng. 2015, 51, 128–134. [CrossRef]
24. Carazo, F.D.; Giusti, S.M.; Boccardo, A.D.; Godoy, L.A. Effective properties of nodular cast-iron: A multi-scale
computational approach. Comp. Mater. Sci. 2014, 82, 378–390. [CrossRef]
25. Ren, F.Z.; Cui, L.K.; Shi, W.P.; Xiong, Y.; Wei, S.Z. Drilling-ability evaluation for grey cast iron and ductile
iron front brackets. Acta Metrol. Sin. 2018, 39, 842–846.
26. Rodriguez-Barrero, S.; Fernández-Larrinoa, J.; Azkona, I.; López de Lacalle, L.N.; Polvorosa, R. Enhanced
performance of nanostructured coatings for drilling by droplet elimination. Mater. Manuf. Process. 2016, 31,
593–602. [CrossRef]
© 2020 by the authors. Licensee MDPI, Basel, Switzerland. This article is an open access
article distributed under the terms and conditions of the Creative Commons Attribution
(CC BY) license (http://creativecommons.org/licenses/by/4.0/).You can also read