Evaluating Temperature Trends: Is July 2021 in Chandigarh warmer than Average? - Scholarly
←
→
Page content transcription
If your browser does not render page correctly, please read the page content below
Evaluating Temperature Trends: Is July 2021 in
Chandigarh warmer than Average?
Name: Saanvi Singla
Date: August 2021
Professor: Eric Pallant

About the Student:
Saanvi Singla is a student at Vivek High School, Chandigarh, India. This research project was
undertaken by Saanvi as part of her undergraduate coursework for Environmental Sciences and
Sustainability under the guidance of Prof. Eric Pallant at Allegheny College.

Summary:
The planet’s climate has gone rogue with intense heat waves in one zone to raging storms in
another. The magnitude of the problem has compelled individuals to take immediate action for
awareness. This study analyses the temperature trends in July 2021 in Chandigarh, India. It aims
to determine if even Chandigarh, one of the greenest cities in India, is challenged by climate
change. Our methodology consisted of a statistical evaluation of July temperature data for the
past 13 years to test this hypothesis.

 Evaluating Temperature Trends: Is July 2021 in Chandigarh warmer than
 Average?

Introduction:
Overwhelming scientific evidence has illustrated that our planet is warming progressively (IPCC,
2018; Thompson, 2010; NASA, 2021; Cubasch et al. 2013; NCA, 2018). The observed surface
temperatures show an escalation of 0.87°C over the decade 2006 to 2015 (IPCC, 2018; IPCC
2014). According to the World Meteorological Organization, the last decade, i.e. 2011 to 2020
was the warmest decade on record in a recurring climate change trend (WMO, 2021; Lindsey et
al., 2021; Wuebbles et al. 2017), with 2020 and 2016 tying as the hottest years and 2019 bringing
up the rear (NOAA, 2020; Brown, 2021; University of East Anglia and Hadley Centre).
Furthermore, the global average temperature has risen 1.58∘C since the late nineteenth century
(Wuebbles et al. 2017; NASA, 2021) owing to the increased anthropogenic emissions of
greenhouse gases, primarily Carbon Dioxide (IPCC, 2018; NASA, 2021; IPCC, 2014; Gaffney el
at., 2017; Fahey, 2017). Integrative indicators such as changes in sea level, ocean acidification,
hydrological changes corroborate the climate crisis (IPCC, 2018; Thompson, 2010; NASA,
2021; Cubasch et al. 2013; Wuebbles et al. 2017).
Climate change has led to occurrence of extreme weather fluctuations, including intense changes
in the hydrological cycle, with wide ranging impacts from floods to water scarcity (Cubasch et
al. 2013; Tabari 2020; Wehner et al., 2017; Seneviratne et al., 2012). Oceanic uptake of carbon
dioxide has resulted in a 0.1 decrease in pH, corresponding to a 26% increase in acidity (IPCC,
2014). Soaring temperatures have also led to shrinking of glaciers, accelerated loss of sea ice and
intensified heat waves, thus increasing the probability of natural disasters namely droughts
(NASA, 2021; Wehner et al., 2017; Smith, 2020; Seneviratne et al., 2012). Beside its effects on
the abiotic environment, climate change has had profound impacts on biodiversity causing
geological dislocation and regional extinction of several species (Nunez et al., 2019, Kannan,
2009; Dawson et al., 2011).

According to the Indian Meteorological Department, surface temperature anomalies in India
have shown a rise of +0.62∘C across the past century, primarily due to post-2000 temperature
drift (Indian Meteorological Department; Srivastava, 2017). India’s diverse population and
topography makes her more vulnerable to the impacts of climate emergencies (IPCC, 2014;
Mehta et al., 2019). With over 58% of the population dependent on climate sensitive fields,
primarily agriculture, weather variations pose severe implications for the economy and the
nutritional security of the country (Guntukula, 2019; Balasubramanian et al., 2012). 68% of the
total cultivated land in India rain fed, without proper irrigation equipment, supports 40% of the
human population (Praveen et al., 2020). Changing climate is also one of the biggest contributors
to increased natural disasters such as heatwaves, floods and cyclones in the Indian subcontinent
(Praveen et al., 2020, AchutaRao et al., 2019), validation of which can be drawn from the floods
in Chennai, and the heat waves of Andhra Pradesh (AchutaRao et al., 2019).

Establishing the need for climate research, this paper analyses the temperature trend of July 2021
in Chandigarh, India against the mean July temperature of the past 12 years. It discusses the
temperature pattern in order to decipher the recent effects of changing climate in Chandigarh by
drawing a comparison with the global drift. The article proceeds to illustrate the mitigation of
climate emergencies using green architectural design.

Methods:
 A) How to determine the temperature measured at ∘ ′ . " , ∘
 ′ . " at 18:00 from July 12 - July 27, 2021 are higher or lower than the
 average temperature measured from the weather station at 18.00 since 2009?

 This research study is based upon data collected across 12 July, 2021 to 27 July 2021 in
 Chandigarh, India at 30 ∘ 43′32.2608" , 76 ∘ 46′49.6596" .I gathered the temperature
 each day at 18:00. The VelVeeta HTC-2 Plastic Digital Indoor cum Outdoor thermo-
 hygrometer with the resolution of + 0.1∘C was used, with its metal kink held 5 feet above
the ground and 2 metres away from the nearby buildings for 2 minutes to receive a stable
 measurement. The thermometer kink was placed under an A4 sized cardboard to protect
 it from direct sunlight.

 This data of measured temperatures was tabulated and further compared with the daily
 average temperatures from 12 July to 27 July each year across 2009 to 2020 at 18:00.
 This information was compiled from the World Weather Station which computes the
 temperature from the Chandigarh Airport at 30.6668∘N, 76.7863∘S. Both data sets were
 plotted on a graph in order to visually contrast the temperature in 2021 against the
 average for past 12 years for a particular day within 12th to 27th of July.

 B) How to compare the average July temperature of Chandigarh since 2009 with the
 average monthly temperature of July 2021?

 The maximum and minimum temperature for all 31 days of July from 2009 to 2021 was
 tabulated in a spreadsheet with reference to the World Weather Online Station (30). Mean
 temperature for July across all 13 years was calculated and each average was plotted on a
 graph to represent the temperature trend.

Results:
 A) How to determine the temperature measured at ∘ ′ . " , ∘
 ′ . " at 18:00 from July 12 - July 27, 2021 are higher or lower than the
 average temperature measured from the weather station at 18.00 since 2009?
(Figure 3.1 - Measured Temperature at 18:00 in July (2021) and Average Temperature at 18:00 in July
 (from 2009 - 2020))

 (Figure 3.2 - Measured Temperature at 18:00 in July (2021), Temperature at 18:00 in July (2020) and
 Average Temperature at 18:00 in July (from 2009 - 2019)

The graphs indicate that the measured temperatures of July 2021 were not significantly different
from the past average (see Figure 3.1). An unpaired T-Test showed that the probability of the
two datasets to be different was lower than 20%. 2020, on the contrary, presented an average rise
of 6.36°C from the mean temperature (see Figure 3.2). Temperatures across the 2-week span in
2021 display an increasing trend from 12 - 17 July with a sharp drop on the 18th and 25th of
July. In general, temperature demonstrates a declining trend with the close of July.

 B) How to compare the average July temperature of Chandigarh since 2009 with the
 average monthly temperature of July 2021?

 Sas - Cumulative Average
 Sas - Trendline
 sas - Average July Temperature per year

 (Figure 3.3 - Average July Temperature (∘C) vs. Year)

As per the data collected from the World Weather Online Station, temperatures in Chandigarh
show a slight increase of 6.7% from 2009 to 2021. Temperatures across the past 13 years
cumulatively average at 30.56∘C. 2012-2014 was a comparatively warmer period whereas all
others till 2019 were conversely below average (see Figure 3.3). At a glance, it is clear that 2020
was the warmest year in Chandigarh since 2009 with an anomaly of 3.10∘C. Even though the
mean temperature in July 2021 has declined by 1.64°C, it remains 1.46°C above the combined
average.
Discussions:
The July temperature in Chandigarh exhibits a gradual escalation pattern. This inclined rising
fashion could primarily be attributed to anthropogenic emissions. Temperatures are the result of
equilibrium of absorbed solar rays and reflected infra-red waves. Greenhouse gases are
instrumental in trapping these infra-red waves ( >750 nm), raising the temperature (Jain, 2003).
GHGs (Carbon dioxide, Carbon monoxide, Nitrous Oxide) in Chandigarh are on the rise
primarily owing to vehicular pollution and increase in private transportation (Bhargava et al.,
2018). This fact coincides with the temperature pattern and can provide a credible explanation
for the same.

In the 13 year dataset, 2020 showcases the highest temperature. One plausible explanation for the
same could be the significant decrease of fine particulate matter (PM 2.5) during the COVID-19
lockdown (Zhang et al., 2021; Kumar et al., 2020), which would have resulted in a decrease in
the net cloud albedo effect. Cloud albedo effect refers to the enhanced reflection of solar
radiations, presenting a cooling impact (Myhre, 2013). However, substantial reductions in the
carbon dioxide levels during the same time period (Le Quéré et al., 2020; Liu et al., 2020) could
contradict the above hypothesis. According to NASA, the cumulative emissions had minimal
effect on the avoided warming (Brown, NASA, 2021).

It is also crucial to note that the analysed data belongs to 2009 - 2021, which includes the
warmest decade on record (WMO, 2021; Lindsey et al., 2021; Wuebbles et al. 2017). There is an
increasing probability for these trends to intensify over subsequent years (Fischer et al., 2021)
Thus, the gathered figures support the notions of a warming planet, but are insufficient in
proving its occurrence.

Future Research:
It is impossible to predict climate change with a handful of temperature readings. Weather is
dynamic and concrete changes can be determined through observations over a prolonged time
period, which will eliminate day-to-day weather transitions. This evaluative study can be
improved by taking continual temperature data for a longer time span of 1 to 2 decades. Further
one can collect data at around 10 - 20 locations in the selected region for a more accurate result.

Solutions:
Buildings account for 19% of GHG emissions across the globe (Lucon et al., 2014; Altomonte,
2009; Li et al., 2021), thus remain a primary cause of climate change. With the assistance of
green architecture, these ‘problems’ can become solutions. The core of this transition lies in the
variables of thermal performances, ventilation, light distribution and visual comfort balanced
with the climate and environmental contexts (Altomonte, 2009). Surprisingly, the fuel to this
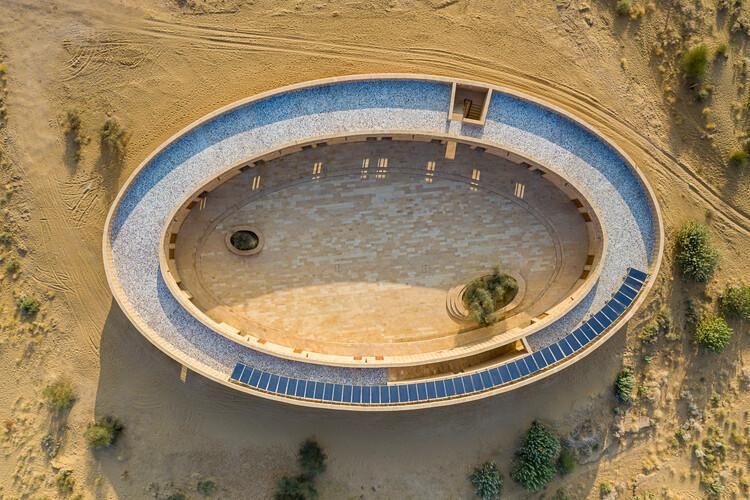
transition doesn’t lie in modern technology, but in vernacular architecture drawing inspiration
from nature (biomimicry) (Altomonte, 2009; Nguyen et al., 2019).

A recent example can be taken from the Rajkumari Ratnavati Girls’ School in Jaisalmer,
Rajasthan. Despite being located in the middle of a desert, it uses no artificial air conditioning.
Its oval shape with perforated walls of local sandstone, assists efficient airflow, which along with
a solar panel canopy on the roof, provide a cooling effect.

 Image Courtesy: archdaily.com

Other architectural techniques to optimise energy utilization include the natural ventilation
systems of a solar chimney (Zhang et al., 2021) and using green walls and roofs to expand the
functional benefits of plants to provide a cooling effect (Manso and Gomes, 2014). Green
architecture design runs parallel to the imagination, and revives ancient yet sustainable ways to
address the issue of climate change.

Citations:

 1) IPCC, 2018: Global warming of 1.5°C. An IPCC Special Report on the impacts of global
 warming of 1.5°C above pre-industrial levels and related global greenhouse gas emission
 pathways, in the context of strengthening the global response to the threat of climate
 change, sustainable development, and efforts to eradicate poverty [V. Masson-Delmotte,
 P. Zhai, H. O. Pörtner, D. Roberts, J. Skea, P.R. Shukla, A. Pirani, W. Moufouma-Okia,
 C. Péan, R. Pidcock, S. Connors, J. B. R. Matthews, Y. Chen, X. Zhou, M. I. Gomis, E.
 Lonnoy, T. Maycock, M. Tignor, T. Waterfield (eds.)]. In Press.
2) Thompson L. G. (2010). Climate change: the evidence and our options. The Behavior
 analyst, 33(2), 153–170. https://doi.org/10.1007/BF03392211

3) NASA. (2021, May 10). Climate Change Evidence: How Do We Know? NASA.
 https://climate.nasa.gov/evidence/.

4) Cubasch, U., D. Wuebbles, D. Chen, M.C. Facchini, D. Frame, N. Mahowald, and J.-G.
 Winther, 2013: Introduction. In: Climate Change 2013: The Physical Science Basis.
 Contribution of Working Group I to the Fifth Assessment Report of the Intergovernmental
 Panel on Climate Change [Stocker, T.F., D. Qin, G.-K. Plattner, M. Tignor, S.K. Allen,
 J. Boschung, A. Nauels, Y. Xia, V. Bex and P.M. Midgley (eds.)]. Cambridge University
 Press, Cambridge, United Kingdom and New York, NY, USA.

5) Usgcrp. “Fourth National Climate Assessment: About This Report.” NCA4, January 1,
 1970. https://nca2018.globalchange.gov/chapter/front-matter-about/.

6) IPCC, 2014: Climate Change 2014: Synthesis Report. Contribution of Working Groups I,
 II and III to the Fifth Assessment Report of the Intergovernmental Panel on Climate
 Change [Core Writing Team, R.K. Pachauri and L.A. Meyer (eds.)]. IPCC, Geneva,
 Switzerland, 151 pp.

7) “2020 Was One of Three Warmest Years on Record.” World Meteorological
 Organization, January 20, 2021. https://public.wmo.int/en/media/press-release/2020-was-
 one-of-three-warmest-years-record.

8) Lindsey, Rebecca, and LuAnn Dahlman. “Climate Change: Global Temperature: NOAA
 Climate.gov.” Climate Change: Global Temperature | NOAA Climate.gov, March 15,
 2021. https://www.climate.gov/news-features/understanding-climate/climate-change-
 global-temperature.

9) “2019 Was 2nd-Hottest Year on Record for Earth Say NOAA, NASA.” 2019 was 2nd-
 hottest year on record for Earth say NOAA, NASA | National Oceanic and Atmospheric
 Administration, January 15, 2020. https://www.noaa.gov/news/2019-was-2nd-hottest-
 year-on-record-for-earth-say-noaa-nasa.

10) Brown, Katherine. “2020 Tied for Warmest Year on Record, NASA Analysis Shows.”
 NASA. NASA, January 14, 2021. https://www.nasa.gov/press-release/2020-tied-for-
 warmest-year-on-record-nasa-analysis-shows

11) University of East Anglia, and Hadley Centre. Accessed July 26, 2021.
 https://crudata.uea.ac.uk/cru/data/temperature/.
12) “Overview: Weather, Global Warming and Climate Change.” NASA. NASA, June 22,
 2021. https://climate.nasa.gov/resources/global-warming-vs-climate-change/.

13) Gaffney, Owen, and Will Steffen. “The Anthropocene Equation.” The Anthropocene
 Review 4, no. 1 (April 2017): 53–61. https://doi.org/10.1177/2053019616688022.

14) Fahey, D.W., S.J. Doherty, K.A. Hibbard, A. Romanou, and P.C. Taylor, 2017: Physical
 drivers of climate change. In: Climate Science Special Report: Fourth National Climate
 Assessment, Volume I [Wuebbles, D.J., D.W. Fahey, K.A. Hibbard, D.J. Dokken, B.C.
 Stewart, and T.K. Maycock (eds.)]. U.S. Global Change Research Program, Washington,
 DC, USA, pp. 73-113, doi: 10.7930/J0513WCR.

15) Wuebbles, D.J., D.W. Fahey, K.A. Hibbard, B. DeAngelo, S. Doherty, K. Hayhoe, R.
 Horton, J.P. Kossin, P.C. Taylor, A.M. Waple, and C.P. Weaver, 2017: Executive
 summary. In: Climate Science Special Report: Fourth National Climate Assessment,
 Volume I [Wuebbles, D.J., D.W. Fahey, K.A. Hibbard, D.J. Dokken, B.C. Stewart, and
 T.K. Maycock (eds.)]. U.S. Global Change Research Program, Washington, DC, USA,
 pp. 12-34, doi: 10.7930/J0DJ5CTG.

16) Tabari, H. Climate change impact on flood and extreme precipitation increases with
 water availability. Sci Rep 10, 13768 (2020). https://doi.org/10.1038/s41598-020-70816-2
17) Wehner, M.F., J.R. Arnold, T. Knutson, K.E. Kunkel, and A.N. LeGrande, 2017:
 Droughts, floods, and wildfires. In: Climate Science Special Report: Fourth National
 Climate Assessment, Volume I [Wuebbles, D.J., D.W. Fahey, K.A. Hibbard, D.J. Dokken,
 B.C. Stewart, and T.K. Maycock (eds.)]. U.S. Global Change Research Program,
 Washington, DC, USA, pp. 231-256, doi: 10.7930/J0CJ8BNN.

18) Smith, Esprit. “The Anatomy of Glacial Ice Loss – Climate Change: Vital Signs of the
 Planet.” NASA. NASA, November 5, 2020. https://climate.nasa.gov/news/3038/the-
 anatomy-of-glacial-ice-loss/.

19) Seneviratne, S.I., N. Nicholls, D. Easterling, C.M. Goodess, S. Kanae, J. Kossin, Y. Luo,
 J. Marengo, K. McInnes, M. Rahimi, M. Reichstein, A. Sorteberg, C. Vera, and X.
 Zhang, 2012: Changes in climate extremes and their impacts on the natural physical
 environment. In: Managing the Risks of Extreme Events and Disasters to Advance
 Climate Change Adaptation [Field, C.B., V. Barros, T.F. Stocker, D. Qin, D.J. Dokken,
 K.L. Ebi, M.D. Mastrandrea, K.J. Mach, G.-K. Plattner, S.K. Allen, M. Tignor, and P.M.
 Midgley (eds.)]. A Special Report of Working Groups I and II of the Intergovernmental
 Panel on Climate Change (IPCC). Cambridge University Press, Cambridge, UK, and
 New York, NY, USA, pp. 109-230.
20) Nunez, Sarahi, Eric Arets , Rob Alkemade , Rik Leemans , and Caspar Verwer.
 “Assessing the Impacts of Climate Change on Biodiversity: Is below 2 °C Enough?”
 ProQuest, June 2019. https://www.proquest.com/docview/2246093860?pq-
 origsite=summon.

21) James, Douglas, and Raghupati Kannan. “Effects of Climate Change on Global
 Biodiversity: a Review of Key Literature.” International Society for Tropical Ecology,
 2009.

22) Dawson, Terence P., Stephen T. Jackson, Joanna I. House, Iain Colin Prentice, and
 Georgina M. Mace. “Beyond Predictions: Biodiversity Conservation in a Changing
 Climate.” Science.Sciencemag.org, April 1, 2011.
 https://science.sciencemag.org/content/332/6025/53.

23) “INDIA Meteorological DEPARTMENT.” IMD. Accessed July 27, 2021.
 https://mausam.imd.gov.in/imd_latest/contents/cs_anomaly_timeseries_temp_rainfall.php
 .

24) Srivastava A.K., Kothawale D.R., Rajeevan M.N. (2017) Variability and Long-Term
 Changes in Surface Air Temperatures Over the Indian Subcontinent. In: Rajeevan M.,
 Nayak S. (eds) Observed Climate Variability and Change over the Indian Region.
 Springer Geology. Springer, Singapore. https://doi.org/10.1007/978-981-10-2531-0_2

25) Mehta, L., Srivastava, S., Adam, H.N. et al. Climate change and uncertainty from ‘above’
 and ‘below’: perspectives from India. Reg Environ Change 19, 1533–1547 (2019).
 https://doi.org/10.1007/s10113-019-01479-7

26) Guntukula, Raju. “Assessing the Impact of Climate Change on Indian AGRICULTURE:
 Evidence from Major Crop Yields.” Wiley Online Library. John Wiley & Sons, Ltd,
 November 8, 2019. https://onlinelibrary.wiley.com/doi/abs/10.1002/pa.2040.

27) Praveen, B., Talukdar, S., Shahfahad et al. Analyzing trend and forecasting of rainfall
 changes in India using non-parametrical and machine learning approaches. Sci Rep 10,
 10342 (2020). https://doi.org/10.1038/s41598-020-67228-7

28) Balasubramanian, M, and V Dhulasi Birundha. “(PDF) Climate Change and Its Impact on
 India.” ResearchGate, September 2012.
 https://www.researchgate.net/publication/256034994_Climate_Change_and_its_Impact_
 on_India.

29) AchutaRao, Krishna, and Friederike Otto. “Changing Climate and Weather.” Oxford
 Scholarship Online. Oxford University Press, December 2019.
https://oxford.universitypressscholarship.com/view/10.1093/oso/9780199498734.001.000
 1/oso-9780199498734-chapter-3.

30) Zhang, M., Katiyar, A., Zhu, S., Shen, J., Xia, M., Ma, J., Kota, S. H., Wang, P., and
 Zhang, H.: Impact of reduced anthropogenic emissions during COVID-19 on air quality
 in India, Atmos. Chem. Phys., 21, 4025–4037, https://doi.org/10.5194/acp-21-4025-2021,
 2021.

31) Kumar, Prashant, Sarkawt Hama, Hamid Omidvarborna, Ashish Sharma, Jeetendra
 Sahani, K.V. Abhijith, Sisay E. Debele, Juan C. Zavala-Reyes, Yendle Barwise, and
 Arvind Tiwari. “Temporary Reduction in Fine Particulate Matter Due To
 'ANTHROPOGENIC EMISSIONS Switch-off' During Covid-19 Lockdown in Indian
 Cities.” Sustainable Cities and Society. Elsevier, July 13, 2020.
 https://www.sciencedirect.com/science/article/pii/S221067072030603X

32) Myhre, G., Myhre, C. E.L., Samset, B. H. & Storelvmo, T. (2013) Aerosols and their
 Relation to Global Climate and Climate Sensitivity. Nature Education Knowledge 4(5):7
33) Le Quéré, C., Jackson, R.B., Jones, M.W. et al. Temporary reduction in daily global CO2
 emissions during the COVID-19 forced confinement. Nat. Clim. Chang. 10, 647–653
 (2020). https://doi.org/10.1038/s41558-020-0797-x
34) Liu, Z., Ciais, P., Deng, Z. et al. Near-real-time monitoring of global CO2 emissions
 reveals the effects of the COVID-19 pandemic. Nat Commun 11, 5172 (2020).
 https://doi.org/10.1038/s41467-020-18922-7
35) Fischer, E.M., Sippel, S. & Knutti, R. Increasing probability of record-shattering climate
 extremes. Nat. Clim. Chang. 11, 689–695 (2021). https://doi.org/10.1038/s41558-021-
 01092-9

36) Jain, P.C. “Greenhouse Effect and Climate Change: Scientific Basis and Overview.”
 Renewable Energy. Pergamon, July 2, 2003.
 https://www.sciencedirect.com/science/article/abs/pii/096014819390108S.

37) Bhargava, Nitin, Bhola R Gurjar, Suman Mor, and Ravindra Khaiwal. “Assessment of
 GHG Mitigation and CDM Technology in Urban Transport Sector of Chandigarh, India.”
 researchgate.net. Environmental Science and Pollution Research, January 2018.
 https://www.researchgate.net/publication/320430032_Assessment_of_GHG_mitigation_a
 nd_CDM_technology_in_urban_transport_sector_of_Chandigarh_India.

38) Altomonte, Sergio. “Climate Change and Architecture: Mitigation and Adaptation
 Strategies for Sustainable Development.” researchgate.net. Journal of Sustainable
 Development, February 2009.
 https://www.researchgate.net/publication/41892454_Climate_Change_and_Architecture_
 Mitigation_and_Adaptation_Strategies_for_a_Sustainable_Development.
39) Lucon O., D. Ürge-Vorsatz, A. Zain Ahmed, H. Akbari, P. Bertoldi, L. F. Cabeza, N.
 Eyre, A. Gadgil, L. D. D. Harvey, Y. Jiang, E. Liphoto, S. Mirasgedis, S. Murakami, J.
 Parikh, C. Pyke, and M.V. Vilariño, 2014: Buildings. In: Climate Change 2014: Mitiga-
 tion of Climate Change. Contribution of Working Group III to the Fifth Assessment
 Report of the Intergovernmental Panel on Climate Change [Edenhofer, O., R. Pichs-
 Madruga, Y. Sokona, E. Farahani, S. Kadner, K. Seyboth, A. Adler, I. Baum, S. Brunner,
 P. Eickemeier, B. Kriemann, J. Savolainen, S. Schlömer, C. von Stechow, T. Zwickel and
 J.C. Minx (eds.)]. Cambridge University Press, Cambridge, United Kingdom and New
 York, NY, USA.
40) Li, Y., Rong, Y., Ahmad, U.M. et al. A comprehensive review on green buildings
 research: bibliometric analysis during 1998–2018. Environ Sci Pollut Res (2021).
 https://doi.org/10.1007/s11356-021-12739-7

41) Nguyen, Anh Tuan, Nguyen Song Ha Truong, David Rockwood, and Anh Dung Tran Le.
 “Studies on Sustainable Features of Vernacular Architecture in Different Regions across
 the World: A Comprehensive Synthesis and Evaluation.” Frontiers of Architectural
 Research. Elsevier, September 20, 2019.
 https://www.sciencedirect.com/science/article/pii/S2095263519300603.

42) Zhang,H.;Tao,Y.;Shi,L. Solar Chimney Applications in Buildings. Encyclopedia 2021, 1,
 409–422. https://doi.org/10.3390/ encyclopedia1020034

43) Manso, Maria, and João Castro-Gomes. “Green Wall Systems: A Review of Their
 Characteristics.” Renewable and Sustainable Energy Reviews. Pergamon, September 20,
 2014. https://www.sciencedirect.com/science/article/abs/pii/S1364032114006637.
You can also read


