An under ice bloom of mixotrophic haptophytes in low nutrient and freshwater influenced Arctic waters

Page created by Gabriel Ingram
 
CONTINUE READING
An under ice bloom of mixotrophic haptophytes in low nutrient and freshwater influenced Arctic waters
www.nature.com/scientificreports

                OPEN             An under‑ice bloom of mixotrophic
                                 haptophytes in low nutrient
                                 and freshwater‑influenced Arctic
                                 waters
                                 Dorte H. Søgaard1,2*, Brian K. Sorrell2, Mikael K. Sejr2,3, Per Andersen3, Søren Rysgaard1,2,4,
                                 Per Juel Hansen5, Annaliina Skyttä6, Signe Lemcke2 & Lars Chresten Lund‑Hansen2
                                 The pelagic spring bloom is essential for Arctic marine food webs, and a crucial driver of carbon
                                 transport to the ocean depths. A critical challenge is understanding its timing and magnitude, to
                                 predict its changes in coming decades. Spring bloom onset is typically light-limited, beginning when
                                 irradiance increases or during ice breakup. Here we report an acute 9-day under-ice algal bloom in
                                 nutrient-poor, freshwater-influenced water under 1-m thick sea ice. It was dominated by mixotrophic
                                 brackish water haptophytes (Chrysochromulina/ Prymnesium) that produced 5.7 g C m−2 new
                                 production. This estimate represents about half the annual pelagic production, occurring below sea
                                 ice with a large contribution from the mixotrophic algae bloom. The freshwater-influenced, nutrient-
                                 dilute and low light environment combined with mixotrophic community dominance implies that
                                 phagotrophy played a critical role in the under-ice bloom. We argue that such blooms dominated by
                                 potentially toxic mixotrophic algae might become more common and widespread in the future Arctic
                                 Ocean.

                                 Satellite-based remote sensing data suggest that annual pelagic net primary production in shelf areas of the Arctic
                                 Ocean has increased by 20% from 1998 to 2009, mainly due to the longer seasonal duration of the ice-free period,
                                 and thus a longer pelagic growth ­season1. The contribution of phytoplankton productivity beneath ice-covered
                                 oceans to annual pelagic net primary production was until recently thought to be negligible, primarily because
                                 of the strong light attenuation by snow and sea i­ ce2. However, this view has recently been challenged by observa-
                                 tions of extensive diatom-dominated under-ice blooms beneath thick melting sea ice or under refrozen l­ eads3–5.
                                 In these studies, diatom- and Phaeocystis-dominated under-ice blooms were triggered by increased under-ice
                                 irradiance due to melting sea ice, refrozen leads and/or melt pond formation (i.e. increased transmittance) and
                                 were fuelled by an excess of nutrients in the under-ice ­waters3–7. However, an improved understanding of the
                                 role, extent and frequency of these extensive under-ice blooms is needed to describe and model future changes
                                 in annual pelagic net primary productivity in the Arctic Ocean.
                                     The Young Sound fjord in NE Greenland is covered by sea ice for most of the year (8–10 months)8 and has a
                                 pronounced summer stratification that impedes nutrient supply from deeper ­waters9,10. The combination of light
                                 limitation by sea ice and terrestrial run-off and low nutrient supply in Young Sound is responsible for its low
                                 annual pelagic net primary productivity (10.3 g C m−2 year−1)8,11, which is low compared to the more productive
                                 Godthåbsfjord on the southwest coast of Greenland (between 84.6 and 139.1 g C m−2 year−1)12. The future annual
                                 pelagic net primary production in Young Sound and across the Arctic Ocean is likely to increase overall as the
                                 ice-free season lengthens. Counteracting the effects of a longer pelagic growing season is, however, the recent
                                 increase in freshwater fluxes from Arctic glaciers and the general freshening of the Young Sound fjord, adjacent

                                 1
                                  Greenland Climate Research Centre (C/O Greenland Institute of Natural Resources), Kivioq 2, Box 570,
                                 3900 Nuuk, Greenland. 2Department of Biology, Arctic Research Centre, Aarhus University, Ole Worms Allé 1,
                                 Build. 1135, 8000 Aarhus C, Denmark. 3Department of Bioscience, Aarhus University, Vejlsøvej 25, 8000 Silkeborg,
                                 Denmark. 4Centre for Earth Observation Science, CHR Faculty of Environment Earth and Resources, University
                                 of Manitoba, Winnipeg, MB, Canada. 5Faculty of Science, Marine Biological Section, University of Copenhagen,
                                 Strandpromenaden 5, 3000 Helsingør, Denmark. 6Faculty of Biological and Environmental Sciences Research
                                 Infrastructure‑Core Facilities, University of Helsinki, Fabianinkatu 33, P.O. Box 3, 00014 Helsinki, Finland. *email:
                                 doso@natur.gl

Scientific Reports |   (2021) 11:2915                | https://doi.org/10.1038/s41598-021-82413-y                                                   1

                                                                                                                                               Vol.:(0123456789)
An under ice bloom of mixotrophic haptophytes in low nutrient and freshwater influenced Arctic waters
www.nature.com/scientificreports/

                                             ­fjords13,14 and the Arctic ­Ocean15,16. This freshening may lead to an intensified stratification and therefore a
                                             weakened vertical supply of n   ­ utrients9,17.
                                                  In this study, we demonstrate for the first time an under-ice bloom driven by mixotrophic brackish-water hap-
                                              tophytes beneath 1-m thick sea ice in a nutritionally dilute environment. These haptophyte genera (Prymnesium
                                              and Chrysochromulina) can be highly toxic to fish and cause severe damage to the aquaculture industry, e.g. in
                                            ­Norway18,19. Harmful blooms of Chrysochromulina spp. have been observed in the Skagerrak/Kattegat18–20, the
                                              Baltic ­Sea21, and in Resolute Bay, ­Canada22, but this is, to our knowledge, the first observation of a high Arctic
                                              under-ice bloom driven by mixotrophic haptophytes.
                                                  Species of Prymnesium and Chrysochromulina are mixotrophs, combining photosynthesis and prey uptake.
                                              This provides them with a competitive advantage in light- and nutrient-limited ­environments23–28. Predation/
                                              grazing provides mixotrophic Chrysochromulina species with organic carbon as an energy source as well as addi-
                                              tional nitrogen, allowing them to grow when light is limiting photosynthesis or dissolved inorganic nutrients in
                                              the sea ice and seawater are ­low25–28. The concentration of haptophytes in the present bloom (~ 20 × 105 cells l−1)
                                             was similar to those cell concentrations found during the peak of harmful Chrysochromulina blooms in the
                                             Skagerrak in southern ­Norway18,19. The indication of a mixotrophic-based bloom suggests that mixotrophic algae
                                              may play an important role in driving the Arctic spring bloom and thus the ecosystem and carbon dynamics in
                                              this area. Some haptophytes tend to be more abundant in less saline waters, as exemplified by records of Chrys-
                                              ochromulina spp. in the low saline (salinity 5–6) Baltic Sea and in the Kattegat (salinity 15–25)19–21. This further
                                             implies that mixotrophic-driven harmful algae blooms might become more common and widespread in a more
                                             freshwater-influenced future Arctic Ocean.

                                            Results and discussion
                                            Sea ice and water column properties. In this study, we document that a mixotrophic-driven under-ice
                                            bloom can be an important seasonal feature of Arctic fjords. An improved insight into the extent and frequency
                                            of these extensive blooms driven by potentially mixotrophic haptophyte species underneath thick sea ice is
                                            fundamental for understanding and modelling future changes in Arctic Ocean pelagic net primary productivity.
                                            If blooms of potentially toxic algae become more common in the Arctic, this might have a large ecological and
                                            socio-economic impact.
                                                The bloom was initiated in nutrient-poor brackish water under 1-m thick sea ice covered with melt ponds
                                            in the Young Sound fjord in Northeast Greenland. Surface melt ponds started to form on the sea ice from snow
                                            meltwater on 11 June 2017 (Fig. 1). Consequently, this period was characterized by a continuous increase in
                                            maximum under-ice PAR from 4.0 µmol photons m−2 s−1 before melt pond formation (8 June 2017; Fig. 1b,c),
                                            to a daily maximum of 127.3 µmol photons m−2 s−1 on 23 June, and similar on 15 July at ice break-up (Fig. 1a).
                                                The continuous increase in melt pond coverage (maximum of ~ 40%) and sea ice thaw (from 0.95 to 0.75 m
                                            thickness) resulted in a nearly full desalination of the sea ice towards 12 July and a concomitant decrease in
                                            under-ice salinity on 9 July (Fig. 1d,e). The sea ice cover broke up on 15 July after which the ice floes were trans-
                                            ported out of the fjord by winds and the tide.

                                            Spring bloom initiated by mixotrophic haptophytes. Prior to the complete brine drainage from melt
                                            ponds and ice melt towards 12 July, primary productivity and algal biomass in the sea ice were five to ten-fold
                                            higher, respectively (up to 5.8 mg C m−2 day−1 and 1.0 mg Chl a m−2) (blue and green bars in Fig. 2a) on 7 July
                                            than after the drainage event on 15 July (sea ice algal productivity of 0.6 mg C m−2 day−1 and algal biomass
                                            of 0.2 mg Chl a m−2; blue and green bars in Fig. 2a). Furthermore, the total algal abundance in the sea ice on
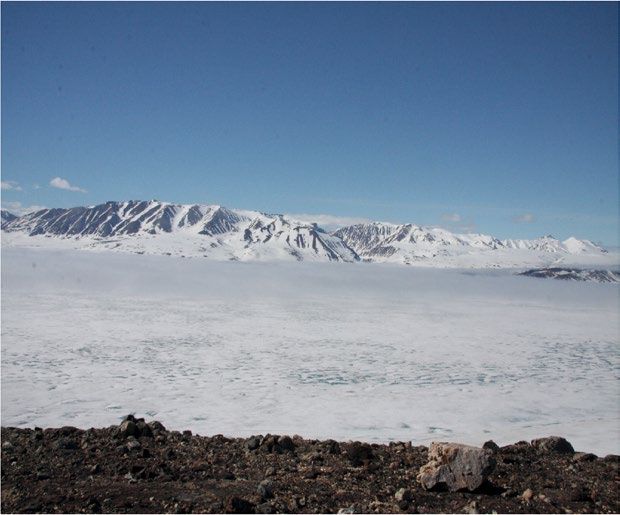
                                            7 July was 12-fold higher (up to 77 × 105 cells l−1) than the under-ice total algal abundance on 8 July (up to
                                            6.2 × 10⁵ cells l−1) (black line in Fig. 3). Based on bulk nutrient concentrations and bulk salinity in the sea ice,
                                            and the expected dilution line, we have calculated whether nutrients were depleted or whether production or
                                            net accumulation of nutrients had occurred at this site (Fig. 4). Sea ice nutrient-bulk salinity plots indicate
                                            accumulation of algal nutrients ­(NOx and ­NH4+) in the sea ice, which indicates that heterotrophic activity may
                                            have played an important role in nutrient re-cycling (Fig. 4). This is supported by the heavily undersaturated ­O2
                                            concentrations in the sea ice (Fig. 2a, solid orange line). Together, these results suggest that the ice-associated
                                            heterotrophic productivity largely exceeded ice-associated primary productivity in this late season sea ice.
                                                The complete drainage event towards 12 July marked the termination of the sea ice photosynthetic activity
                                            (sea ice algal biomass of 0.2 mg Chl a m−2; green bars in Fig. 2a). Therefore, the remaining sea ice algal commu-
                                            nity and algal nutrients present in the ice during melt likely sloughed from the sea ice to the under-ice seawater
                                            during the complete brine drainage towards 12 July. PAM fluorescence measurements verified that the drainage
                                            event ended the sea ice photosynthetic activity in the brine as demonstrated by a rapid decrease in maximum
                                            quantum yield (Fv/Fm) of the sea ice from 0.21 ± 0.07 on 9 July to 0.11 ± 0.04 on 12 July (Table 1).
                                                These numbers are averages for the sectioned (10 cm) entire ice cores, and support the hypothesis that the
                                            complete brine drainage terminated the sea ice photosynthetic activity. Nevertheless, we observed a dramatic
                                            increase in under-ice water maximum quantum yield (Fv/Fm), biomass specific productivity and total algal abun-
                                            dance from 0.12 ± 0.02, 5.80 mg C mg Chl a−1 day−1 and 6.2 × 10⁵ cells l−1 on 9 July to a maximum of 0.35 ± 0.10,
                                            25.40 mg C mg Chl a−1 day−1 and 34 × 105 cells l−1 on 15 July (Table 1 and black line in Fig. 3).
                                                It could be argued that the bloom was simply related to advection of algae from open waters outside the fjord
                                            to the site below the ice, but this is contradicted by the simultaneous decrease in salinity (Fig. 1e). Under-ice
                                            salinities decreased due to rapid ice melt and freshwater drainage from melt ponds, and this signal would have
                                            been strongly dampened with any inflow of higher saline water. Furthermore, under-ice surface (1 m) water
                                            temperatures decreased from 0.3 °C on 9 July to 0.07 °C on 12 July (data not shown) whereas surface waters from
                                            areas with no ice cover are warmer and typically 1–2 °C at this time of ­year9,29,30. The under-ice algae were clearly

          Scientific Reports |   (2021) 11:2915 |                https://doi.org/10.1038/s41598-021-82413-y                                                     2

Vol:.(1234567890)
www.nature.com/scientificreports/

                                    Under-ice PAR (µmol photons m-2 s-1)
                                                                           140
                                                                                     a
                                                                           120
                                                                           100
                                                                           80
                                                                           60
                                                                           40
                                                                           20
                                                                            0
                                                                                1 June     8 June       15 June       22 June                               29 June        5 July        15 July

                                                                                     b                           8 June                                 c                              16 June

                                                                                           Bulk salinity                                                                   Salinity
                                                                                 0          1         2              3                                      0       4   8 12 16 20 24 28 32
                                                                           0                                                                           0
                                                                                     d                                                                          e                   12 July
                                                                           10              7 July
                                                                                                                                                       2
                                                                                                                                                                              8 July
                                                                           20
                                                                                                                                                       4                 9 July
                                                                                                                           Under-ice water depth (m)

                                                                           30
                                  Sea ice depth (cm)

                                                                                                                                                       6
                                                                           40
                                                                                           9 July
                                                                           50                                                                          8
                                                                                 12 July
                                                                           60                                                                          10
                                                                           70
                                                                                                                                                       12
                                                                           80
                                                                                                                                                       14
                                                                           90

                                                                100                                                                                    16

                                  Figure 1.  Physico-chemical properties of sea ice and seawater. Development of (a) under ice irradiance (PAR,
                                  µmol photons m−2 day−1), (b) melt pond coverage on sea ice (~ 0%), (c) melt pond coverage on sea ice (~ 10%),
                                  (d) sea ice bulk salinity and (e) under-ice water salinity in Young Sound, NE Greenland, during the sea ice
                                  melting season in 2017.

Scientific Reports |   (2021) 11:2915 |                                                    https://doi.org/10.1038/s41598-021-82413-y                                                                   3

                                                                                                                                                                                                   Vol.:(0123456789)
www.nature.com/scientificreports/

                    a                                                                                                                                                                                   b
                                      1.0                                       7 Sea ice                                                           7                                                                     1.0                                                                                                       Open water             300
                                                                                                                                                                                                                                                                          Under-ice water                                                                                         450

                                                                                                                      Sea ice break-up

                                                                                                                                                                                                                                                                                                                 Sea ice break-up
                                                                                                                                                                          150
                                                                                                                                                                                                                                                                    800
                                                                                6                                                                   6
                                                                                                                                                                                                                                                                                                                                                           250
                                                                                                                                                                                                                          0.8

                                            Primary production (mg C m-2 d-1)
                                      0.8

                                                                                                                                                                                                                                Primary production (mg C m-2 d-1)
                                                                                                                                                                                                        )
                                                                                                                                                                                                                                                                                                                                                                                  400
                    )
                                                                                                                                                                          125
                                                                                5                                                                   5

                                                                                                                                                                                                        ) and PO43-(µM,
                    ) and PO43-(µM,

                                                                                                                                                                                                                                                                    600                                                                                    200

                                                                                                                                                                                O2 concentration (µM)

                                                                                                                                                                                                                                                                                                                                                                                        O2 concentration (µM)
                                                                                                                                                         Chl a (mg m-2)

                                                                                                                                                                                                                                                                                                                                                                 Chl a (mg m-2)
                                      0.6                                       4                                                                    4                    100                                             0.6                                                                                                                                                     350
                                                                                                                                                                                                                                                                                                                                                           150
                                                                                3                                                                   3                                                                                                               400
                                      0.4                                                                                                                                 75                                              0.4                                                                                                                                                     300

                                                                                                                                                                                                        NOx (µM,
                                                                                                                                                                                                                                                                                                                                                           100
                    NOx (µM,

                                                                                2                                                                    2
                                                                                                                                                                                                                                                                    200
                                                                                                                                                                          50                                                                                                                                                                                                      250
                                      0.2                                       1                                                                    1                                                                    0.2                                                                                                                              50

                                       0                                        0                                                                    0                    25                                               0                                         0                                                                                     0                      200
                                                                                    7 July   9 July   12 July   15 July                                                                                                                                                    8 July       9 July   12 July   15 July                    16 July    17 July

                                                                                                 Figure 2.  Comparison of sea ice and seawater biomass and productivity. Temporal development of (a) sea ice
                                                                                                 integrated primary production in mg C m−2 day−1 (blue bars), integrated Chl a in mg m−2 (green bars), ­NOx
                                                                                                 concentration in µM (black circles), ­PO43- concentration in µM (black triangles) and ­O2 bulk concentration
                                                                                                 in µM (orange squares) and (b) under-ice and open water integrated primary production in mg C m−2 day−1
                                                                                                 (blue bars), integrated Chl a in mg m−2 (green bars), ­NOx concentration in µM at 1 m (black circles), ­PO43-
                                                                                                 concentration in µM at 1 m (black triangles) and ­O2 bulk concentration in µM at 1 m (orange squares). The data
                                                                                                 points represent the average of triplicate samples; error bars indicate SD of the mean.

                                                                                                 acclimated to low light conditions given the relatively low under-ice Ek values (mean of 75 µmol photons m−2 s−1)
                                                                                                 derived from 14C incubations (Fig. S1), in comparison to values for under-ice and open-water phytoplankton
                                                                                                  in other actively blooming populations in Arctic s­ tudies11. In addition, the presence of the haptophytes and the
                                                                                                 taxonomic composition of the under-ice phytoplankton community was different from the most abundant open
                                                                                                 water planktonic species in Young Sound fj   ­ ord31.
                                                                                                      The first record of a Chrysochromulina under-ice bloom was in the brackish Baltic Sea at a salinity of 5–619.
                                                                                                 Similarly, the cells observed in this study were dominated by small (3–5 µm) rounded cells with two long flagella
                                                                                                 and in many cases a long and coiled haptonema typical of e.g., the toxic mixotrophic species Prymnesium polylepis
                                                                                                 and Chrysochromulina leadbeateri. The under-ice bloom provided up to 740 mg C m−2 day−1 of new produc-
                                                                                                  tion (Fig. 2b, blue bars) and was primarily dominated by mixotrophic haptophytes with a relative abundance of
                                                                                                   64%, as compared to 36% relative abundance of typical strictly autotrophic phytoplankton species (Fig. 3). This
                                                                                                  productivity was four times higher than previously measured in open water phytoplankton blooms in Young
                                                                                                  ­Sound8,11. This documents the importance of such under-ice blooms driven by mixotrophic haptophytes (Fig. 3).
                                                                                                 We suggest that under-ice blooms driven by mixotrophic algae are an overlooked succession phenomenon in
                                                                                                 nutrient-depleted and freshwater-influenced environments in the Arctic, which could imply a shift in the domi-
                                                                                                 nant algae species driven by freshening.
                                                                                                      The proposed link between high under-ice productivity and mixotrophy is further supported by the low bulk
                                                                                                 ­NOx concentration in sea ice and under-ice water (< 0.4 µM; Fig. 2a,b, dashed black line). Assuming that nutri-
                                                                                                  ent uptake followed the standard Redfield-Brzezinski ratio of 106C:16N:15Si:1P, N     ­ Ox appears (N:P ratio < 1)
                                                                                                 to have been deficient both in sea ice and seawater (Fig. 2a,b, dashed black lines). Our observations therefore
                                                                                                 challenge the classical view that limiting nutrient concentrations control algal biomass, as we observed an acute
                                                                                                 9-day long under-ice bloom initiated under these nutrient-limited conditions. This suggests that mixotrophy is
                                                                                                 a strategy that might provide a growth benefit in these Arctic brackish waters where nutrients are not stoichio-
                                                                                                 metrically balanced. This is supported by the measurements of biomass-specific productivity and maximum
                                                                                                 quantum yield (Fv/Fm) in Table 1, which verify that microalgae collected from sea ice and under-ice water were
                                                                                                 viable and photosynthetically active under these nutrient-limited conditions. The ongoing freshening of Young
                                                                                                 Sound and the Arctic Ocean with increased stratification and reduced vertical nutrient fluxes can accordingly
                                                                                                 promote mixotrophic-dominated algae blooms. Fundamental knowledge about the mechanisms driving these
                                                                                                 sub-ice blooms is important if we want to forecast their role and future prevalence. Therefore, we suggest that
                                                                                                 further expeditions aim to improve the understanding of these extensive under-ice blooms driven by potentially
                                                                                                 toxic mixotrophic haptophyte species. The consequences for the Arctic marine ecosystems and carbon budgets
                                                                                                 of the shift in the dominant algae to a potentially mixotrophic haptophyte species are important focus areas for
                                                                                                 future studies.

                                                                                                 Materials and methods
                                                                                                 Abiotic parameters. Sampling was conducted during the sea ice melting season in Young Sound, NE
                                                                                                 Greenland (74° 16′ 50 N, 20° 18′ 43 W) in 2017. The under-ice PAR measurements were obtained from a new and
                                                                                                 calibrated Odyssey PAR censor (Dataflow Systems) mounted on a cable and placed 2.4 m below the ice between
                                                                                                 1 June and 7 July 2017. Under-ice PAR time-series were extended to 15 July by applying the transmittance of the
                                                                                                 ice (0.09), determined as ratio between measured CTD and surface PAR from the nearby Zackenberg Research
                                                                                                 station (https​://data.g-e-m.dk/). Sea ice cores were collected on four occasions (7, 9, 12 and 15 July 2017) using a
                                                                                                 MARK II coring system (Kovacs Enterprises). All samples were collected within a 10 m2 (3.2 m × 3.2 m) quadrat.
                                                                                                 Triplicate cores were collected for physical and chemical samples during each sampling and cores for biological
                                                                                                 parameters were sampled in duplicate. The under-ice seawater samples were collected on four occasions (8, 9, 12
                                                                                                 and 15 July 2017) using a Niskin (General Oceanics) water sampler at three depths: 1 m, 15 m and 30 m. The sea

          Scientific Reports |                                                       (2021) 11:2915 |                                    https://doi.org/10.1038/s41598-021-82413-y                                                                                                                                                                                                             4

Vol:.(1234567890)
www.nature.com/scientificreports/

                                                                                                             Sea ice     Under-ice   Under-ice   Under-ice Open water
                                                                                               100
                                                                                                                                                                                   80

                                                                                                                                                                                        Total algal abundance (105 cells l-1)
                                                                                               80

                                                                    Species compostition (%)
                                                                                                                                                                                   60

                                                                                               60

                                                                                                                                                                                   40
                                                                                               40

                                                                                                                                                                                   20
                                                                                               20

                                                                                                0                                                                                  0
                                                                                                               7 July       8 July    12 July      15 July        16 July

                                                                                                        Unidentified flagellates                 Chrysophyceae
                                                                                                        Haptophyta                               Cryptophyta
                                                                                                        Bacillariophyta                          Prasinophyceae
                                                                                                        Dinoflagellata                           Ciliates

                                                                    Figure 3.  Algal community composition. Temporal development of algal species composition (%) in the entire
                                                                    Sea ice column and under-ice water at 1 m (bars) and the total algal abundance (black circles).

                                        0.25                                                                                                                     2.5
                                                   NOX                                                                                                 a                   NH4+                                                                                           b

                                        0.20                                                                                                                     2.0
          Nutrient concentration (µM)

                                        0.15                                                                                                                     1.5

                                        0.10                                                                                                                     1.0

                                        0.05                                                                                                                     0.5

                                          0                                                                                                                       0
                                               0            0.5                                 1.0            1.5            2.0         2.5              3.0         0          0.5                                           1.0         1.5             2.0   2.5         3.0
                                                                                                    Bulk salinity (sea ice)                                                                                                       Bulk salinity (sea ice)

                                                                    Figure 4.  Sea ice nutrient concentrations in relation to salinity. Concentrations of (a) ­NOx and (b) ­NH4+ versus
                                                                    bulk salinity in sea ice prior to the complete brine drainage event. The solid line indicates the expected dilution
                                                                    line predicted from salinity and nutrient concentrations in seawater (15 m depth, salinity of 33). Values below
                                                                    the dilution line indicate nutrient depletion; values above it indicates either production or net accumulation.
                                                                    Data points represents treatment mean ± SD (n = 3).

                                                                    ice cover broke up on 15 July after which the ice floes were transported out of the fjord by winds and tides. Open
                                                                    seawater samples were thereafter collected twice (16 and 17 July 2017) also at three depths: 1 m, 15 m and 30 m.
                                                                    Vertical profiles of temperature, salinity, irradiance (photosynthetically active radiation; PAR) and fluorescence
                                                                    in the under-ice and open seawater column were measured using a CTD profiler (Seabird SBE19plus) equipped
                                                                    with additional sensors for Photosynthetic Active Radiation (Biospherical QSP-2350L Scalar sensor).
                                                                        The air temperature was measured 2 m above the melt pond, and vertical profiles of temperature within the
                                                                    ice were measured using a thermometer (Testo). Light attenuation (used to calculate in situ primary production
                                                                    of the sea ice) was determined using standard m   ­ ethods32. The sea ice sections were placed in plastic containers
                                                                    and transported back to the laboratory in thermally insulated boxes. To determine bulk concentrations of ­O2
                                                                    and ­TCO2 ­(TCO2 was used in this study to calculate potential primary production; Fig. S1) in sea ice, three sea
                                                                    ice cores were cut into 10 cm sections and placed immediately in gas-tight plastic ­bags33 and transported back to
                                                                    the laboratory in thermally insulated boxes. T ­ CO2 and O­ 2 were determined using standard m­ ethods33,34. Average
                                                                    values of triplicate samples are reported.
                                                                        In the laboratory, sea ice sections were weighed for later determination of density and then melted in the dark
                                                                    over a 2-day period at 3 ± 1 °C. Conductivity of melted sea ice was measured (Thermo Orion-star with an Orion
                                                                    013610MD conductivity cell) and converted to bulk s­ alinity35. Average values of triplicate samples are reported.
                                                                        Unfiltered under-ice and open seawater was transferred by gastight Tygon tubing to tubes (12 ml Exetainer)
                                                                    for ­TCO233 and ­O234 analysis following the standard analysis procedure.

Scientific Reports |                                     (2021) 11:2915 |                                                 https://doi.org/10.1038/s41598-021-82413-y                                                                                                           5

                                                                                                                                                                                                                                                                        Vol.:(0123456789)
www.nature.com/scientificreports/

                                                              Under-ice and open water                      Sea ice
                                             Sampling date    Biomass specific productivity   Fv/Fm         Biomass specific productivity   Fv/Fm
                                             7 July           –                               –             5.53                            0.22 ± 0.03
                                             8 July           4.40                            0.24 ± 0.04   –                               –
                                             9 July           5.80                            0.12 ± 0.02   5.87                            0.21 ± 0.03
                                             12 July          6.25                            0.13 ± 0.01   5.61                            0.11 ± 0.04
                                             15 July          25.40                           0.35 ± 0.10   3.95                            0.13 ± 0.05
                                             16 July          10.96                           0.21 ± 0.07   –                               –
                                             17 July          10.60                           0.22 ± 0.06   –                               –

                                            Table 1.  Algal productivity and photobiology. Biomass specific productivity (mg C mg Chl a−1 day−1) and
                                            algal photobiology from 7 to 17 July in under-ice water (1 m), open seawater (1 m) and sea ice. Data points
                                            represents treatment mean ± SD (n = 3).

                                            Chemical and biotic parameters. Triplicate melted sea ice cores (10 cm sections) and under-ice and
                                            open seawater samples (1 m, 15 m, 30 m) were analysed for inorganic nutrients ­(PO43−, ­NO2− + NO3− ­(NOx)
                                            and ­NH4+), Chlorophyll a (Chl a) and photosynthetic activity. Duplicate samples were collected for primary
                                            production and algal abundance. Melting of sea ice was carried out following the protocols of Lund-Hansen
                                            et al.17 to avoid osmotic shock during ice melt, and photosynthetic and photobiological parameters are therefore
                                            maximum values.
                                                 Potential primary production was determined in melted sea ice cores cut into three sections (top, middle and
                                            bottom), and under-ice and open seawater at three depths (1 m, 15 m and 30 m) incubated for 3.15–6.49 h at
                                            1 ± 1 °C at eleven laboratory light intensities (299 ± 128, 131 ± 35, 97 ± 47, 62 ± 28, 47 ± 24, 35 ± 19, 27 ± 15, 17 ± 8,
                                            13 ± 7, 8 ± 6, 0 µmol photons m−2 s−1) using the H ­ 14CO3− incubation ­technique36, and following the primary pro-
                                            duction ­procedure . The potential primary production (µg C l−1 h−1) measured in the laboratory for different
                                                                 37

                                            sea ice depths was plotted against the eleven laboratory light intensities and fitted to the f­ unction38 (Fig. S1). An
                                            estimate of primary production was calculated for each hour and sea ice depth using hourly in situ PAR hourly
                                            averages received through the Greenland Ecosystem Monitoring Programme (https​://data.g-e-m.dk/). Average
                                            values of duplicate samples are reported.
                                                 For determining Chl a concentrations in melted sea ice and under-ice and open seawater, a known volume was
                                            filtered onto 25-mm Whatman GF/F filters. The filters were extracted for 18 h in 96% ­ethanol39 and analysed fluo-
                                            rometrically (TD-700, Turner Designs) before and after addition of 200 µl of a 1 M HCl solution. The fluorometer
                                            was calibrated against a pure Chl a standard (Turner Designs). Average values of triplicate samples are reported.
                                                 For determining inorganic nutrient concentrations, triplicate samples of melted sea ice, under-ice water and
                                            seawater without ice were filtered through 0.45 µm filters (Q-Max GPF syringe filters) into 6.5 ml scintillation
                                            vials and frozen (− 19 °C) for further analysis of ­PO43−, ­NOx and ­NH4. The concentrations were measured on
                                            a Seal QuAAtro autoanalyzer using standard colorimetric methods. Average values of triplicate samples are
                                            reported.
                                                 Pulse amplitude modulated (PAM) fluorometry (Phyto-PAM Phytoplankton Analyzer, Heinz Waltz GmbH,
                                            Germany) was applied to measure algae photoacclimation and photosynthetic activity in triplicate samples
                                            from melted sea ice core sections (10 cm), under-ice, and at depths (1 m) in open seawater with no ice. All PAM
                                            measurements were conducted in the dark to keep algae dark-incubated and the photosynthetic parameters
                                            were derived by means of the rapid light curve ­technique40 and the curve-fitting ­algorithm41. Average values of
                                            triplicate samples of maximum quantum yield (Fv/Fm) are reported. Temperature in a snow bath with measuring
                                            unit was controlled by an US-T Temperature Control Unit and kept close to 1 °C. Temperature of the samples
                                            was measured by a thermometer (LT-101, Lab Thermometer IP65, TFA Dostmann/Wertheim).
                                                 For algal abundance measurements, samples of melted sea ice and under-ice and open seawater were fixed
                                            with acidic Lugol’s solution (final concentration of 1%) and stored dark and cold (3 ± 1 °C). Algal cells were
                                            identified and counted from light-microscopy analyses using the Utermöhl sedimentation technique. Algae cells
                                            were analysed within 2 months of collection, average values of duplicate samples are reported.
                                                 Using light microscopy, it is not possible to identify small naked flagellates such as the haptophytes to species
                                            level. The taxonomy of the haptophytes is currently under revision, and the bloom forming mixotrophic species
                                            formerly known as Chrysochromulina polylepis, which is a typical haptophyte with a long and coiling haptonema,
                                            has been transferred to the genus Prymnesium.

                                            Data availability
                                            The data produced during the current study are available from corresponding author based on a reasonable
                                            request.

                                            Received: 23 October 2020; Accepted: 20 January 2021

                                            References
                                             1. Arrigo, K. R. & Dijken, G. L. Secular trends in Arctic Ocean net primary production. J. Geophys. Res. Oceans. 116, C09011 (2011).
                                             2. Thomas, D. N. Sea Ice Ch 4 (Wiley Blackwell, Oxford, 2017).

          Scientific Reports |   (2021) 11:2915 |                     https://doi.org/10.1038/s41598-021-82413-y                                                               6

Vol:.(1234567890)
www.nature.com/scientificreports/

                                   3.   Arrigo, K. R. et al. Massive phytoplankton blooms under Arctic sea ice. Science 336, 1408–1408 (2012).
                                   4.   Assmy, P. et al. Leads in Arctic pack ice enable early phytoplankton blooms below snow-covered sea ice. Sci. Rep. 7, 40850 (2016).
                                   5.   Horvat, C. et al. The frequency and extent of sub-ice phytoplankton bloom in the Arctic Ocean. Sci. Adv. 3, e1601191 (2017).
                                   6.   Ardyna, M. et al. Environmental drivers of under-ice phytoplankton bloom dynamics in the Arctic Ocean. Elem. Sci. Anth. 8, 30
                                        (2020).
                                   7.   Ardyna, M. et al. Under-ice phytoplankton blooms: Shedding light on the “invisible” part of Arctic primary production. Front.
                                        Mar. Sci. 7, 608032 (2020).
                                   8.   Rysgaard, S. & Glud, R. N. Carbon cycling in Arctic marine ecosystems: Case study Young Sound (ed. Rysgaard, S. & Glud, R. N.)
                                        62–94 (Meddelelser om Grønland, Bioscience Vol 58, Copenhagen, Denmark, the Commission for Scientific Research in Green-
                                        land, 2007).
                                   9.   Meire, L. et al. Marine-terminating glaciers sustain high productivity in Greenland fjords. Glob. Chang. Biol. 23, 5344–5357 (2017).
                                  10.   Randelhoff, A. et al. Pan-Arctic Ocean primary production constrained by turbulent nitrate fluxes. Front. Mar. Sci. 7, 150 (2020).
                                  11.   Holding, J. M. et al. Seasonal and spatial patterns of primary production in a high-latitude fjord affected by Greenland Ice Sheet
                                        run-off. Biogeosciences 16, 3777–3792 (2019).
                                  12.   Juul-Pedersen, T. et al. Seasonal and interannual phytoplankton production in a sub-Arctic tidewater outlet glacier fjord, SW
                                        Greenland. Mar. Ecol. Prog. Ser. 524, 27–38 (2015).
                                  13.   Sejr, M. K. et al. Evidence of local and regional freshening of Northeast Greenland coastal waters. Sci. Rep. 7, 13183 (2017).
                                  14.   Boone, W. et al. Circulation and fjord-shelf exchange during the ice-covered period in Young Sound-Tyrolerfjord, Northeast
                                        Greenland (74°N). Estuar. Coast. Shelf Sci. 194, 205–216 (2017).
                                  15.   Haine, T. W. N. et al. Arctic freshwater export: Status, mechanisms, and prospects. Glob. Planet Change 125, 13–35 (2015).
                                  16.   Carmack, E. C. et al. Freshwater and its role in the Arctic Marine System: Sources, disposition, storage export, and physical and
                                        biogeochemical consequences in the Arctic and global ocean. J. Geophys. Res. Biogeosci. 121, 675–717 (2015).
                                  17.   Lund-Hansen, L. C. et al. Will low primary production rates in the Amundsen Basin (Arctic Ocean) remain low in a future ice-free
                                        setting, and what governs this production?. J. Mar. Syst. 205, 103287 (2020).
                                  18.   Dahl, E., Bagøien, E., Edvardsen, B. & Stenseth, N. C. The dynamics of Chrysochromulina species in the Skagerrak in relation to
                                        environmental conditions. J. Sea. Res. 54, 15–24 (2005).
                                  19.   Hansen, P. J., Nielsen, T. G. & Kaas, H. Distribution and growth of protists and mesozooplankton during a bloom of Chrysoch-
                                        romulina spp. (Prymnesiophyceae, Prymnesiales). Phycologia 34, 409–416 (1995).
                                  20.   Nielsen, T. G., Kiørboe, T. & Bjørnsen, P. K. Effects of a Chrysochromulina polylepis subsurface bloom on the planktonic community.
                                        Mar. Ecol. Prog. Ser. 62, 21–35 (1990).
                                  21.   Hällfors, G. & Niemi, Å. A Chrysochromulina (Haptophyceae) bloom under the ice in the Tvärminne Archipelago, southern coast
                                        of Finland. Acta Soc. Fauna Flora Fenn. 50, 89–104 (1974).
                                  22.   Manton, I. Chrysochromulina tenuispine sp. nov. from arctic Canada. Br. Phycol. J. 13, 227–234 (1978).
                                  23.   Green, J. C. & Leadbeater, B. S. C. The Haptophyte Algae ch. 13 (Systematics Association, London, 1994).
                                  24.   Hansen, P. J. & Hjorth, M. Growth and grazing responses of Chrysochromulina ericina (Prymnesiophyceae): The role of irradiance,
                                        prey concentration and pH. Mar. Biol. 141, 975–983 (2002).
                                  25.   Anderson, R., Charvet, S. & Hansen, P. J. Mixotrophy in chlorophytes and haptophytes—Effect of irradiance, macronutrient
                                        micronutrient and vitamin limitation. Front. Microbiol. 9, 1704 (2018).
                                  26.   Anderson, R. & Hansen, P. J. Meteorological conditions induce strong shifts in mixotrophic and heterotrophic flagellate bacterivory
                                        over small spatio-temporal scales. Limnol. Oceanogr. 9999, 1–11 (2019).
                                  27.   McKie-Krisberg, Z. M., Gast, R. J. & Sanders, R. W. Physiological responses of three species of Antarctic mixotrophic phytoflagel-
                                        lates to changes in light and dissolved nutrients. Microbiol. Ecol 70, 21–29 (2015).
                                  28.   McKie-Krisberg, Z. M., Sanders, R. W. & Gast, R. J. Evaluation of mixotrophy-associated gene expression in two species of polar
                                        marine algae. Front. Mar. Sci. 5, 273 (2018).
                                  29.   Rysgaard, S., Nielsen, T. G. & Hansen, B. W. Seasonal variation in nutrients, pelagic primary production and grazing in a high-
                                        Arctic coastal marine ecosystem, Young Sound, Northeast Greenland. Mar. Ecol. Prog. Ser. 179, 13–25 (1999).
                                  30.   Bendtsen, J., Mortensen, J. & Rysgaard, S. Seasonal surface layer dynamics and sensitivity to runoff in a high Arctic fjord (Young
                                        Sound/Tyrolerfjord, 74°N). J. Geophys. Res. Oceans. 119, 1–18 (2014).
                                  31.   Krawczyk, D. W. et al. Spatial and temporal distribution of planktonic protists in the East Greenland fjord and offshore waters.
                                        Mar. Ecol. Prog. Ser. 538, 99–116 (2015).
                                  32.   Søgaard, D. H., Deming, J. W., Meire, L. & Rysgaard, S. Effects of microbial processes and C   ­ aCO3 dynamics on inorganic carbon
                                        cycling in snow-covered Arctic winter sea ice. Mar. Ecol. Prog. Ser. 611, 31–44 (2019).
                                  33.                                                                                          ­ O2 system dynamics. Cryosphere 7, 707–718
                                        Rysgaard, S. et al. Ikaite crystal distribution in winter sea ice and implications for C
                                        (2013).
                                  34.   Søgaard, D. H. et al. Autotrophic and heterotrophic activity in Arctic first-year sea ice: Seasonal study from Malene Bight, SW
                                        Greenland. Mar. Ecol. Prog. Ser. 419, 31–45 (2010).
                                  35.   Grasshoff, K., Kremling, K. & Ehrhardt, M. Methods of Seawater Analysis (WILEY-VCH Verlag GmbH, Weinheim, 1999).
                                  36.   Steemann-Nielsen, E. The use of radio-active carbon (­ C14) for measuring organic production in the sea. ICES J. Mar. Sci. 18,
                                        117–140 (1952).
                                  37.   Søgaard, D. H. et al. The relative contributions of biological and abiotic processes to carbon dynamics in subarctic sea ice. Polar
                                        Biol. 36, 1761–1777 (2013).
                                  38.   Platt, T., Gallegos, C. L. & Harrison, W. G. Photoinhibition of photosynthesis in natural assemblages of marine phytoplankton. J.
                                        Mar. Res. 38, 687–701 (1980).
                                  39.   Jespersen, A. M. & Christoffersen, K. Measurements of chlorophyll-a from phytoplankton using ethanol as extraction solvent.
                                        Arch. Hydrobiol. 109, 445–454 (1987).
                                  40.   Ralph, P. J. & Gademann, R. Rapid light curves: A powerful tool to assess photosynthetic activity. Aquat. Bot. 82, 222–237 (2005).
                                  41.   Jassby, A. D. & Platt, T. Mathematical formulation of the relationship between photosynthesis and light for phytoplankton. Limnol.
                                        Oceanogr. 21, 540–547 (1976).

                                  Acknowledgements
                                  We thank Bjarne Jensen and Kunuk Lennert for outstanding assistance in the field and laboratory. We greatly
                                  appreciate the data provided by Greenland Ecology Monitoring (https​://data.g-e-m.dk/). Co-authors are listed
                                  based on weight of contribution. This study received financial support from the Arctic Research Centre of Aarhus
                                  University and the Commission for Scientific Investigations in Greenland (KVUG). D.H.S. was supported finan-
                                  cially by KVUG and the DANCEA project “In situ pH and pCO2 in more details”. M.K.S. was supported by the
                                  DANCEA project “De-icing Arctic Coasts”. S.R. was supported by NSERC in Canada. This is a contribution to
                                  the Arctic Science Partnership (ASP) asp-net.org.

Scientific Reports |   (2021) 11:2915 |                     https://doi.org/10.1038/s41598-021-82413-y                                                                    7

                                                                                                                                                                    Vol.:(0123456789)
www.nature.com/scientificreports/

                                            Author contributions
                                            D.H.S., M.K.S. and L.C.L-H. designed the study. D.H.S. and A.S. conducted the sampling in Young Sound in
                                            2017. D.H.S., A.S., S.L. and P.A. performed laboratory analyses. D.H.S., P.J.H., P.A., L.C.L-H. and B.K.S. analysed
                                            data. D.H.S., L.C.L-H., B.K.S., S.R. and P.J.H. drafted the manuscript. All authors contributed critically to the
                                            drafts and gave final approval for publication.

                                            Competing interests
                                            The authors declare no competing interests.

                                            Additional information
                                            Supplementary Information The online version contains supplementary material available at https​://doi.
                                            org/10.1038/s4159​8-021-82413​-y.
                                            Correspondence and requests for materials should be addressed to D.H.S.
                                            Reprints and permissions information is available at www.nature.com/reprints.
                                            Publisher’s note Springer Nature remains neutral with regard to jurisdictional claims in published maps and
                                            institutional affiliations.
                                                          Open Access This article is licensed under a Creative Commons Attribution 4.0 International
                                                          License, which permits use, sharing, adaptation, distribution and reproduction in any medium or
                                            format, as long as you give appropriate credit to the original author(s) and the source, provide a link to the
                                            Creative Commons licence, and indicate if changes were made. The images or other third party material in this
                                            article are included in the article’s Creative Commons licence, unless indicated otherwise in a credit line to the
                                            material. If material is not included in the article’s Creative Commons licence and your intended use is not
                                            permitted by statutory regulation or exceeds the permitted use, you will need to obtain permission directly from
                                            the copyright holder. To view a copy of this licence, visit http://creat​iveco​mmons​.org/licen​ses/by/4.0/.

                                            © The Author(s) 2021

          Scientific Reports |   (2021) 11:2915 |                https://doi.org/10.1038/s41598-021-82413-y                                                  8

Vol:.(1234567890)
You can also read