2021 Feasibility of Integrated Fish and Algae Offshore Farms
←
→
Page content transcription
If your browser does not render page correctly, please read the page content below
SJWP Israel
Entry
2021

              Feasibility of Integrated Fish
              and Algae Offshore Farms

              Submitted by Mr. Imri Ketzef,
              Ramot Yam High-School, Michmoret
              Academically advised by Mr. Raphael Yavetz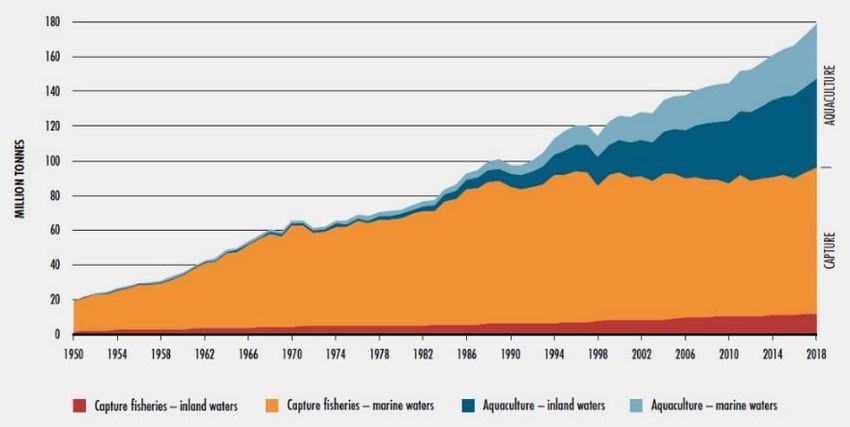
2021 SJWPI Entry

                                                      TABLE OF CONTENT

Abstract .......................................................................................................................................... 4

Introduction ................................................................................................................................... 5
    Growing Conditions at Sea .................................................................................................. 10

Research Methods ...................................................................................................................... 11
    Streams Data .......................................................................................................................... 11
    Calculating Food Quantities................................................................................................. 12
    Formula for Calculating Algae Growth .............................................................................. 12
    Chlorophyll a concentration................................................................................................. 12
    Annual water consumption in the various growing industries ........................................ 13
    Organic Matter ....................................................................................................................... 13

Results .......................................................................................................................................... 13

Discussion ................................................................................................................................... 15
    What Is the Effect of Directional Position, in Relation to the Fish Cages, on Growth and
    Chemical Composition of the Ulva Algae?.............................................................................. 16

    Conclusions and Suggestions for Further Research.......................................................... 17

Bibliography................................................................................................................................ 18

                                                                         2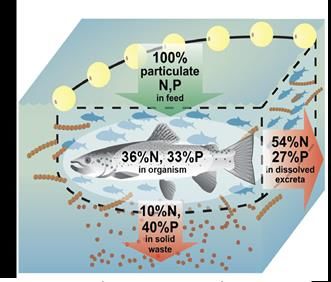
2021 SJWPI Entry

Figures list:

Figure 1: Fish supply sources worldwide (FAO, 2020) ...................................................... 5

Figure 3: Nutrients (N, P) emitted from fish net cage (Lex Bouwman, et al. 2013) .......... 7

Figure 4: Integrated Multi Trophic Aquaculture – IMTA model (Muki Spiegel, 2014) .... 8

Figure 5: Ulva sp. ................................................................................................................ 9

Figure 6: Light absorption in oceanic water (CEUH, 2021) ............................................. 10

Figure 8: Algae net devices, similar to the ones I used in my research (Photography:
Zollman M) ........................................................................................................................ 11

Figure 7: Fish net cage TLC model (RefaMed, 2015). ..................................................... 11

Tables list:

Table 1: Calculation of the nitrogen amount assimilated in fish according to the model of
Lupatsch & Kissil (1998). .............................................................................................................. 12

Charts list:

Chart 1: Hadera Monitoring Station Progressive Vector Diagram ................................................ 13

Chart 2: The effect of depth and direction on Ulva’ growth .......................................................... 14

Chart 3: The effect of depth and direction on the percentage of organic matter in Ulva ............... 14

                                                                    3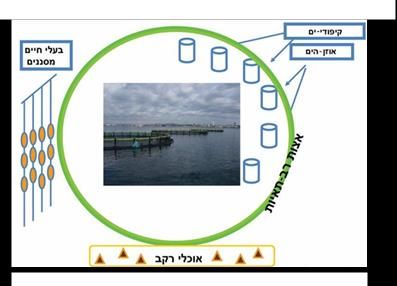
2021 SJWPI Entry

Abstract
The increase of the world's population, which expected to rise up to 9 billion by 2050,
along with the rise of the awareness of healthy eating habits, have led to a higher demand
for protein and healthy fatty acids derived from the ocean, specifically fish and algae, due
to their high nutritional value. The increasing demand has led to over fishing and
destruction of habitats. To deal with this problem mariculture industry, which allows to
reduce fishery while still meeting the growing demands has developed rapidly.

This development also allows us to save fresh water as it curbs the volume of production
of fish in freshwater aquaculture. It also allows to reduce the volume of meat and poultry
production, which requires vast amounts of fresh water (400-15,500 liters taken to produce
1 kg of meat). Moreover, algae, which hardly needs fresh water for its cultivation, may in
turn serve as substitutes for vegetables such as lettuce and chicory in our diet, which also
leads to water saving. Yet, as any growing industry, mariculture can also cause water
pollution by releasing nitrogen, as an excess of fish food, rich in protein, and fish
excretions. The aim of my research is to use these polluting compounds as a fertilizer
for algae, which is able to absorb them, thus dealing with the pollution and improving
algae cultivation.

Consequently, in my research I examined the potential of algae cultivation in close
proximity to marine offshore fish cages, creating an integrated farm model, which produces
animal and plant protein, using negligible quantities of fresh water-resources. I have
attached net devices,1 designed for growing Ulva algae, in four locations for a total of seven
days, placing them on the northern and southern sides of the offshore fish cage, at 7 and
11.5 meters under water, utilizing natural flow and natural lighting conditions in order to
find optimal conditions for algae growth. At the beginning and the end of the experiment I
weighed the algae, measured organic matter production and calculated nitrogen uptake by
measuring chlorophyll-a content.

The results proved Ulva algae to be suitable for use as a bio filter, which reduces the
environmental negative impact of offshore fish cages by assimilating excess nutrients and
nitrogenous compounds emitted from fish production. Cultivation of algae and fish in an
integrated system may reduce inland beef, poultry, and vegetable agriculture, thus
significantly reducing the use of fresh water, potentially saving large volumes of water.

1
    Developed by Dr. Meiron Zollmann of the faculty of engineering, Tel Aviv University (Chemodanov, A Et al. 2019)
                                                             4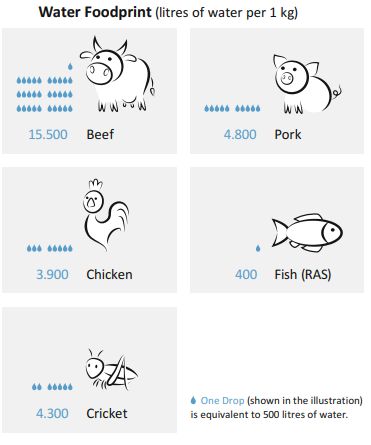
2021 SJWPI Entry

Introduction
Water is an essential resource for sustaining life. In recent decades, however, urbanization
processes, increased irrigation of agriculture inland and changing climate patterns have led
to a substantial and ongoing water shortage in various parts of the world. Conversely, it
should be noted that technological advances taking place nowadays, may provide human
population with various solutions for dealing with water crises (Shiri Spector-Ben-Ari,
2017).

The demand for fresh water has been growing globally at more than twice the rate of the
population’s growth rate during the last century. Growing number of areas are reaching the
point where water services cannot be sustainably delivered, especially in arid regions (UN-
Water, 2021). According to the World Bank, nowadays, 70% of global freshwater is being
used for agricultural purposes (Khokhar, 2017).

The growth of public awareness in recent years, regarding the need for animal protein and
the depletion of fishing catches on one hand, and the increase in demand for food from the
sea on the other hand, have contributed to accelerate the development of the mariculture
industry, at a rate of 5-10% per year. For instance, it is forecasted that by 2030, production
of edible fish in the Mediterranean will be over one million metric tons/year.

Beginning 1990, the growing
rate of fishing was halted due
to overfishing and harm
caused     to     natural        fish
populations          (figure      1).
Concurrently,          continuous
growth     of     farmed         fish
population       took          place.
However,        presently,       the
                                           Figure 1: Fish supply sources worldwide (FAO, 2020)
production      of     fish     from
inland, fresh water-based sources pools, is greater than from seawater sources. The extent
of mariculture is still a small part of the global fish supply due to the complexity of raising
fish in marine cages. On the other hand, increasing agriculture-sourced food supply as the
one investigated here leads to a reduction in fishing and finding of a solution to overfishing,
along with reducing freshwater growth and thus reducing fresh water consumption.

                                              5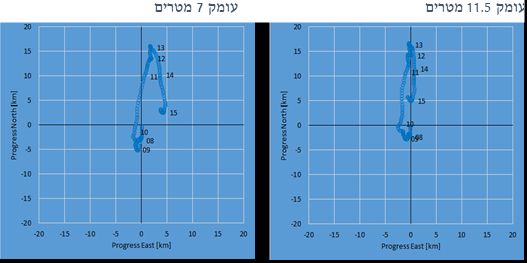
2021 SJWPI Entry

                                                                          Comparison of the water footprint
                                                                          of various animal industries,
                                                                          show vast water consumption
                                                                          differences among sectors. The
                                                                          fin fish in this report (figure 2)
                                                                          were cultured in a recirculating
                                                                          aquaculture system using fresh
                                                                          water (Joyce A. et al, 2019).

                                                                          In contrast with the water food
                                                                          prints of Fig. 2, the ones of
                                                                          vegetables is much lower, e.g., the
                                                                          spinach aquatic footprint is 292
                                                                          l/kg and lettuce water footprint
                                                                          was   measured       at    237    l/kg
                                                                          (Mekonnen, M. M. et al, 2011).

Figure 2: Animal protein sources water footprint (Joyce A. et al, 2019)   Marine fish cages are floating
                                                                          devices    (Fig.     7),   used    for
intensive growth of edible fish. The concept of marine offshore fish farming is to use the
sea as a large buffer to maintain favorable conditions for the fish. (carrying away waste
emitted, supplying oxygen-rich water, maintaining natural temperature and photoperiod
conditions) without the need to invest additional energy. Yet, fish cages, being man-made
artificial installations in the sea, have ecological effects. Thus, the zone neighboring the
cage is affected by uneaten food and fish excrement. In fact, fish cages produce a variety
forms of waste - both particulate and dissolved - that flows directly into the marine
environment.

                                                           6
2021 SJWPI Entry
Figure 3 depicts the dispersion
of nutrients from a cage, based
on studies conducted on salmon
and rainbow trout species.
According to various studies
and models of fish farming in
marine cages, fish assimilate
22% - 36% of the nitrogen in the
food, while the rest is excreted
into the water as dissolved
nitrogen (54% - 61%), and as
Figure 2: Nutrients (N, P) emitted from fish net cage
particulate matter that sinks to
(Lex Bouwman, et al. 2013)
the bottom (10% - 17%). Even
though fish considered to have a good food conversion rate, more than half of the nitrogen
and phosphorus of the food is released into the marine environment as dissolved or
particulate compounds. This nutrient-rich flow can cause various environmental effects.
The main effects, around fish cages, include dissolved nutrient (N, P) release that can
increase productivity up to 150 meters downstream, thus cause HAB (harmful algal
blooms), hypoxia, change in biodiversity and reduce water quality (Lex Bouwman, et al.
2013; Lupatsch I., & Kissil, G. W., 1998); (Lachman E., 2007; Shanin A., 2013).
Still, according to models of secretions dispersal from fish cages, it was proved that the
environmental impacts have been shown to be much smaller than those due to growing fish
at land-based facilities, which consume fresh water and soil resources, creating polluting
burdens, odors and visual hazards (Noam Moses, 2014). Thus, raising fish in a marine
environment may reduce the volume of growing fish in land-based facilities, while
reducing fishing pressure on natural fish populations.
72021 SJWPI Entry
Though the environmental effect of growing fish in cages is less detrimental than from
other methods, it is desirable to reduce the anthropogenic effects of fish farming in offshore
cages. This can be achieved by assimilation by marine organisms, and fish secretions and
nutrients emitted from the fish cage can be turned into a secondary growth resource for
photosynthetic organisms as well as filter feeders, as shown in fig. 4 (Muki Spiegel, 2014).
Aquacultural effluents from cages are rich in nutrients and carbon dioxide. Furthermore,
they are low in oxygen due to the fish's respiration, which consumes oxygen and emits
carbon dioxide. Algae, on the other hand, utilize the carbon dioxide and nutrients in a
process of photosynthesis, thus they re-enrich the water with oxygen. The fish lower the
pH level in the water, while the algae raise it. It is seen that one form of life may contribute
to the sustenance of the other
Sea Urchins form’s life processes. The
Filter feeders Abalone nutrients are used by the algae in
assimilation in two ways: (i)
Photosynthesis and (ii) Protein
anabolism. In photosynthesis,
the organic materials formed are
used to produce the energy
essential for further growth
processes and the production of
Detritivours
valuable compounds. In order to
Figure 3: Integrated Multi Trophic Aquaculture – IMTA model
absorb the nitrogen from the
(Muki Spiegel, 2014)
environment, the Ulva has a
large number of membranes in the thallus, which is characterized by a high surface-area
relative to volume, and gives it a high ammonia absorption rate. Ammonia is consumed by
diffusion, compared to nitrate which is distributed by transporters in the cell membrane
(Noam Rosinsky, 2019).
Since algae are primary producers, at the base of the marine food chain, the entire food
cycle rests on them. Thus, they are of distinct ecological significance. For a long time, algae
collected from nature have been part of regular human diet in Africa, Central and South
America and Southeast Asia. Algaculture, however, has developed significantly only
during the last few decades.
82021 SJWPI Entry
Growing algae on land produces almost no waste, other than the water used for growing
them, which nevertheless may be reused. Like higher plants, algae use solar energy to turn
atmospheric CO2, which is dissolved into biomass and oxygen, through the process of
photosynthesis. However, in order to produce biomass, algae need additional elements such
as nitrogen, phosphorus and certain other micro-elements (Adi Levy, 2016). Besides, land
based cultivation entails use of areas which is lost for other uses.
In addition to using algae as a food source, they can also provide various products for
different industries such as biotechnology, pharmaceutics, cosmetics and for renewable
energies such as bioethanol. Nowadays, bioethanol is mainly produced using terrestrial
crops like corn, that requires vast amounts of fresh water, which could be used, instead, for
food production.
Algae grown in an integrated aquaculture system, can be used for the production of
bioethanol due to its fast growth rate and its high carbohydrates and lipids concentrations
(Alvaro, I. et al, 2015) while using a negligible amount of fresh water for growing such
plants.
An initial assessment carried out in Israel by Goldberg and Moses (2015), indicates that an
increase of 100,000 metric tons of fish growing in fish cage would secrete a quantity of
nitrogen that could be consumed by about 405,000 metric tons of algae. This volume of
algae can produce about 81,000 metric tons of bioethanol (constituting about 3% of the
fuel consumption used currently by vehicular transportation in Israel), while utilizing a
maritime area of about 160 square kilometers (a 0.5% of Israel's maritime area) (Ofira
Ayalon et al, 2015).
The alga considered here namely Ulva is a green one, common to the littoral zone. The
Ulva is one of the most common species of algae in the world and can be found in tropical
and subtropical marine environments. In winter, there is a significant increase in its
biomass. Ulva can grow attached to a bed
using a flat grip, rhizoids, or grow utterly
detached from any surface. An individual
Ulva length can reach up to 50 cm. The
actual size of an individual algae is the result
of many biotic causes, and the algae is the
preferred nutrition of many herbivores Figure 4: Ulva sp.
(Racheli Einav, 2000).
92021 SJWPI Entry
Growing Conditions at Sea
The flow regime in the eastern Mediterranean basin includes a north-south flow vector
most of the year, within which the flow is northward most of the time. The light properties
in the aquatic environment are dynamic, and the light energy varies at different depths,
seasonally and during the day.
Light energy depends on two main components:
intensity and wavelength (color). Some of the radiance
energy is reflected from the water (10% of such energy
is lost due to the ocean surface) while the rest of it
penetrates the water selectively and disperses upon
reaching the upper water layers (Boeuf & Le Bail, 1999).
Light is involved in developmental and growth
processes, as well as in photosynthesis occurs in the
photic zone (Dana Van Der Weiss, 2002). Figure 6
depicts the effect of water depth on light intensity at
different wavelengths. The black line represents the
average of all wavelengths. It is seen that a rapid decrease
Figure 5: Light absorption in oceanic
water (CEUH, 2021)
in light intensity occurs with depth.
The pigment molecule chlorophyll a, has an essential part in the process of photosynthesis
(Guy Schleyer, 2017). Xiaolong Yang, et al (2018), found a correlation between an increase
in the total concentration of chlorophylls a and b and an increase in the amount of nitrogen
in the plants. These findings are consistent with previous studies. It means that the amount
of chlorophyll in the algae may serve as a reliable bio-indicator for the concentration of
nitrogen in the environment and the amount of nitrogen consumed by algae (Xiaolong
Yang, et al, 2018). In another study, that had examined the nitrogen content in algae, it
was found that the total nitrogen in the chlorophyll molecules is about 1% of the total
nitrogen in the algae, while the protein contains 43% of the nitrogen in algae. However, it
has been found that there is a direct relationship between nitrogen enrichment and an
increase in chlorophyll concentration as well as protein (Naldi M. & Wheeler. P.A., 1999).
The purpose of the study I have conducted was to examine the feasibility of algae growth
in the vicinity of a fish cage, resulting from the addition of nutrients flowing from the fish
cage, and to estimate the percentage of nutrients absorbed by the algae which thus are not
released into the immediate marine environment. The impact of the marine conditions on
102021 SJWPI Entry
this process was in the focus of the project. This was done in order to explore the possibility
of creating a mariculture farm that could combine grows of animal and plant food products,
as a substitute for freshwater consuming land-based crops.
Research Methods
The experiment was performed in an active Sea-bream fish cage belonging to Lev-Yam
Co. (Fig. 7) located in the Mediterranean Sea, 3.2 km west of Ramot Yam nautical school,
Israel. This cage utilizes the natural flow regime in the area to disperse fish excrement.
Since the main flow vector during the year is North-South, I opted to place algae inside net
devices south and north of the fish cage, in order to test the effect of the nutrient flow, both
down- and upstream. I placed the algae next to the fish cage, facing southward and
northward, at depths of 7 and 11.5 meters. Thus, the investigation focused on determining
the effects of emplacement of the alga relative to the cage and of the depth. Each treatment
had 3 duplicates. At the beginning and seven days thereafter, I performed a series of
measurements that included weighing, determining the percentage of organic matter, and
the concentration of chlorophyll a.
Figure 7: Fish net cage TLC model (RefaMed, 2015). Figure 6: Algae net devices, similar to the ones I used in my
research (Photography: Zollman M)
Streams Data
By the end of the experiment, I assembled the oceanographic data regarding the sea
currents, which were downloaded from the records of the Israel Oceanographic and
Limnological Research Institute research station in Hadera. I used only data relevant to the
time when the experience was preformed (7-14 October 2020). The data was processed in
progressive vector diagram analyses with the assistance of Prof. Gitai Yahel - Faculty of
Marine Sciences, Ruppin Academic Center.
112021 SJWPI Entry
Calculating Food Quantities
The fish in the cage were fed by food containing 46% protein and a total of 7.37% nitrogen.
During the seven days experiment, the fish were fed 60 kg of food per day, totaling 420 kg
of feed (according to Dan Radkopf, of the Lev-Yam Company).
Food quantity 420 kg
Nitrogen percentage in the food 7.3%
Amount of nitrogen in the food 30.95 kg
Amount of nitrogen assimilated 6.8 kg
by the fish (22%)
Dissolved nitrogen amount 17.95 kg
emitted to the water (7% + 61%)
Nitrogen amount in excrement 3.09 kg
(10%)
Table 1: Calculation of the nitrogen amount assimilated in fish according to the model of Lupatsch & Kissil (1998).
Formula for Calculating Algae Growth
W2 -The weight of the algae by the end of experiment;
W1 - Initial algae weight
DGP - Daily growth rate.
Chlorophyll a concentration
Chlorophyll a concentration was extracted in DMF (dimethylformamide, an organic
solvent), tested in spectrophotometer in 663 nm wavelength, and calculated according to
the formula:
chl a = 0.012 x A663 x volume / fresh weight
The chlorophyll concentration is expressed in units of (mg chlorophyll a)/(g of algae).
122021 SJWPI Entry
Annual water consumption in the various growing industries
I had calculated it by multiplying the ecological water footprint data of the various crops,
by the volume of their global production in 2018 (according to FAO 2020).
WF * AGP = AGWF
WF = Water Footprint
AGP = Annual Global Production
AGWF = Annual Global Water Footprint
Organic Matter
Percentage of organic matter was tested by drying and burning it at a temperature of 5800C
and calculating based on this formula:
(100 - burnt weight) * 100/dry weight = percentage of organic matter.
Results
The following results include: stream data, daily growth rate, percentage of organic matter,
quantity and concentration of chlorophyll-a.
7 meters 11.5 meters
Chart 1: Hadera Monitoring Station Progressive Vector Diagram
132021 SJWPI Entry
Based on the analysis of the flow directions in the cages area, it could be seen that during
36 hours of the experiment’s period, the flow to the north was rapid, while at the rest of the
experiment’s area the flow was slow and to the south. One can also see in the left chart an
east-bound drift at 7 m depth.
Near the fish cages in the southward
direction, at both depths, the daily
growth percentage was higher
compared to the algae placed at the
northward direction. Likewise, the
daily growth percentage in the
shallower treatment was higher than
the daily growth percentage in the
Two-Way ANOVA P=0.008
deeper one. It can also be clearly
Chart 2: The effect of depth and direction on Ulva’ growth
seen that at a depth of 7 meters at the
southward direction, the percentage of daily growth was the highest among the various
locations and depths at a value of 16.41% as compared to 3.91% -7.49% in the other areas.
The percentage of organic matter
was about 20% higher at the
southward direction in both
depths, compared to the northward
direction. It can also be seen that
in both directions, the percentage
of organic matter in the shallow
emplacement was higher.
Chart 3: The effect of depth and direction on the percentage of
organic matter in Ulva
142021 SJWPI Entry
The amount of chlorophyll a
which developed was
weighted (adjusted) in
relation to the biomass gain in
the experiment. It was
observed that at the northward
direction, in both depths, the
chlorophyll a concentration
Chart 4: The effect of direction and depth on the concentration and
amount of chlorophyll a in Ulva. was higher than at the
southward one. It was also
noted that in both directions the chlorophyll a concentration found at the deep location was
greater than the chlorophyll a concentration in the shallow position. However, those
chlorophyll concentrations are quite similar and hover around values of about 0.38 mg per
gram, except for the concentration at the southward direction at the 7 m depth, which was
slightly lower, about 0.29 mg per gram. As to the amount of chlorophyll a: in the southward
direction, in both depths, a greater amount of chlorophyll a was formed than in the
northward direction, in both depths. It was also observed that in both directions a greater
amount of chlorophyll a developed in the shallow treatment, than in the deeper one. In the
shallow treatments, an inverse relationship was detected between the chlorophyll a
concentration and its amount in the algae.
Discussion
In this study I have examined the effect of depth and position, relative to a fish cage, on
the growth and chemical composition of Ulva algae. The algae in the experiment played
three different roles: (i) as a bio-indicator for the presence of ammonia originating from the
fish cage; (ii) as a bio-filter for nitrogenous secretions originating from the fish cage; and
(iii) an economic valuable crop obtained from an offshore fish cage. Such cultivation
would, in theory, provide a substitute for green leafy vegetables, as well as a source of raw
materials with rich nutritional and mineral value for various products, whose land-based
farming involves the utilization of freshwater and other valuable resources. The fish cage
in this study had served as a nutrient source for algae. In this study I focused on finding the
optimal location, in close proximity to the fish cage, for growing Ulva. Due to the
coronavirus crisis a plan to grow Gracilaria species under identical conditions as
conducted for Ulva, did not materialize.
152021 SJWPI Entry
What Is the Effect of Directional Position, in Relation to the Fish Cages, on Growth
and Chemical Composition of the Ulva Algae?
Most of algae growth manifested in biomass and organic matter. In plants, glucose is not
used solely as an energy source, but also as the primary building block of the plant.
According to charts 2 & 3, in both depths in the southward direction, the daily growth
percentage was about 50% greater than at northward direction. At the southward direction,
the chlorophyll a concentration was high (chart 4) due to the influx of nutrients from the
fish cage. This enabled an increase in the rate of photosynthesis and a faster transfer of
glucose to cellulose production, which constitutes most of the organic matter in these algae.
According to the measurements of flow data (Chart 1), it turned out that during a 1.5 days
of the experiment period, the flow to the north was faster whereas for the rest of the time,
there flow to the south was slower. In a strong current, the dilution effect of the nutrients
flowing from the cage was greater, thus the effect of the fish cages on algae growth had
lessened. In a slow flow, the algae are more able to absorb the ammonia emitted from the
cages. Nitrogen availability is considered to be a limiting factor for the production of
proteins and chlorophyll a. Therefore, as we can see in chart 4, the chlorophyll a content
is higher at the southward direction, compared to the northward direction at both depths,
and is particularly high at the "7m depth-South" growth area. The amount of chlorophyll a
is indicative of the degree of nitrogen presence in the water. As mentioned, there is a direct
relationship between the concentration of chlorophyll a in algae and the presence of
nitrogen in the growth environment (Xiaolong Yang, et al, 2018; and calculations in Table
1), which, in turn, is indicative of the ability of algae to absorb nitrogen from the water and
thus reduce the environmental impact of fish cages. The chlorophyll a concentration at the
various treatments is similar in three of them (Chart 4) and the range is 0.35 - 0.40 mg. It
was, however, slightly lower (0.29 mg ) at the "7m- South" area, where, as mentioned, the
highest growth rate was observed. This is because the rate of chlorophyll a production was
sufficient, and the excess nitrogen absorbed was used to accelerate Ulva growth. It can be
concluded that in a medium where nitrogen is not limited, and under optimal lighting
conditions, the algae will use the excess nitrogen for growth and biomass accumulation. At
a depth of 7 m, the lighting conditions were better at both ends, while at "7m- South" the
algae enjoyed optimal lighting intensity, as compared to "7 North", where lighting was
affected by the fish cage's shadow.
According to my research, it can be concluded that depth and direction have a synergic
effect, as can be ascertained from the results and in the two-factor ANOVA test (P value =
162021 SJWPI Entry
0.008). That effect is due to a combination of lighting conditions and current conditions
which affect the nutrient flow from the fish cage.
The global production of meat in 2018 was 341.16 million metric tons (FAO, 2020),
meaning global water consumption of nearly 5.287980 trillion m3/year.
The global production of lettuce (combined with chicory) in 2017 was 27 million metric
tons (FAO, 2020), meaning global water consumption of nearly 6.399 billion m3/year.
Thus, the combined consumption of water for the annual production of meat and lettuce
stands on 5.294379 trillion m3/year.
Integrated mariculture growth systems, as used in my research, enable the allocation of part
of the global meat and vegetable production to the marine environment, thus significantly
reducing the annual global fresh water consumption without compromising nutritional
benefits, such as protein.
I did not find available data concerning the water footprint of marine offshore fish and
algae production. Yet, I can assume that algae growth processes require a negligible
amount of freshwater, less than required by lettuce and spinach, for instance. Moreover,
algae contain more protein than either spinach or lettuce, 35.1, 28.6, 11.3 g/kg respectively
(Nutrition Value, 2021).
Conclusions and Suggestions for Further Research
My research shows that there is a possibility of an integrated growth of animal and plant
foods in a marine environment, with a reduction of detrimental environmental impacts
compared to other sources. The common food production in terrestrial agriculture implies
both direct use of freshwater as well as the depletion and pollution of natural water sources
(groundwater and surface water, as a result of over-pumping and pollution by fertilizers,
pathogens and other pollutants). Water used to raise fish inland, needs purification
processes before reuse or their return to the environment, and the alternative, of using
seawater in an open system, makes it possible to optimize growth and to significantly
reduce the use of fresh water.
Based on the results of my research, in order to reduce the impact of fish cages on the
marine environment, I recommend growing Ulva algae at depths between 7-11.5 meters
south of the fish cage, although further research is needed in order to examine the effect of
172021 SJWPI Entry
growing algae all year long, in additional directions (east-west) and adding other types of
algae, as well as checking the percentage of protein in the various treatments.
Bibliography
1. Ayalon O., Trop T., Eshet T., Libes I., Zarbiv M. and Kerem E. (2015). "Development of
Sustainable Mariculture in the Mediterranean Israel Waters." Report of Neeman Institute,
Technion, Israel. (in Hebrew)
2. Boeuf, G., & Le Bail, P. Y., (1999). 'Does Light Have an Influence on Fish Growth?"
Aquaculture, 177 (1-4), 129-152.
3. Bouwman Lex, Beusen Arthur, Glibert Patricia M, Overbeek Ciska, Pawlowski Marcin,
Herrera Jorge, Mulsow Sandor, Yu Rencheng and Zhou Mingjiang, (2013). "Mariculture:
Significant and Expanding Cause of Coastal Nutrient Enrichment." Environ. Res. Lett. 8.
4. Chemodanov, A., Robin, A., Jinjikhashvily, G., Yitzhak, D., Liberzon, A., Israel, A., &
Golberg, A. (2019). Feasibility study of Ulva sp.(Chlorophyta) intensive cultivation in a
coastal area of the Eastern Mediterranean Sea. Biofuels, Bioproducts and Biorefining, 13(4),
864-877.
5. College of Education, (2021)."Light in the Ocean." Exploring Our Fluid Earth. University of
Hawai‘i. Retrieved from: https://manoa.hawaii.edu/exploringourfluidearth/physical/ocean-
depths/light-oceanFAO, (2020). The State of World Fisheries and Aquaculture: Sustainability
in Action. Food and Agriculture Organization of the UN. Rome, Italy. Retrieved from:
https://doi.org/10.4060/ca9229en
6. Israel A., Gadnekn A., Shachter M., Shamir T. S., Korzen L., Abelson A., (2015). "Various
Aspects of Production of Bio-ethanol from Macro-algae in Israel." Ecology and Environment,
6 (3) (in Hebrew)
7. Joyce, A., Goddek, S., Kotzen, B., & Wuertz, S., (2019). Aquaponics: Closing the cycle on
limited water, land and nutrient resources. Aquaponics Food Production Systems, 19.
8. Khokhar, Tariq (2017). "Chart: Globally, 70% of Freshwater is Used for Agriculture."
Retrieved from: https://blogs.worldbank.org/opendata/chart-globally-70-freshwater-used-
agriculture
9. Lupatsch, I., & Kissil, G. W., (1998). Predicting aquaculture waste from gilthead seabream
(Sparus aurata) culture using a nutritional approach. Aquatic Living Resources, 11 (4), 265-
268.
10. Mekonnen, M. M., & Hoekstra, A. Y., (2011). The green, blue and grey water footprint of
crops and derived crop products. Hydrology and Earth System Sciences, 15 (5), 1577-1600.
182021 SJWPI Entry
11. Naldi, M., & Wheeler, P. A., (1999). Changes in nitrogen pools in
Ulva fenestrata (Chlorophyta) and Gracilaria pacifica (Rhodophyta) under nitrate and
ammonium enrichment. Journal of Phycology, 35 (1), 70-77.
12. Nutrition Value, 2021. "Lettuce & Spinach." USDA National Nutrient Database. Retrieved
from: https://www.nutritionvalue.org
13. RefaMed, (2015). "TLC System." Retrieved from:
https://refamed.com/gabbie_mare/tlc_system.html
14. Spiegel M., (2014). Mariculture friendly to environment, from the book “Majesty of the Sea”,
The Israeli Assoc. For Marine Science (in Hebrew).
15. UNDP & FAO, (August, 1990). Training Manual on Gracilaria Culture and Seaweed
Processing in China, Retrieved from:
http://www.fao.org/docrep/field/003/AB730E/AB730E00.htm
16. UN-Water. "Water Scarcity." Retrieved from: https://www.unwater.org/water-facts/scarcity/
17. Yang, X., Zhang, P., Li, W., Hu, C., Zhang, X., & He, P., (2018). Evaluation of four seagrass
species as early warning indicators for nitrogen overloading: implications for eutrophic
evaluation and ecosystem management. Science of the Total Environment, 635, 1132-1143.
19You can also read


