UK Grocery Report - Savills
←
→
Page content transcription
If your browser does not render page correctly, please read the page content below

UK Commercial – 2020

 S P OT L I G H T
 Savills Research
                    UK Grocery Report

Strong operational performance   Significant value-orientated portfolio growth   Investment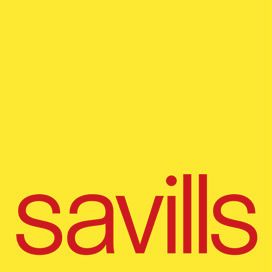
UK Grocery Report - 2020

                                           Consumer confidence remains downbeat, with GfK’s
                                           October index recording -31, compared to -14 a year prior.

Grocery performance bucks wider
consumer trends
                                                                                                                                                11.3%

Consumer confidence remains suppressed, however, a fall in spend                                                                      Take-home grocery sales up
hasn’t been homogeneous across all retail segments, highlighting strong                                                               by 11.3% during the 12 weeks

resilience in the grocery sector.                                                                                                      to 29 November 2020, the
                                                                                                                                      fastest rate of growth since
                                                                                                                                                 August
A relaxation of Covid restrictions in Q3, following the first     the quarter. We could witness consumer spending behaviour
lockdown, eased the negativity in the consumer market             swing in two directions this winter. Low consumer confidence
temporarily, with general economic outlook over the next          and job uncertainty are expected to uphold high personal
twelve months improving from an index of -56 in March to          saving ratios until well into 2021, fostering a much more
-38 by September. However the implementation of a second          cautious approach to Christmas for some. As a result, Oxford
national lockdown from November has further exacerbated           Economics are anticipating consumer spend on retail goods to
a recovery and as a result, consumer confidence remains           drop -4.7% in Q4 2020, compared to the year prior. That being
downbeat, with GfK’s October index recording -31, compared        said, we could see a portion of consumers opt to spend more
to -14 a year prior. Consumer attitudes towards major             enthusiastically over this Christmas period driven by pent-up
purchases remain delicate, with the index standing at -27,        demand following six months of heightened savings.
marking a six point fall over September levels. The general          By subsector, it’s likely we’ll see a significant polarisation
economic outlook of the consumer over the next twelve             in trading results. While spend across more pandemic-
months also fell back to levels similar to those witnessed in     sensitive segments such as fashion, travel and eating out are
March, reporting an index of -50 by October (Figure 1).           likely to remain suppressed through Q4, it could open growth
   The extension of the existing furlough scheme to the end       opportunities across other sectors. Supermarket sales in both
of March 2021, will have saved a number of jobs in the short-     value and volume terms continue to perform well, exceeding
term. Nonetheless, the UK unemployment rate continued to          the long-term average in September to reach 4.3% and 3.2%
rise in the July to September period to reach 4.8%, with added    year-on-year respectively, on a rolling 12-month basis. In
economic pressures caused by a second lockdown pointing to        line with a second lockdown, as well as more people staying           2019 saw as many as 221
a further rise in unemployment as we move towards 2021.           at home over Christmas, supermarkets are likely to continue         new grocery store openings
   The final quarter is always a pivotal time of year for         this long run of success through the final quarter of the year.     in the out-of-town market, a
retailers, with Black Friday and the Christmas period, having     The early signs are positive, with take-home grocery sales up        record high and well above
great bearing on annual reporting figures. The additional         by 11.3% during the 12 weeks to 29 November 2020, the fastest            the average at 143
pressures this year will no doubt accentuate the importance of    rate of growth since August.

Figure 1: Consumer confidence remains downbeat, with the October index recording
-31, compared to -14 a year prior.

          40

          30

          20

           10

           0

          -10
  Index

          -20

          -30

          -40

          -50

          -60                                                                                                                                    153
                07/2000

                07/2001

                07/2002

                07/2003

                07/2004

                07/2005

                07/2006

                07/2007

                07/2008

                07/2009
                01/2000

                 01/2001

                01/2002

                01/2003

                01/2004

                01/2005

                01/2006

                01/2007

                01/2008

                01/2009

                07/2010

                 07/2011

                 07/2012

                 07/2013

                 07/2014

                 07/2015

                 07/2016

                 07/2017

                 07/2018

                 07/2019
                 01/2010

                  01/2011

                 01/2012

                 01/2013

                 01/2014

                 01/2015

                 01/2016

                 01/2017

                 01/2018

                 01/2019

                07/2020
                01/2020

                                                                                                                                       New foodstore openings
                                                                                                                                         in the out-of-town
                                                                                                                                       market by the end of Q3
                General Economic Outlook    Personal Financial Situation Outlook       All       Climate for Major Purchases           2020, already above the
                                                                                                                                          decade average

                                                                                                                  Source GfK

savills.com/research                                                            2
UK Grocery Report - 2020
The immediate post-GFC period showed that if
consumers swing into belt-tightening mode, then it is
the value end of the spectrum that benefits most.
Strong occupational growth set to
continue
With a significant pandemic related uptick in grocery spending, strong
annual portfolio growth is set to continue, particularly from the value-
orientated brands.
The appeal and provision of value-orientated brands in the UK units accounted for more than a fifth of new retail warehouse
retail market has seen significant growth over the last decade, openings last year, the first time it has done so since 2011. So 75%
and the grocery sector is certainly no exception. A high level far this year grocery has accounted for 26% of new openings,
comparison of the top 25 out-of-town retailers in 2009 and up from the 22% recorded in 2019.
2020 makes this case very effectively. Back in 2009 Lidl was A look at the top twelve most acquisitive brands in the retail
the only value-orientated brand in this group, in 25th place warehouse market for 2020, draws attention to the aggressive
Value orientated
with 121 stores. Aldi and Iceland both sat well outside the top strategy of portfolio expansion for each of the value grocers,
grocery operators
25 with 99 stores and 38 stores respectively. Fast forward to even against a background of weak consumer confidence accounted for three
2020 and there are five value-orientated brands in this group amid the global pandemic. The immediate post-GFC period quarters of all new store
with the grocery retailers leading the charge; Lidl sits in top showed that if consumers swing into belt-tightening mode, openings in 2020
spot with 816 stores, Aldi second with 597 and Iceland fifth then it is the value end of the spectrum that benefits most.
with 354. This suggests that whatever the political and economic
Continuing the retail warehouse example, it is therefore no outcome of the recent pandemic, the strong growth in demand
surprise the grocery sector has been recording well above the from the value retailers will very likely be sustained. By way
decade average for new foodstore openings in recent years. of an example, Lidl opened 46 new stores in 2019 totalling
2018 saw 179 new grocery stores in the out-of-town market, 908,000 sq ft. So far 2020 has seen them open 52 new stores,
whilst last year saw as many as 221, a record high for the last equating to just over 1m sq ft (Figure 3). Aldi and Iceland have
ten years and well above the average at 143. What is even also continued to pursue strong growth strategies, opening 33
more encouraging, is that this strong growth performance and 15 stores respectively, all at over 10,000 sq ft gross. Since
has continued in 2020, in spite of the pandemic and the 2015, value-orientated brands have in fact accounted for more
obvious disruption to trade across the wider retail market. than half of all new grocery openings each year and as much
By the end of Q3, new foodstore openings accounted for 153, as three quarters of all supermarket acquisition activity by Q3
already above the decade average, with a quarter of the year 2020.
yet to come (Figure 2). As a result of this activity, grocery
Figure 2: New openings have been well above the Figure 3: Most acquisitive retail warehouse brands
decade average in the last two years and had already by the end of Q3 2020, with Aldi, Lidl and Iceland
surpassed it by the end of Q3 2020. leading the charge for the grocery sector.
250
Ranked by units
221
Average Unit
Rank Operator Units Category Pitch
Size (sqft)
200 194
179
New openings (unit count)
1 Lidl 52 21,400 Grocery Value
2 Aldi 33 19,100 Grocery Value
151 153
150 141 3 Costa Coffee 23 2,500 Food & Beverage Mass
120 4 B&M Bargains 22 28,000 Variety Stores Value
114
5 Home Bargains 21 23,300 Variety Stores Value
98
100 6 Wren 17 10,900 Home Mass
7 PureGym 16 10,000 Leisure Value
66
8 Iceland 15 12,300 Grocery Value
50
9 Starbucks 13 1,900 Food & Beverage Mass
10 Greggs 11 1,500 Food & Beverage Mass
11 TheGym 10 9,600 Leisure Mass
0
2011 2012 2013 2014 2015 2016 2017 2018 2019 2020
12 M&S Simply Food 10 21,200 Grocery Mass
No. of units Average units
Source Savills Research
3UK Grocery Report - 2020
There has undoubtedly been a structural change with
Figure 4: Rental value growth: According to MSCI, supermarket
regard to rents in the UK retail market in recent years, and it
is clear this has been the driving force behind the acquisition rents have fallen less than the rest of retail.
activity we have witnessed in the grocery sector in particular. 8%
Value-orientated brands have been particularly opportunistic, 6%
looking to expand their operations or renegotiate existing
4%
leases and seize the opportunity to acquire space at a more
Rental value growth (yr/yr)
favourable rent. That said, Figure 4 highlights how the decline 2%
in rental value growth for supermarkets has been much less 0%
severe than for other areas of the retail market. MSCI report
-2%
year-on-year rental value growth of -1.1% for foodstores in
2019, whereas it stands at -5.9% for the rest of retail. 2020 -4%
looks set to repeat this pattern, recording a -0.9% year-on- -6%
year rental decline for grocery stores, much more in line with
-8%
‘all property’ types, and significantly less than -8.8% for all of
retail. -10%
The resilience the grocery sector has shown in regards to -12%
rental decline is undoubtedly linked to its ongoing positive
-14%
performance and the relationship the market has between
Mar-07
Mar-08
Mar-09
Sep-07
Sep-08
Sep-09
Mar-10
Mar-11
Mar-12
Mar-13
Mar-14
Mar-15
Mar-16
Mar-17
Mar-18
Mar-19
Mar-20
Sep-10
Sep-11
Sep-12
Sep-13
Sep-14
Sep-15
Sep-16
Sep-17
Sep-18
Sep-19
Sep-20
physical stores and online sales penetration. Food and grocery
expenditure has been growing steadily for some time, with
annual growth of between 1% and 3% since 2015, according to Supermarkets All Retail UK Standard shops (excl Lon)
Source MSCI
GlobalData. However, as a direct result of the global pan-
demic, the UK food and grocery market is forecast to have
grown by 10.1% in 2020, the highest annual growth in over Figure 5: Food and grocery expenditure growth, showed a
four decades (Figure 5). March and April saw an explosion in significant pandemic related uptick in 2020.
expenditure growth as shoppers began panic-buying and stock-
piling non-perishables. According to the Office for National £180,000
£170m
12.0%
£167m £166m
Statistics, overall UK retail sales declined 5.1% in March from £158m £158m
£161m
£160,000 10.0%
February, the largest drop since the agency started collecting £150m £152m
£145m
the data in 1996. However, food sales and online-only busi- £139m £141m 8.0%
£140,000
nesses were the only areas to see growth in that period, with
supermarkets and other food stores recording a 10.4% increase 6.0%
£120,000
Total increase (%)
Total expenditure (£m)
in sales in the same period. 4.0%
Foodstore operators have also made significant gains in £100,000
the months following, as the UK remains in a state of flux 2.0%
between national lockdowns and the localised tier restrictions. £80,000
0.0%
Consumers have turned to grocery operators in the absence
£60,000
of hospitality and foodservice locations, with food sales set to -2.0%
outperform the total grocery market for the first time since
£40,000
2017. This is supported by strong volume growth across core -4.0%
ambient categories, with other influences, such as 5.3% of UK £20,000 -6.0%
shoppers buying a pet during lockdown, buoying secondary
markets such as pet food. £0 -8.0%
A number of non-food categories in the grocery sector are 2015 2016 2017 2018 2019 2020e 2021e 2022e 2023e 2024e 2025e
also recording a significant uptick in expenditure. With pubs Total expenditure (£m) Total increase (%)
and bars either closed or restricted for much of the year, 2020 Source GlobalData
has seen a 14.5% increase in alcohol expenditure in super-
markets after an initial jump of 31.4% in March when the first Figure 6: Food and grocery online expenditure growth, will see
lockdown was announced. Household products have proven its share of the whole market increase from 7.4% in 2019 to 12.5%
to be the fastest growing sector, forecast at 21.6% in 2020, as
by the end of 2020.
shoppers have rushed to buy cleaning and sanitation products
for protection against the virus. £25,000 100.0%
As a vaccination programme is rolled out and the UK con-
£21m
sumer once again begins to visit restaurants, pubs and food- £22m
£21m £21m
service outlets in significant numbers, food and grocery sales £20m 80.0%
£20,000 £19m
are expected to retract somewhat. We saw a glimpse of this in
mid Q3, when the grocery market resumed some semblance of
Total expenditure (£m)
60.0%
Total increase (%)
normality, with the government’s Eat Out to Help Out scheme,
£15,000
encouraging shoppers to spend on food and drink at non-retail
locations. That said, overall food and grocery expenditure 40.0%
£11m
is not expected to return to the levels we saw pre-pandemic, £10m
highlighting a noticeable and permanent improvement in ad- £10,000
£8m
£9m
vance of the sector’s normal growth trajectory. As a result, the £8m 20.0%
growth rate will naturally show a decline, estimated at -5.3%
for 2021, but is expected to return to normal levels of growth £5,000
0.0%
by 2023 (Figure 5).
Despite the unprecedented performance in the sector in
recent months, many analysts might point to the growth of £0 -20.0%
online penetration in the grocery sector as a potential threat 2015 2016 2017 2018 2019 2020e 2021e 2022e 2023e 2024e 2025e
to the physical store in the years ahead. The channel shift Online expenditure (£m) Total increase (%) Share of sector total (%)
from offline to online has been dramatic in food & grocery this Source GlobalData
4UK Grocery Report - 2020
year, with penetration set to jump from 7.4% to 12.5% - a transference of £9.7bn. with £26.02 being spent per supermarket visit, £7 higher than the same time
Since late May, online spend has been running at double that in 2019. Many last year. Out-of-town foodstore locations are also set to benefit, particularly
consumers who have always shopped instore have reverted to completing their from consumers with a defined shopping mission wanting extra physical space
transactions online to avoid venturing into stores and potentially being exposed to shop in.
to the virus. The surge in demand for home delivery options in March and April The dynamics of the food & grocery market in 2021 will rest heavily on the
was high enough to cause website crashes, however, since then, supermarkets progression of the pandemic, both in the UK and abroad. With social distanc-
have been quick to swell capacity to deal with this demand. Tesco for example, ing restrictions likely to continue to at least the end of Q2 2021, we expect that
doubled its online fulfilment capacity in a space of six weeks. Grocers quickly increased food and grocery spend will continue in H1, before gradually reducing
realised they needed to invest in their online propositions, capabilities and from July 2021 onwards. It is important to note a full transference of online
loyalty programmes, encouraging shoppers to take more spend online than pre- spend back to offline is not expected, as for many consumers, the initial barriers
2020 going forward. Their willingness to do so highlights a strong omni-chan- to entry for online shopping have been hurdled, and the convenience it offers
nel approach by the UK’s major grocery brands and actually alleviates the means the channel will retain a sizeable proportion of its newfound revenue.
concern of the importance of the physical store going forward. Unlike much of Despite the positive outlook for the sector, some foodstore operators have
the rest of UK retail, where the rise of ecommerce can directly impact on the reported that the implementation of social distancing measures has started to
volume and value of goods sold in store, online grocery orders are typically ser- temper both their in-store sales and profit margins as they are simply unable to
viced by the stores themselves, making the true value of the store in the grocery serve the same volume of consumers as before. Furthermore, they have had to
sector, much greater than is initially obvious. increase staff levels in order to implement such social distancing measures. As
Supermarkets and convenience stores have of course been considered restrictions tighten in the run up to Christmas, peak online delivery slots are
essential throughout the pandemic. Out-of-town foodstores accounted for also already at a premium for some major supermarkets, therefore how to con-
more than a third (35%) of all the essential retailers permitted to trade imme- tinue to meet consumer demand and also turn a profit will remain an important
diately following the government sanctions in March. As a result we have seen consideration for many brands.
significant sales improvements for individual brands, echoing that in the wider A number of supermarkets have already begun to use digital queuing sys-
market as a whole. Figure 7 has seen Tesco’s year-on-year gross sales increase tems, 24-hour trading and door marshals to avoid problems in what is expected
from -0.8% in the 12-week period up to February 23rd 2020, to 10.4% in the to be their biggest ever Christmas sales period. Over 300 Tesco stores will be
12-week period to the end of November. The online supermarket Ocado, has open for 24-hour trading in the run up to Christmas Eve, while Tesco has also
unsurprisingly seen the most significant sales growth, from 10.8% in the same installed a traffic light system in most stores to regulate the flow of shoppers.
12-week period in February, to 38.3% in the same 12-week period in November, Waitrose has launched a queueing app, called Qudini, which enables shoppers
resulting in a market share of 1.7% of the UK grocery market as a whole (Figure to book a shopping time slot remotely, and will also be extending their opening
8). Meanwhile, Lidl reached a new record market share of 6.2% (Figure 8) and hours. Meanwhile, Sainsbury’s supermarkets will do the same, while it is also
Aldi’s sales were up by 7.0%, with a 7.7% share of the market, demonstrating the offering members of its Nectar loyalty scheme extra points if they shop in
strong consumer demand for value-orientated operators and underpinning the advance of Christmas week, to persuade its customers to plan ahead.
strong acquisition activity they have continued to demonstrate this year. Looking into 2021, Brexit is the one potential spanner in the works, as it will
With Covid cases rising again as we entered Q4, and social distancing meas- undoubtedly lead to a disruption in retailer supply chains and their ability to
ures therefore tightening once more, shopping habits in the final quarter are get goods into the UK. Supermarkets have already begun to stockpile food and
more likely to resemble that of Q2, which again could mean a significant uptick other goods after being told by ministers that a no-deal Brexit is on the cards.
in foodstore operator performance. Consumers are expected to spend close Potential shortages of fresh produce could scupper the strong performance we
to £12 billion in the supermarkets during December, around £1.5 billion more have seen in the grocery sector, particularly if a no deal scenario leads to tariffs
than last year. With consumers again likely to want to limit the number of and inevitably increased costs for retailers, which would in turn be passed on to
visits to stores, we expect to see basket sizes increase dramatically on last year, consumers. That said, emergency planners are predicting that no-deal would
as they did at the start of the pandemic. Research from Kantar suggested that spark panic-buying on a scale that could dwarf the coronavirus crisis.
the amount families spent on a shopping basket reached a record high in April,
Figure 7: Gross sales (% change year-on-year), sees Figure 8: UK market share by grocery brand.
dramatic improvements across all the UK’s major
grocery operators.
40.0% 38.3%
Other
Ocado
35.0% 1.7%
Lidl
3.7%
6.2%
30.0%
Aldi 27.0%
Tesco
7.7%
25.0%
Iceland
21.0%
% Change Y/Y
2.4%
20.0%
Waitrose 4.9%
15.7%
15.0% 13.7% 13.2%
13.9%
10.4%
11.4%
10.8% Co-op 6.3%
9.8%
10.0% 14.1%
7.7%
7.0%
5.7% Asda
10.3%
5.0%
2.5% Morrisons
1.7%
0.3%
15.7%
0.0%
-0.8% -1.2% -1.3% Sainsbury’s
-2.0%
-5.0%
Source Kantar
12wk 23rd Feb 20 12wk 29th Nov 20
5UK Grocery Report - 2020
The typical long-lease, inflation-linked structures
associated with foodstore assets continues to entice
buyers looking for long-term income security.
Resilience in the supermarket
investment market
Operational resilience and long-term income security sparks strong
Investment volumes this
appetite for supermarket investment. year-to-date (Jan-Nov
2020) reached £1.38 billion,
While investor demand for retail is generally limited, the long-income assets with over 20 years unexpired terms, exceeding the five year
ongoing resilience of the supermarket sector has provided a representing a substantial increase compared to the 13.6% average by 11.7%
secure investment alternative for many investors. share recorded in 2019.
Supermarket investment volumes this year have been Meanwhile, the operational resilience shown by
particularly strong considering the disruption to the wider supermarkets this year has largely eliminated the risk of
commercial real estate market, caused by the pandemic. deferred/unpaid rent payments. The largest supermarket
Transaction volumes this year to date (January-November landlord in the UK, Supermarket Income REIT, received 100%
2020) reached £1.38 billion, representing a marginal decrease of rent payments due on both June and September quarterly
of -3.9% compared to full-year 2019 levels, however exceeding rent payment dates.
the five year average of £1.24 billion. In terms of investor type, UK Property Companies,
A number of deals due to complete in December is likely including real estate investment trusts, have been particularly
to bring full-year volumes closer in line with the heightened active in 2020, accountable for a 43.2% share of investment
levels recorded last year. Meanwhile, in deal count terms, volumes this year to date, totalling £597.4 million. This is
2020 has already exceeded total 2019 levels by 11.4%, primarily a result of Supermarket Income REIT transacting
recording 49 individual deals. on eight key deals, including the acquisition of a portfolio of
26 Sainsbury’s stores from British Land for £102 million in
Long-term security in the face of a recession supports May, in a joint venture with British Airways Pension Fund.
supermarket investment Amidst the strength of the foodstore market, Supermarket
The typical long-lease, inflation-linked structures associated Income REIT also have begun diversifying their portfolio in
with foodstore assets continues to entice buyers looking terms of tenant mix, acquiring their first Aldi store in early
for long-term income security, particularly at a time when November in Leicester with an unexpired lease term of 25 Deal count this year-to-date
appetite for risk has faded in the face of an economic years. Similarly, LXi REIT Plc have broadened their foodstore (Jan-Nov 2020) has already
downturn. The remaining unexpired lease term on network, including the recent acquisition of a mixed-tenant exceeded 2019 levels,
supermarket deals this year-to-date averaged 15.9 years, while portfolio comprising of 11 supermarkets, totalling £61 million. reaching 49 individual deals
20.4% of all deals were accounted for by inflation-linked
Figure 9: UK supermarket investment volumes have reached £1.38 billion this year-
to-date (January-November 2020), while deal count has already exceeded 2019 levels.
£2,200 70
Q1 Q2 Q3 Q4 Transaction vols (10yr average) Deal Count
£2,000
60
£1,800
Transaction volumes (£m)
£1,600 50
£1,400
Deal count
40
£1,200
£1,000
30
£800 20.4%
£600 20
£400
10 20.4% of deals this
£200 year-to-date (Jan-Nov
2020) have been accounted
£0 0 for by inflation-linked,
2010 2011 2012 2013 2014 2015 2016 2017 2018 2019 YTD long-income assets (20yr+
(Nov 2020)
unexpired terms)
Source Savills Research; PropertyData
savills.com/research 6UK Grocery Report - 2020
Owner-occupiers have accounted for an 11.7% share of total
investment volumes this year-to-date (Nov-20), up from a
11.7%
4.8% share recorded in 2019.
Figure 10: Savills prime equivalent supermarket yields have experienced downward
pressure in 2020, reporting 4.50% as of November 2020.
5.75
Savills supermarket prime equivalent yield
5.50
Savills prime equivalent yield (%)
5.25
5.00
4.75
4.50
Average size of foodstore
units sold in 2020 reached
4.25 52,000 sq ft, up 9.4%
compared to the 2019
4.00
average
Aug-11
Aug-12
Aug-13
Aug-14
Aug-15
Aug-16
Aug-17
Aug-18
Aug-19
May-20
Feb-11
Nov-11
Feb-12
Nov-12
Feb-13
Nov-13
Feb-14
Nov-14
Feb-15
Nov-15
Feb-16
Nov-16
Feb-17
Nov-17
Feb-18
Nov-18
Feb-19
Aug-20
Nov-19
Feb-20
Nov-20
May-11
May-12
May-13
May-14
May-15
May-16
May-17
May-18
May-19
Source Savills Research
Some occupiers look to reduce rental exposure while In line with rising online penetration rates for food sales,
others opt to reinvest capital we’ve seen increased activity involving larger supermarket
One trend we’ve seen mature in recent years is the completion assets - with the opportunity for operators to provide
of buy-back deals, with the trading improvement experienced traditional trading space alongside new online fulfilment
since the pandemic somewhat exacerbating this trend. Many centres. As a result, the average foodstore size this year-to-
foodstore operators are now in a strong financial position to date has reached almost 52,000 square foot, an increase of
take advantage of buy-back opportunities, to increase their 9.4% compared to the 2019 average.
freehold portfolio and therefore reduce exposure to future
RPI-linked rental escalations and over-rented units. Where does this leave pricing?
We’ve tracked a number of deals of this nature in 2020 and The continued investor appetite for supermarkets during
can expect this to continue as we move into 2021. Tesco, for the pandemic has resulted in the sector bucking the wider
example, have been particularly active in this field, acquiring retail trend by experiencing downward pressure on prime
two of their own stores in Bristol and Kettering for £42 yields compared to pre-Covid levels. Savills prime equivalent
million and £53 million respectively. As a result, owner- supermarket yields currently stand at 4.50%, representing a 25bps
occupiers have increased their share of investment volumes 25 basis point sharpening compared to levels recorded pre-
this year so far, to 11.7%, compared to a 4.8% share in 2019. pandemic, in Q1 2020.
At the same time, there have been a number of deals Looking ahead, the operational strength of the supermarket
Prime equivalent
move in the opposite direction, in the form of sale-and- sector is expected to continue as we move into 2021, resulting supermarket yields have
leaseback transactions. Most notably, Waitrose completed in sustained investor appetite. It’s therefore reasonable to experienced a 25bps
two sale-and-leaseback portfolio deals to Supermarket expect ongoing downward pressure on equivalent prime downwards shift compared
Income REIT and LondonMetric Property, totalling £74.1 yields, bringing yields closer to their post-GFC lows of 4.25%. to pre-Covid levels
million and £62 million respectively, while involving a total
of 11 supermarkets. This has allowed some chains to access
capital to reinvest in order to meet the demands of a changing
consumer environment – often to improve components of
their e-commerce and click & collect business.
The operational strength of the supermarket sector is expected to
continue as we move into 2021, resulting in sustained investor appetite
and further downward pressure on prime equivalent yields.
7Savills Commercial Research
We provide bespoke services for landowners, developers, occupiers and investors across the
lifecycle of residential, commercial or mixed-use projects. We add value by providing our clients
with research-backed advice and consultancy through our market-leading global research team
Retail Investment
Stuart Moncur Dominic Rodbourne James Gulliford
Head of National Retail Head of Out of Town Retail Head of UK Investment
+44(0)13 1247 3760 +44(0)20 7409 9945 +44(0)20 7409 8711
stuart.moncur@savills.com drodbourne@savills.com jgulliford@savills.com
Research
Sam Arrowsmith Josh Arnold
Commercial Research Commercial Research
+44(0)161 277 7273 +44(0)20 7299 3043
sarrowsmith@savills.com josh.arnold@savills.com
Savills plc: Savills plc is a global real estate services provider listed on the London Stock Exchange. We have an international network of more than 600 offices and associates throughout the Americas, the UK,
continental Europe, Asia Pacific, Africa and the Middle East, offering a broad range of specialist advisory, management and transactional services to clients all over the world. This report is for general informative
purposes only. It may not be published, reproduced or quoted in part or in whole, nor may it be used as a basis for any contract, prospectus, agreement or other document without prior consent. While every effort has
been made to ensure its accuracy, Savills accepts no liability whatsoever for any direct or consequential loss arising from its use. The content is strictly copyright and reproduction of the whole or part of it in any form
is prohibited without written permission from Savills Research.You can also read