Bank of Uganda - State of the Economy September 2019
←
→
Page content transcription
If your browser does not render page correctly, please read the page content below

Bank of Uganda

         State of the Economy

             September 2019

i|Page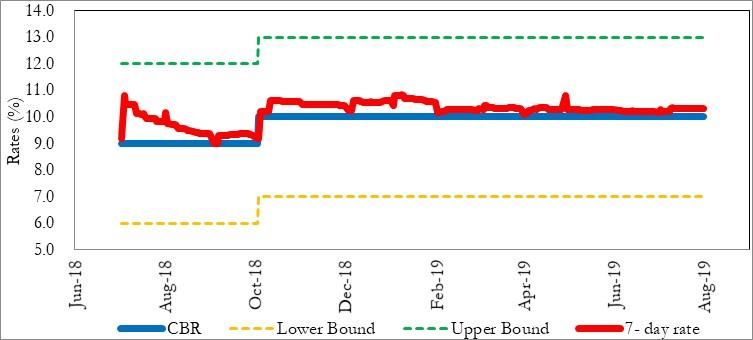
Table of Contents

List of Figures ............................................................................................................................................... iii
List of Tables ................................................................................................................................................ iii
Acronyms and Abbreviations ........................................................................................................................ iv
Executive Summary........................................................................................................................................ v
1     Background ............................................................................................................................................ 1
2     Global Economic Environment ............................................................................................................. 1
   2.1     Economic Activity ......................................................................................................................... 1
   2.2     Global Commodity Prices and Inflation ......................................................................................... 2
   2.3     Global Financial Markets................................................................................................................ 4
   2.4     Implications for the Uganda Economy ........................................................................................... 5
3     Domestic Economic Developments ....................................................................................................... 5
   3.1 Monetary Policy and Implementation ................................................................................................... 5
       3.1.1           Monetary Policy Stance .............................................................................................. 5
       3.1.2           Monetary Policy Implementation ............................................................................... 6
    3.2        Interest Rate Developments ........................................................................................................... 7
       3.2.1           Yields on Government Securities ............................................................................... 7
       3.2.2           Lending and deposit Interest Rates ............................................................................ 8
    3.3        Private Sector Credit ...................................................................................................................... 9
    3.4        Fiscal Policy ................................................................................................................................. 12
       3.4.1           Public Debt .............................................................................................................. 13
    3.5        Balance of Payments and Exchange rates ..................................................................................... 14
       3.5.1           Exchange Rate Developments.................................................................................. 16
    3.6 Domestic Economic Activity .............................................................................................................. 18
    3.7 Consumer Price Inflation.................................................................................................................... 20
       3.7.1     Recent Inflation Developments ................................................................................ 20
       3.7.2 Inflation Outlook ........................................................................................................... 21
4      Conclusion ........................................................................................................................................... 22

ii | P a g e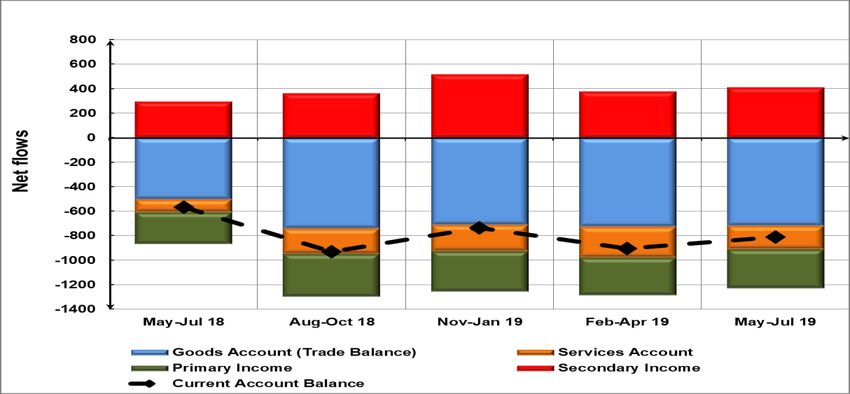
List of Figures
Figure 1: Commodity Price ............................................................................................................................ 3

Figure 2: Movement in the 10-year Government Bond Yields ..................................................................... 5

Figure 3: The 7-day Interbank Rate and Central Bank Rate .......................................................................... 7

Figure 4: Secondary Market Yields on T-bills and T-bonds ........................................................................... 8

Figure 5: Lending Rates by Sector ................................................................................................................. 9

Figure 6: Annual Growth and Contributions to Private Sector Credit ........................................................ 10

Figure 7: Sectoral Growth in Private Sector Credit ..................................................................................... 11

Figure 8: Current Account Balance and Components ................................................................................. 15

Figure 9: Developments in Overall Balance of Payments and Main Components ..................................... 16

Figure 10: Changes in the NER, Inflation Differential and REER ................................................................. 17

Figure 11: Trends of Selected EAC Partner State Exchange Rates .............................................................. 17

Figure 12: Real GDP Growth by Expenditure .............................................................................................. 19

Figure 13: Domestic Inflation Developments ............................................................................................. 21

Figure 14: Inflation Outlook ........................................................................................................................ 21

                                                                List of Tables
Table 1: Global Growth Projections .............................................................................................................. 2

Table 2: Inflation Rates in Selected Countries .............................................................................................. 4

Table 3: Non Performing Loans by sector ................................................................................................... 12

Table 4: Fiscal Operations (Shs. Billion) ...................................................................................................... 13

Table 5: Public Debt Developments ............................................................................................................ 14

iii | P a g e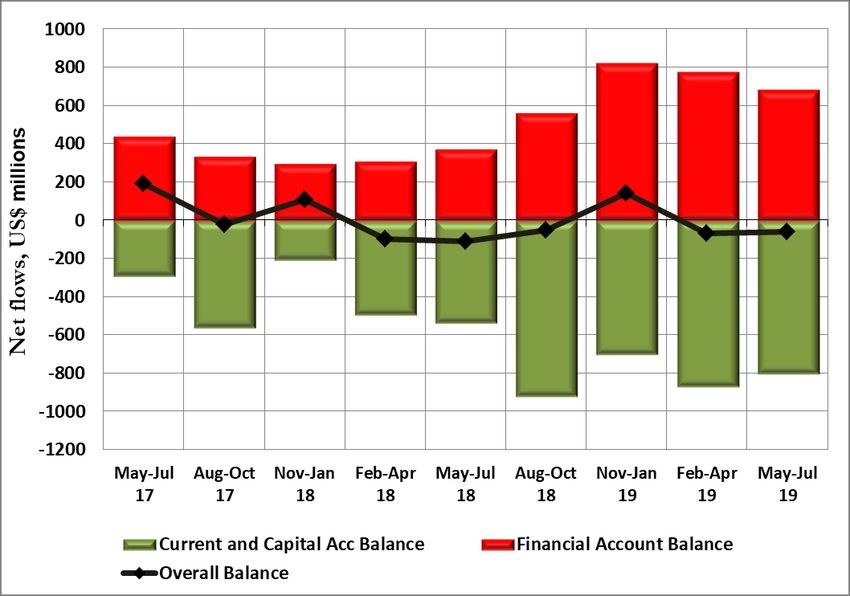
Acronyms and Abbreviations
AEs            Advanced Economies
BoP            Balance of Payments
BoU            Bank of Uganda
CA             Current Account
CBR            Central Bank Rate
CPI            Consumer Price Index
EU             European Union
EFU            Energy, Fuel and Utilities
EMDEs          Emerging Market and Developing Economies
FDI            Foreign Direct Investment
GDP            Gross Domestic Product
IFEM           Interbank Foreign Exchange Market
IMF            International Monetary Fund
NPL            Non- Performing Loans
OPEC           Organization of Petroleum Exporting Countries
PDMF           Public Debt Management Framework
PPs            Percentage Points
PSC            Private Sector Credit
PSI            Policy Support Instrument
REPOs          Repurchase Agreements
SSA            Sub- Saharan Africa
T-Bills        Treasury bills
T-Bonds        Treasury bonds
UK             United Kingdom
US             United States
WEO            World Economic Outlook

iv | P a g e
Executive Summary

Global economic conditions continue to weaken. Declining trade and heightened uncertainty have
contributed to lower global growth. Central banks are easing monetary policy to support their
economies. Global growth is projected to be lower at 3.2 percent for 2019 and 3.5 percent for 2020, a
0.1 percentage point downward revision compared to April 2019 forecasts. Forecast for 2019 mostly
reflects downward revision to growth in Emerging Markets and Developing Countries. Risks remain
tilted to the downside, stemming mainly from escalating US tariff actions, currency wars, retaliation by
trading partners, no-deal Brexit, abrupt shifts in risk sentiment and disinflationary pressures.
Commodity prices have moderated in 2019, so far and remain relatively volatile owing to the impact of
the still-unfolding US tariff actions. Weaker crude oil prices have been mainly driven by concerns about
lower global economic growth prospects and the impact from the US-China tariff war. In the quarter to
August 2019, average crude oil prices declined by 10.1 percent quarter-on-quarter, and 17.1 percent
year-on-year, to USD62.1 per barrel from an average of USD71.9 per barrel in the same period of 2018.
Outlook is for commodity prices to drop in 2019 owing to dimmer global economic prospects.
Global inflationary pressures remain subdued and are expected to remain muted in 2019 and 2020.
Among key Advanced Economies (AE), inflation remains largely below central bank targets this far in
2019, allowing major central banks not only to postpone further increases in interest rates but to cut
rates or restart Quantitative Easing going forward in a bid to support growth in the face of escalating
trade tensions among other downside risks to growth. While inflation is above target in some key
Emerging Market Economies (EMEs), there has been some softening relative to May 2019. Outlook is
for low and stable inflation among AE and EMEs in 2019/2020, in line with forecasts for lower
commodity prices, however elevating risk of disinflation and further slowdown in global growth
momentum.
Global financial market conditions have eased further. In response to the weaker economic growth
outlook and low inflation environment, several major central banks have made their monetary policies
more accommodative. In July 2019, the US Fed cut the target range of the Fed Funds Rate by 0.25PPs
to 2-2.25 percent. In Aug-19, Reserve Bank of New Zealand cut the Official Cash rate to 1 percent from
1.5 percent, while the Reserve Bank of Australia lowered its cash rate to 1 percent from 1.25 percent. In
June 2019, the European Central Bank (ECB), in its forward guidance, undertook to provide additional
stimulus if economic conditions do not improve. Similarly, although the Bank of Japan kept monetary
policy steady in June 2019, it indicated it could combine interest rate cuts with bigger asset buying if
needed to stimulate the economy.
In the currencies market, the US Dollar continues to strengthen against major currencies this far in 2019
supported by a strong US economy. Indeed, the US Dollar index rose by 0.6 percent between Jan-19 and
July 2019 and by 1.8 percent year-on-year in July 2019. In the securities markets, 10-year government
bond yields continue to decline this far in 2019 consistent with outlook for lower inflation. Outlook is
for intermittent episodes of financial market volatility owing to trade policy uncertainty and indecisive
Brexit process.

   v|Page
On the domestic scene, The Bank of Uganda (BoU), in August 2019, maintained the Central Bank Rate
(CBR) at 10 percent. The band on the CBR was maintained at +/-3 percentage points (PPs) and the
margin on the rediscount rate at 4 PPs on the CBR, placing the rediscount rate and the bank rate at 14
percent and 15 percent, respectively. BoU continued to use Repurchase Agreements (REPOs)/reverse
REPOs and deposit auctions to align liquidity conditions in the domestic interbank market with the
desired monetary policy stance.
In line with the unchanged monetary policy stance, money market rates remained relatively stable in the
three months to August 2019. The weighted average 7-day interbank money market rate averaged 10.3
percent between the quarters to May and to August 2019.
Average yields on government securities continued to decline in the three months to August 2019, partly
on account of the accommodative monetary policy stance. Yields have been declining since the start of
2019. In the three months to August 2019, average yields on Treasury bills declined by an average of 0.2
percentage points (PPs) across all tenors to 9.4 percent (91-day) and 11.5 percent (364-day) compared to
an average decline of 0.9 PPs registered in the three months to May 2019. The 182-day paper, which is
mostly used in pricing commercial bank lending rates, remained relatively stable at 10.9 percent. Over
the same period, yields on Treasury Bonds also declined by an average of 0.7 PPs across all tenors.
Notably, there was a larger decline of 1.4 PPs to 14.9 percent for the 15 year Treasury bond which could
be a reflection of the lower withholding tax on securities with ten years or more to maturity. In addition,
there was a relatively high demand for Government securities, evidenced by huge oversubscriptions in
the auctions.
Commercial bank lending interest rates generally declined since the beginning of 2019. The gradual
decline in the shilling lending rate is reflective of the accommodative monetary policy stance. In the
quarter to July 2019, commercial bank lending interest rates remained relatively stable, averaging 20.0
percent compared to an average of 20.2 percent in the quarter to April 2019. However, in July 2019, the
Shilling lending rate increased to 21.4 percent from 19 percent in June 2019. Average lending rates on
US dollar-denominated loans remained largely stable at 7.0 percent during the quarter ended July 2019.
Over the same period, the weighted average shilling deposit rate also remained stable at 10.3 percent;
while the foreign currency deposit rate averaged 2.8 percent, lower than the 3.4 percent registered in the
quarter to April 2019.
Growth in private sector credit (PSC) continued to strengthen, largely supported by continued
improvement in economic activity, an accommodative monetary policy stance, and improvement in asset
quality (as reflected in lower non-performing loans (NPLs)). The year-on-year growth in PSC averaged
12.6 percent in FY2018/19, almost doubling the 6.8 percent recorded in FY2017/18. The growth in
PSC was largely driven by shilling denominated loans, which grew by 18.8 percent in FY 2018/19, from
10.9 percent in the previous year. Foreign currency denominated loans also recovered, recording year-
on-year growth of 2.4 percent, compared to 0.5 percent in FY 2017/18. On a quarter-on-quarter basis,
PSC also grew strongly at 4.2 percent in the three months to July 2019, compared to 2.1 percent in the
three months to April 2019.
Going forward, credit to the private sector is poised to improve further on account of lower risk
aversion (reflected in the decline in NPLs), strong economic activity and lower cost of borrowing. The

   vi | P a g e
Business lending survey (BLS) for June 2019 showed that commercial banks expected to maintain their
lending rates, while some banks anticipated a decrease in the subsequent quarter. Commercial banks also
expected a decrease in default rates on loans to enterprises linked to aggressive recovery measures and
the expected injection of funds by the Government to clear arrears. There was likelihood that banks
would ease the terms and conditions for loans to enterprises and prime borrowers. Furthermore, the
passing of the movable assets bill was expected to pave the way for increased access to financial services
by small borrowers, which in turn is likely to provide more support to credit growth.
However, there were some downside risks to the anticipated growth in the growth of PSC, which
include the implementation of IFRS9, which could limit the availability of loanable funds. In addition,
the high operational and funding costs related to the effects of past commitments, like long term fixed
deposits and the depreciated shilling, remain factors behind the slow reduction in lending interest rates
and could increase the cost of foreign currency borrowing for banks. The BLS also indicated a risk of
an increase in default rates on loans to households and individuals in the three months ahead linked to
delayed Government releases, impacting specifically salary loans coupled with seasonal effects usually
registered in the first quarter where obligations outweigh incomes. These factors could keep lending
rates elevated and limit further credit growth. However, on the flipside, operational costs are expected to
reduce as banks leverage technology.
Fiscal operations were less expansionary than programmed in FY 2018/19. Indeed, the projected fiscal
deficit including grants was 5.8 percent of GDP, lower than the budget by 0.8 percent of GDP over the
same period. The implementation of the budget was supported by a surplus in domestic revenue but
faced constraints from lower-than-target external financing (loans & grants) and slow execution of
infrastructural projects.
Fiscal Policy is projected to be expansionary in FY 2019/20 with a deficit to GDP of 8.7 percent.
Financing this deficit could be challenging. Moreover, Government revenue (including grants) in the first
month of FY2019/20 was lower than the approved budget by Shs. 307.8 billion to Shs 1.27 trillion.
Fiscal consolidation is projected from FY2020/21 but unlikely given the infrastructure projects in the
pipeline and other social spending needs and also the usual slow implementation of the projects.
The provisional total public debt stock as at end July 2019 stood at Shs. 47,109 billion (43 percent of
GDP), corresponding to year-on-year growth of 14.5 percent. The growth in the stock of total public
debt was mainly due to a 16.1 percent increase in the public domestic debt. The public external debt
grew by 13.7 percent from USD 7.3 billion to USD 8.3 billion, representing a dominant share of 65.5
percent of the total public debt.
In the quarter ended July 2019, the external sector recorded an overall deficit balance of US$59.9
million which was a USD10.7 million contraction from a deficit of USD70.6 million recorded in the
quarter to April 2019. Preliminary data indicates that, the current account deficit improved by US$93.9
million to a deficit of USD 811.1 million during the quarter ended July 2019. The trade balance, which
continues to be a major component of the current account, improved by US$ 5.3 million to a deficit of
USD 717.2 million during the quarter ended July 2019. The financial account surplus was insufficient to
finance the deficit balance on the Current and Capital accounts; consequently, there was a drawdown in
Reserve of US$ 59.9 million during the quarter to July 2019.

   vii | P a g e
The outlook for the BOP in the short term is for the current account deficit to widen in FY2019/20
compared to the previous period. The current account deficit is expected to remain weak on account of
continued pickup in imports by the government and private sector. Similarly, the financial account
surplus is projected to widen, as inflows of capital through FDI and project loans are expected to
increase.
The Uganda Shilling remains largely stable with a bias towards appreciation. On a quarterly basis, the
Shilling strengthened by 0.8 percent against the US Dollar, to an average midrate of Shs 3,706.4/USD in
the three months to August 2019, compared to the weakening by 1.1 percent observed in the quarter
ended May 2019. Similarly, on a month-on-month basis, the Shilling strengthened by 0.1 in August 2019
and 1.0 percent year- on-year to a mid-rate of Shs. 3,693.7/ USD, driven largely by Strong inflows
mainly from of strong inflows mainly from NGOs and Financial Institutions and export proceeds. On
trade weighted basis (Nominal Effective Exchange Rate – NEER), the exchange rate appreciated by 1.4
percent quarter on quarter, and 4.4 percent year-on-year in the quarter ended August 2019.
In the last two Financial Years (FY) Uganda’s economy has grown on average by 6.1 percent from a
growth of 3.9 percent in FY2016/17. Investor surveys suggest that business conditions and sentiments
are strong. Credit to the private sector has improved, helped by an accommodative monetary policy
stance.
The economy is expected to maintain this growth momentum and is projected to grow between 6.0 and
6.3 percent in FY 2019/20 and between 6.5 and 7.0 percent in the medium term. The growth prospects
are supported by private sector credit growth, on the back of accommodative monetary policy; public
investment in infrastructure; higher agricultural output due to favourable weather and government
efforts in improving agriculture; improved regional security (South Sudan and DRC) which could boost
Uganda’s exports.
There are downside risks to growth including: Lower external demand due to a depressed global
economy; political and policy uncertainty which are very elevated in several major economies with global
growth continuing to be biased downwards. Already, odds for a global recession are very high; weather
conditions remain a risk for agriculture sector; continued low absorption by government is likely to
moderate the expected support from government investment and multiplier effect on growth; widening
fiscal deficits and associated financing risks given the fact that Government had borrowed Shs.1.5 billion
from BoU by August 2019, moreover if the revenue shortfall observed in July 2019 persists, this could
hinder growth; persistently high non-performing loans in agricultural sector which have potential to
curtail further investment in the sector, and in effect moderate anticipated strong GDP growth; the
decision to postpone the Financial Investment Decision(FID) could have an impact on the investment
in the oil sector which could hinder economic growth in the outer years.
Domestic inflation remains subdued, with annual headline and core inflation averaging 2.7 percent and
3.7 percent, respectively in the quarter to August 2019. Low inflation protects the purchasing power of
Ugandans, importantly poor households.
Even though the inflation projections for August 2019 round of forecast indicate inflation to be higher
in the near term by 0.6 percentage point, outlook for inflation is still soft. However, there are risks to the
inflation forecast: global economic conditions are expected to continue dampening domestic growth and
    viii | P a g e
inflation; the future direction of food crops prices; momentum of domestic demand; widening fiscal deficit and financing; election cycle and associated sentiments and risks. Inflation outlook is favourable, with inflation projected to stabilize around the 5.0 percent target in the medium term. Given the current inflation outlook, BoU has kept the policy rate on hold since October 2018.The evaluation of the macroeconomic developments, current information set and outlook suggests that at the current CBR, monetary policy stance is accommodative, and that inflation will converge to the target in the medium term while supporting growth. ix | P a g e
1       Background

This report presents domestic and external economic developments in the period to August
2019. It assesses the future prospects for the global and domestic economy, including economic
growth and inflation. It also presents the risks to the domestic economic outlook, the policy
challenges in the medium term and the implications of the domestic economic outlook on the
future direction of monetary policy.

2       Global Economic Environment

 2.1     Economic Activity

Global economic conditions continued to weaken during the first half of 2019, on the back of
declining trade and heightened uncertainty. While growth was buoyant in Advanced Economies
(AEs), activity in Emerging Market and Developing Economies (EM&DEs) was lower than
anticipated. At 0.9 percent and 2.7 percent, Q1 2019 growth in the United States and Japan
remained resilient, and the temporary factors which had hurt growth in the Euro area in 2018
waned, keeping quarterly growth stable at 1.2 percent. On the other hand, the quarterly growth
data out of China, Argentina, Brazil, and India point to weakening activity.

According to the IMF July 2019 WEO, global growth is projected at 3.2 percent in 2019 and 3.5
percent in 2020, 0.1 PPs downward revision from the April 2019 forecast. As highlighted in
Table 1, the lower forecasts for 2019 mostly reflect downward revision to growth in EM&DEs.
The revision arises mainly from the impact of escalating tariffs on an already slowing Chinese
economy and lower expected domestic demand growth in India; weak sentiment and policy
uncertainty in key Latin American economies mainly in Brazil, Mexico and Venezuela; and
softer growth in Sub-Saharan Africa (SSA), mainly dragged down by subdued activity in South
Africa arising from the stronger adverse impact of strikes, energy supply constraints in the
mining sector, and weak agricultural production. Growth is expected to pick up in 2020 on the
assumption that global financial markets remain accommodative; that temporary drags on
growth continue to dissipate; and that stressed emerging market economies stabilise.

Risks to global growth outlook remain tilted to the downside, stemming mainly from the
escalating trade tensions that have the potential of undoing the central banks’ policy stimuli, a
no-deal Brexit, abrupt shifts in risk sentiment, and disinflationary pressures.

1|Page
Table 1: Global Growth Projections

Source: IMF - WEO April 2019, Economist Intelligence Unit – World Economic
Summary May 2019

  2.2    Global Commodity Prices and Inflation

2.2.1   Commodity Prices

Commodity prices have moderated in 2019, so far and remain relatively volatile owing to the
impact of the still-unfolding US tariff actions. Weaker crude oil prices have been mainly driven
by concerns about lower global economic growth prospects and the impact from the US-China
tariff war. In the quarter to August 2019, average crude oil prices declined by 10.1 percent
quarter-on-quarter, and 17.1 percent year-on-year, to USD62.1 per barrel from an average of
USD71.9 per barrel in the same period of 2018.

The FAO food price index, a measure of global food prices, indicated that average food prices
rose by 2.4 percent on a quarterly basis, and 1.6 percent on a yearly basis, in the quarter to July
2019. However, month-on-month, prices declined by 1.1 percent in July 2019, subdued by large
export supplies of some cereals and expectation of high sugarcane yields in India.

The outlook is for commodity prices to drop in 2019, owing to dimmer global economic
prospects. According to the IMF WEO July 2019, average crude oil prices are projected to fall
by 4.1 percent to USD65.5 in 2019 and by 2.5 percent in 2020. The US Energy Information
Administration (EIA) projects West Texas Intermediate (WTI) spot prices to drop by 10
percent to USD57.9 per barrel in 2019 but pick up by 2.8 percent in 2020. Agricultural
commodity prices are projected to generally decline in 2019 and recover slightly in 2020. The
global commodity price developments are depicted in Figure 1.
2|Page
Figure 1: Commodity Price
  Avg Crude Oil Prices, US$/Brl    50%
                                   40%
    Price Indices, 2010=100

      Quarterly % Changes
                                   30%
                                   20%
                                   10%
                                    0%
                                  -10%
                                  -20%
                                  -30%
                                  -40%

                                                                                                                                                                                  2016Q4
                                                                                                                                                                                           2017Q1
                                           2013Q1
                                                    2013Q2
                                                             2013Q3
                                                                      2013Q4
                                                                               2014Q1
                                                                                        2014Q2
                                                                                                 2014Q3
                                                                                                          2014Q4
                                                                                                                   2015Q1
                                                                                                                            2015Q2
                                                                                                                                     2015Q3
                                                                                                                                              2015Q4
                                                                                                                                                       2016Q1
                                                                                                                                                                2016Q2
                                                                                                                                                                         2016Q3

                                                                                                                                                                                                    2017Q2
                                                                                                                                                                                                             2017Q3
                                                                                                                                                                                                                      2017Q4
                                                                                                                                                                                                                               2018Q1
                                                                                                                                                                                                                                        2018Q2
                                                                                                                                                                                                                                                 2018Q3
                                                                                                                                                                                                                                                          2018Q4
                                                                                                                                                                                                                                                                   2019Q1
                                                                                                                                                                                                                                                                            2019Q2
                                         Energy Prices                                  Non Energy Prices                                               Avg. Crude oil price                                              FAO Food Price

Source: World Bank & FAO

2.2.2                  Global Inflation

Global inflationary pressures remained subdued, and are expected to remain mute in 2019 and
2020. Among key AEs, inflation remains largely below the average central bank target of 2
percent this far in 2019. This development allowed room for major central banks not only to
postpone further increases in interest rates but to cut rates or restart quantitative easing going
forward, in the face of the downside risks to growth. Average inflation fell in July 2019, to 0.5
percent in Japan, 1.0 percent in the Euro Area, and 1.8 per cent in the US from respective rates
of 0.9 percent, 1.7 percent, and 2.0 percent in April 2019. Inflation remained stable at 2.0
percent in the UK. However, while inflation in key Emerging Market Economies (EMEs) was
relatively elevated and close to or above the average 4 percent central bank target, there has
been a general softening since May 2019. Inflation developments in selected countries are
shown in Table 2.

The outlook is for low or stable inflation among AEs and EMEs in 2019/2020, in line with the
projections of lower commodity prices and a further slowdown in in global growth momentum.
In AEs, inflation is projected to drop to 1.6 percent in 2019 from 2.0 percent in 2018, but rise
to 2.0 percent in 2020. In EMDEs, inflation is projected to remain stable at 4.8 percent in 2019
before decreasing slightly to 4.7 percent in 2020. Inflation outlook for EMDEs is driven largely
by idiosyncratic factors in a few countries especially in Latin America.

3|Page
Table 2: Inflation Rates in Selected Countries
Quarterly Monthly
Q2- Q3- Q4- Q1- Q2- Jan- Feb- Mar- Apr- May- Jun- Jul-
2018 2018 2018 2019 2019 2019 2019 2019 2019 2019 2019 2019
Japan 0.6 1.1 0.9 0.3 0.8 0.2 0.2 0.5 0.9 0.7 0.7 0.5
UK 2.2 2.3 2.1 1.8 2.0 1.8 1.8 1.8 2.0 1.9 1.9 2.0
US 2.7 2.6 2.2 1.6 1.8 1.6 1.5 1.9 2.0 1.8 1.6 1.8
Euro area 1.7 2.1 1.9 1.4 1.4 1.4 1.5 1.4 1.7 1.2 1.3 1.0
Brazil 3.3 4.4 4.1 4.1 4.3 3.8 3.9 4.6 4.9 4.7 3.4 3.2
China 1.8 2.3 2.2 1.8 2.6 1.7 1.5 2.3 2.5 2.7 2.7 2.8
India 4.0 5.6 5.1 7.1 8.5 6.6 7.0 7.7 8.3 8.7 8.6 6.0
Russia 2.4 3.0 3.9 5.2 5.0 5.0 5.2 5.3 5.2 5.1 4.7 4.6
South Africa 4.3 4.9 4.8 4.2 4.4 3.9 4.1 4.5 4.4 4.4 4.5 4.0
Source: OECD Statistics
2.3 Global Financial Markets
Global financial market conditions have eased further. In response to the weaker economic
growth outlook and low inflation environment, several major central banks have made their
monetary policies more accommodative. In July 2019, the US Fed cut the target range of the
Fed Funds Rate by 0.25PPs to 2-2.25 percent. In Aug-19, Reserve Bank of New Zealand cut the
Official Cash rate to 1 percent from 1.5 percent, while the Reserve Bank of Australia lowered its
cash rate to 1 percent from 1.25 percent. In June 2019, the European Central Bank (ECB), in its
forward guidance, undertook to provide additional stimulus if economic conditions do not
improve. Similarly, although the Bank of Japan kept monetary policy steady in June 2019, it
indicated it could combine interest rate cuts with bigger asset buying if needed to stimulate the
economy.
In the securities markets, sovereign 10-year bond yields subsequently declined further – in many
cases to historical lows – and credit spreads remain narrower than a year ago (Figure 2). In the
currencies market, the US Dollar continues to strengthen against major currencies this far in
2019 supported by a strong US economy. The US Dollar Index rose by 1.3 percent between
January 2019 and August 2019 and by 2.1 percent year-on-year in August 2019.
Despite the easing global financial conditions, intermittent episodes of financial market volatility
are expected owing to trade policy uncertainty and an indecisive Brexit process.
4|PageFigure 2: Movement in the 10-year Government Bond Yields Source: Thomas Reuters Eikon 2.4 Implications for the Uganda Economy Global economic conditions have weakened further, on the back of declining trade and heightened uncertainty. Given that more than half of Uganda’s exports go to Sub-Saharan Africa whose growth is now projected to be lower, Uganda’s GDP growth may be moderated in 2019, with some improvement in 2020. Global inflationary pressures are muted in line with largely lower commodity prices in 2019. This implies low imported inflation which will support low domestic inflation in 2019. The unease in global financial markets could reduce investor risk appetite lowering capital flows to EMDEs including Uganda, with dampening effect on investment and domestic growth. Changes in capital flows could also lead to exchange rate volatility. 3 Domestic Economic Developments 3.1 Monetary Policy and Implementation 3.1.1 Monetary Policy Stance The Bank of Uganda (BoU), in August 2019, maintained the Central Bank Rate (CBR) at 10 percent. The band on the CBR was maintained at +/-3 percentage points (PPs) and the margin on the rediscount rate at 4 PPs on the CBR, placing the rediscount rate and the bank rate at 14 percent and 15 percent, respectively. 5|Page
During the August 2019 forecast round, the inflation outlook remained relatively unchanged
from the previous period. Core inflation was projected to rise slightly in the near term and stay
close to the 5 percent target in the course of next four quarters before peaking at 6.4 in the third
quarter of 2020. Similarly, headline inflation was forecast to rise slightly in the near term before
returning to 5 percent in the medium term. The risks to inflation were relatively well balanced
including, the future path of the exchange rate, higher fiscal stimulus, adverse weather
conditions that could lead to a rise in inflation.

Economic growth was estimated at 6.3 percent in the financial year (FY) 2019/20, and over 6
percent in the medium term supported by strengthening private sector activity, public
investment in infrastructure; higher agricultural output due to favourable weather and
government efforts in improving agriculture; improved regional security (South Sudan and the
Democratic republic of Congo (DRC)) which could boost Uganda’s exports. However, risks to
economic growth remained including the widening fiscal deficit, persistently high non-
performing loans in agricultural sector, vagaries of weather, rising global trade tensions, the
political and security situation in the run-up to the 2021 general elections, further delays in the
start of oil production, spreading of Ebola from DRC, and security concerns and political
tensions which could dampen confidence.

3.1.2   Monetary Policy Implementation

BoU continued to use Repurchase Agreements (REPOs)/reverse REPOs and deposit auctions
to align liquidity conditions in the domestic interbank market with the desired monetary policy
stance. The net outstanding stock of REPOs and deposit auctions as at end August 2019 was
Shs. 946 billion and Shs. 512.3 billion, respectively.

In line with the unchanged monetary policy stance, money market rates remained relatively
stable in the three months to August 2019. The weighted average 7-day interbank money
market rate averaged 10.3 percent between the quarters to May and to August 2019. The CBR
continued to anchor movements in the 7-day money market rate as depicted below in Figure 3.

6|Page
Figure 3: The 7-day Interbank Rate and Central Bank Rate

Source: Bank of Uganda

3.2     Interest Rate Developments

3.2.1   Yields on Government Securities

Average yields on government securities continued to decline in the three months to August
2019, partly on account of the accommodative monetary policy stance. Yields have been
declining since the start of 2019. In the three months to August 2019, average yields on
Treasury bills declined by an average of 0.2 percentage points (PPs) across all tenors to 9.4
percent (91-day) and 11.5 percent (364-day) compared to an average decline of 0.9 PPs
registered in the three months to May 2019. The 182-day paper, which is mostly used in pricing
commercial bank lending rates, remained relatively stable at 10.9 percent. Over the same period,
yields on Treasury Bonds also declined by an average of 0.7 PPs across all tenors. Notably, there
was a larger decline of 1.4 PPs to 14.9 percent for the 15 year Treasury bond which could be a
reflection of the lower withholding tax on securities with ten years or more to maturity. In
addition, there was a relatively high demand for Government securities, evidenced by huge
oversubscriptions in the auctions.

In line with movements in the primary market, there was a continued downward shift in the
yield curve across the maturity spectrum in the secondary market. The declining yields are
indicative of lower inflation expectations. Figure 4 shows the trend in the secondary market
yields on government securities since the three months to February 2019.

7|Page
Figure 4: Secondary Market Yields on T-bills and T-bonds
                              18.0
 Secondary Market Rates
  Annualised Yields (%)

                              15.0
                                                                        Steady decline from
                                                                        Q-Jan'19 to Q-Aug'19
                              12.0

                              9.0
                                     91-days   182-days   364-days   2-years       3-years     5-years   10-years   15-years
                          Q-Feb'19     10.6      12.1       12.4       15.9          16.5        16.8      17.3       17.6
                          Q-May'19     9.5       10.6       11.1      13.4           14.9       15.4       15.8       16.4
                          Q-Aug'19     9.2       10.4       10.7      12.5           13.7       14.6       15.3       15.6
Source: Bank of Uganda

3.2.2                     Lending and deposit Interest Rates

Bank lending to households and businesses remains an important channel through which
monetary policy affects the economy. Commercial bank lending interest rates generally declined
since the beginning of 2019. The gradual decline in the shilling lending rate is reflective of the
accommodative monetary policy stance. In the quarter to July 2019, commercial bank lending
interest rates remained relatively stable, averaging 20.0 percent compared to an average of 20.2
percent in the quarter to April 2019. However, in July 2019, the Shilling lending rate increased
to 21.4 percent from 19 percent in June 2019. Average lending rates on US dollar-denominated
loans remained largely stable at 7.0 percent during the quarter ended July 2019. Over the same
period, the weighted average shilling deposit rate also remained stable at 10.3 percent; while the
foreign currency deposit rate averaged 2.8 percent, lower than the 3.4 percent registered in the
quarter to April 2019.

A decomposition of lending rates by sector for the quarter ended July 2019 showed a slight
increase in lending rates to the key sectors of trade, agriculture and building, construction and
real estate by 0.6 PPs, 0.3 PPs and 1.1 PPs, respectively, to an average of 19.2 percent, 21.4
percent and 21.2 percent, while the personal and household loans declined by 0.2 PPs in the
three months to July 2019 to an average of 21.9 percent. The lending rates by sector are
depicted in Figure 5.

8|Page
Figure 5: Lending Rates by Sector Source: Bank of Uganda 3.3 Private Sector Credit Growth in private sector credit (PSC) continued to strengthen, largely supported by continued improvement in economic activity, an accommodative monetary policy stance, and improvement in asset quality (as reflected in lower non-performing loans (NPLs)). The year- on-year growth in PSC averaged 12.6 percent in FY2018/19, almost doubling the 6.8 percent recorded in FY2017/18. The growth in PSC was largely driven by shilling denominated loans, which grew by 18.8 percent in FY 2018/19, from 10.9 percent in the previous year. Foreign currency denominated loans also recovered, recording year-on-year growth of 2.4 percent, compared to 0.5 percent in FY 2017/18. On a quarter-on-quarter basis, PSC also grew strongly at 4.2 percent in the three months to July 2019, compared to 2.1 percent in the three months to April 2019. Net of valuation changes on account of exchange rate movements, the average annual PSC grew by 14.8 percent in the quarter to July 2019, higher than the 14.0 percent growth recorded in the quarter to April 2019 and 10.9 percent in the quarter to July 2018. Specifically, foreign currency denominated loans grew by 7 percent, doubling from the 3.5 percent growth registered in the quarter to April 2019. Developments in private sector credit are shown in Figure 6. 9|Page
Figure 6: Annual Growth and Contributions to Private Sector Credit
          22.0

          18.0

          14.0

          10.0
Percent

           6.0

           2.0

          -2.0

          -6.0
                 Jan-17

                                     May-17

                                                                          Jan-18

                                                                                              May-18

                                                                                                                                  Jan-19

                                                                                                                                                    May-19
                                                       Sep-17

                                                                                                                Sep-18

                                                                                                                         Nov-18
                                              Jul-17

                                                                                                       Jul-18

                                                                                                                                           Mar-19

                                                                                                                                                             Jul-19
                          Mar-17

                                                                 Nov-17

                                                                                   Mar-18
                                   PSC Shs.                     PSC fx                      Total PSC                    PSC (Net Revaluation)
Source: Bank of Uganda

 Credit growth remains robust across most sectors supported by strong economic growth and
 lower non-performing loans (NPLs) as depicted by the sectoral decomposition in Figure 7.
 The manufacturing sector continued to register strong growth averaging 21.2 percent in the
 quarter to July 2019, slightly lower than the 22.5 percent growth registered in the quarter to
 April 2019. There was an improvement in growth in credit to the agriculture sector at 18.8
 percent in the quarter to July 2019 compared to 13.9 percent and 14.6 percent in the quarters to
 April and January 2019, respectively. Growth in credit to the building, mortgage, construction &
 real estate sectors, which has generally remained below average the industry average, recorded a
 recovery, growing at 12.9 percent in the quarter to July 2019 compared to 9.9 percent and 9.1
 percent respectively in the quarters to April and January 2019. Over the same period however,
 growth in credit to the trade sector declined to an average of 14.8 percent from 16.1 percent
 recorded in the previous period.

 Going forward, credit to the private sector is poised to improve further on account of lower
 risk aversion (reflected in the decline in NPLs), strong economic activity and lower cost of
 borrowing. The Business lending survey (BLS) for June 2019 showed that commercial banks
 expected to maintain their lending rates, while some banks anticipated a decrease in the
 subsequent quarter. Commercial banks also expected a decrease in default rates on loans to
 enterprises linked to aggressive recovery measures and the expected injection of funds by the
 Government to clear arrears. There was likelihood that banks would ease the terms and
 conditions for loans to enterprises and prime borrowers. Furthermore, the passing of the
 movable assets bill was expected to pave the way for increased access to financial services by
 small borrowers, which in turn is likely to provide more support to credit growth.
10 | P a g e
However, there were some downside risks to the anticipated growth in the growth of PSC, which include the implementation of IFRS9, which could limit the availability of loanable funds. In addition, the high operational and funding costs related to the effects of past commitments, like long term fixed deposits and the depreciated shilling, remain factors behind the slow reduction in lending interest rates and could increase the cost of foreign currency borrowing for banks. The BLS also indicated a risk of an increase in default rates on loans to households and individuals in the three months ahead linked to delayed Government releases, impacting specifically salary loans coupled with seasonal effects usually registered in the first quarter where obligations outweigh incomes. These factors could keep lending rates elevated and limit further credit growth. However, on the flipside, operational costs are expected to reduce as banks leverage technology. Figure 7: Sectoral Growth in Private Sector Credit Source: Bank of Uganda In terms of asset quality, non-performing loans (NPLs) remained relatively low in the quarter to June 2019. As a percentage of total loans, NPLs remained at 3.8 percent in the quarter to June 2019 as in the preceding quarter (Table 3). The ratio of NPLs to total loans in the building, construction and real estate sector, which has a gross loan share of 20.1 percent, increased by 0.5 percent to 3 percent in the quarter to June 2019, while NPLs in the trade and commerce sector, with a 19.1 percent share of gross loans, have been on a steady decline from June 2018. The agriculture and services sectors were the most risky sectors as at June 2019, registering sectoral NPL ratios of 9.1 and 7.6, way above the industry average. Going forward, Banks are 11 | P a g e
expected to further ease overall credit standards as the asset quality continues to improve. This
will in turn boost private sector credit and enhance economic growth.

Table 3: Non Performing Loans by sector
                                                                        Jun-18   Sep-18   Dec-18 Mar-19   Jun-19 Gross Loan
                             Non-Performing Loans as a share of Total
                                                                                                                 Share as at
                             Loans by sector
                                                                                                                 Jun' 19
                             BUILDING, CONSTRUCTION & REAL ESTATE        3.4      3.9      2.2    2.5      3.0       20.1
                             TRADE & COMMERCE                            5.2      6.3      4.0    3.6      3.2       19.1
      Breakdown by sector

                             PERSONAL AND HOUSEHOLD LOANS                2.8      3.3      2.6    2.8      2.6       18.3
                             MANUFACTURING                               1.4      1.9      2.3    2.9      2.7       14.3
                             AGRICULTURE                                11.0      9.8      7.9    9.7      9.1       12.6
                             BUSINESS SERVICES                           6.1      3.7      2.7    3.1      2.8        4.6
                             TRANSPORT & COMMUNICATION                   3.1      4.3      2.6    1.5      3.4        4.4
                             COMMUNITY, SOCIAL AND OTHER SERVICES        5.8      3.8      3.0    8.0      7.6        3.2
                             ELECTICITY & WATER                          0.1      0.1      0.0    0.1      0.3        2.0
                             OTHER ACTIVITIES                           14.3     21.8      8.6    6.7      4.0        0.9
                             MINING & QUARRYING                          5.2      4.7      0.4    0.3      0.8        0.6
                             5 Banks with a large share ( >8%)           4.1      4.3      3.0    3.1      3.1        62.0
  Category
  of Banks

                             14 Banks with a moderate share (1-8%)       4.8      5.2      4.0    4.9      4.4        35.0
                             5 Banks with a small share (
underperformance in the external loan disbursements may in part be attributed to slow
absorption by Government projects.
The developments in government revenue and expenditure resulted in a fiscal deficit inclusive
of grants of Shs. 6,243.4 billion, which was lower than the approved budget deficit by Shs.
1,184.1 billion. The fiscal operations are depicted in Table 4.
Table 4: Fiscal Operations (Shs. Billion)
July’17- Prel. July'18- Approved Budget
Variation
June’18 June’19 July’18-June’19
Revenue & Grants 15,281.1 17,262.5 18,046.2 -783.7
Revenue 14,506.9 16,637.8 16,358.8 279.0
Grants 774.2 624.7 1,687.4 -1,062.7
Expenditure & Lending 20,183.4 23,505.9 25,473.7 -1,967.8
Current Expenditure 10,916.0 12,092.8 12,249.6 -156.8
Development Expenditure 7,566.1 9,707.5 11,912.7 -2,205.2
Net lending/repayments1 1,396.5 1,286.7 1,050.8 235.9
Domestic arrears 304.9 418.9 260.6 158.3
Deficit (excluding grants)
repayment -5,676.5 -6,868.1 (9,114.9) 2,246.8
Deficit (including grants) -4,902.3 -6,243.4 (7,427.6) 1,184.1
Financing (net) 4,902.3 6,243.4 7,427.6 -1,184.1
External Financing (net) 3,496.2 3,632.4 5,442.1 -1,809.7
Domestic Financing (net) 1,358.1 2,464.2 1,985.4 478.8
Errors & Omissions 48.0 146.9 0.0
% of GDP
Revenue & Grants 15.2 15.4 16.1 -0.7
Expenditure & Lending 20.1 21.0 22.7 -1.7
Deficit (including grants) 4.9 5.6 6.6 -1.0
Source: Ministry of Finance, Planning and Economic Development (MOFPED)
Fiscal Policy is projected to be expansionary in FY 2019/20 with a deficit to GDP of 8.7
percent. Financing this level of deficit will be challenging. Moreover, this is premised on
domestic revenue to GDP of 16.3 percent, which is an increase of 1.2 percentage points
compared to FY2018/19. Indeed, government revenue (including grants) in the first month of
FY2019/20 was lower than the approved budget by Shs. 307.8 billion. Fiscal consolidation is
projected from FY2020/21 but this is unlikely given the numerous infrastructure projects in the
pipeline and other social spending needs and also the usual slow implementation of the projects.
3.4.1 Public Debt
13 | P a g eThe provisional total public debt stock as at end July 2019 stood at Shs. 47,109 billion (43
percent of GDP), corresponding to year-on-year growth of 14.5 percent. The growth in the
stock of total public debt was mainly due to a 16.1 percent increase in the public domestic debt.
The public external debt grew by 13.7 percent from USD 7.3 billion to USD 8.3 billion,
representing a dominant share of 65.5 percent of the total public debt. With the exception of
the ratio of the stock of government securities to the stock of private sector credit which stands
at 102.1 percent, above the benchmark of 75 percent, all the public domestic debt risk
indicators were within the Public Debt Management Framework (PDMF 2013) medium term
benchmarks (Table 5).
Table 5: Public Debt Developments
PDMF Jun’17 Jun’18 Jun’19
Percent maturing in 1 year 3Yrs 3.7 3.8 3.9
(ATM) (years)
Total Stock/PSCtransport. Over the same period, the primary income balance deteriorated by USD 8.1 million to a deficit of USD316.3 million during the quarter ended July 2019, owing to higher income payable to foreign investors. On the other hand, the secondary income balance improved by USD36.4 million to a surplus of USD414.3 million, on account of a USD56.4 million increase in NGO’s receipts. Figure 8: Current Account Balance and Components The capital account balance deteriorated by USD28.4 million in the quarter ended July 2019 to USD7.6 million from USD36.0 million in the previous quarter. The developments in the current and capital account yielded a net borrowing balance of USD803.5 million, a decline of USD65.5 million relative to the quarter ended April 2019. Capital inflows of USD686.9 million were received in the quarter to July 2019, down from inflows of USD778.0 million in the previous quarter. This was driven by lower loan disbursements for public investments in the period under review. However, on an annual basis, the financial account inflows increased by USD 1531.3 million in the 12 months to July 2019 mainly on account of FDI inflows, higher loan disbursements and lower portfolio investment outflows. The financial account surplus was insufficient to finance the deficit balance on the Current and Capital accounts; consequently, there was a drawdown in Reserve of US$ 59.9 million during the quarter to July 2019 as depicted in Figure 9. Similarly, on an annual basis, the financial account surplus was insufficient to finance the current and capital account, leading to a drawdown of reserves by USD 41.4 million. The stock of reserves as at the end of July 2019 was estimated at USD3,342.4 million (including valuation changes), equivalent to 4.1 months of future imports of goods and services, a decline from USD3,434.3 million (4.3 months of import 15 | P a g e
cover) as at end April 2019.

Figure 9: Developments in Overall Balance of Payments and Main Components

Source: Bank of Uganda

The outlook for the BOP in the short term is for the current account deficit to widen in
FY2019/20 compared to the previous period. The current account deficit is expected to remain
weak on account of continued pickup in imports by the government and private sector.
Similarly, the financial account surplus is projected to widen, as inflows of capital through FDI
and project loans are expected to increase.

3.5.1   Exchange Rate Developments

The Uganda Shilling remains largely stable with a bias towards appreciation. On a quarterly
basis, the Shilling strengthened by 0.8 percent against the US Dollar, to an average midrate of
Shs 3,706.4/USD in the three months to August 2019, compared to the weakening by 1.1
percent observed in the quarter ended May 2019. Similarly, on a month-on-month basis, the
Shilling strengthened by 0.1 in August 2019 and 1.0 percent year- on-year to a mid-rate of Shs.
3,693.7/ USD, driven largely by Strong inflows mainly from of strong inflows mainly from
NGOs and Financial Institutions and export proceeds.

On trade weighted basis (Nominal Effective Exchange Rate – NEER), the exchange rate
appreciated by 1.4 percent quarter on quarter, and 4.4 percent year-on-year in the quarter ended

16 | P a g e
August 2019. On monthly basis the NEER also appreciated by 1.1 percent in August 2019 and
3.5 percent year-on-year. Taking inflation into account, the real effective exchange rate (REER)
appreciated by 0.3 percent month on month and 4.7 percent year on year on in July 2019.
Developments in the exchange rate are depicted in Figure 10.

Figure 10: Changes in the NER, Inflation Differential and REER
             9
             7
             5
             3
             1
            -1
 Per cent

            -3
            -5
            -7
            -9
                                                                                                                         Jun-18

                                                                                                                                                                                                                                     Jun-19
                                                                            Jan-18
                                                                                     Feb-18

                                                                                                                May-18

                                                                                                                                                                                        Jan-19
                                                                                                                                                                                                 Feb-19

                                                                                                                                                                                                                            May-19
                      Jul-17

                                                                                                                                  Jul-18

                                                                                                                                                                                                                                              Jul-19
                                                 Oct-17
                                                          Nov-17

                                                                                                                                                             Oct-18
                                                                                                                                                                      Nov-18
                                        Sep-17

                                                                                                       Apr-18

                                                                                                                                                    Sep-18

                                                                                                                                                                               Dec-18

                                                                                                                                                                                                                   Apr-19
                               Aug-17

                                                                   Dec-17

                                                                                              Mar-18

                                                                                                                                           Aug-18

                                                                                                                                                                                                          Mar-19
                                                 Y-o-Y UGX/USD Change                                                    Inflation Differential                                         Y-O-Y REER Change

Source: Bank of Uganda

Developments in regional exchange rates were mixed during the three months to August 2019,
with the Uganda Shilling appreciating, the Tanzania Shilling remaining largely stable and the
Kenya Shilling and Rwanda Franc depreciating slightly against the US dollar (Figure 11). The
Kenya Shilling appreciated by 1.8 percent to average KES 102.7/US$, the Tanzania Shilling
depreciated by 0.01 percent to average TZS 2,300.5/US$, while the Rwanda Franc depreciated
by 1.1 percent to average RWF 900.2/US$ in the quarter ended August 2019 compared to the
previous quarter ended May 2019.

Figure 11: Trends of Selected EAC Partner State Exchange Rates
                 4%                        UGX/USD                                            KES/USD                                      RWF/USD                                          TZShs/USD
                 3%
                 2%
                 1%
 Monthly Percentage

                 0%
     Changes

               -1%
               -2%
               -3%
                                 2017 M11
                                 2017 M01
                                 2017 M02
                                 2017 M03
                                 2017 M04
                                 2017 M05
                                 2017 M06
                                 2017 M07
                                 2017 M08
                                 2017 M09
                                 2017 M10

                                 2017 M12
                                 2018 M01
                                 2018 M02
                                 2018 M03
                                 2018 M04
                                 2018 M05
                                 2018 M06
                                 2018 M07
                                 2018 M08
                                 2018 M09
                                 2018 M10
                                 2018 M11
                                 2018 M12
                                 2019 M01
                                 2019 M02
                                 2019 M03
                                 2019 M04
                                 2019 M05
                                 2019 M06
                                 2019 M07
                                 2019 M08

Source: Bank of Uganda

17 | P a g e
Conditions in the IFEM enabled BoU to boost foreign exchange reserves. Indeed, in the three months to August 2019, the BoU purchased US$ 249.9 million for reserve build-up and sold US$35.4 million in targeted sales, as a result the net foreign currency purchased in the IFEM for reserve build-up was US$ 214.5 million. In the short to the medium term, the exchange rate may depreciate on account of strong government and private sector import demand as more projects get underway and economic activity continues to strengthen. 3.6 Domestic Economic Activity In line with previous estimates of 6.0 - 6.5 percent growth for the FY 2018/19, Uganda Bureau of Statistics (UBOS) estimates indicate that the economy expanded at 6.1 percent, 0.1 PPs lower than the growth in FY2017/18, at 6.2 percent. The estimation is consistent with the BoU’s high frequency indicator of economic activity – the composite index of economic activity (CIEA) data, where annual growth was projected at about 5.9 percent, with a positive growth outlook in all economic sectors. On a quarterly basis, UBOS data indicated a lower GDP growth rate of 0.8 percent in the quarter to March 2019, pointing to a slowdown in economic activity. Similarly, the BoU’s CIEA estimated growth at 1.1 percent in the quarter to June 2019, compared to 1.7 percent growth in the preceding quarter, driven by lower growth in the agriculture, industry and the services sectors of 0.3, 0.6 and 1.4 percent relative to 0.5, 2.1 and 1.0 percent, respectively in the quarter to March 2019. If the projected slowdown is to materialise, there is likelihood that the 6.2 percent growth projected for FY 2018/19 might not be realised. Stanbic bank’s Purchasing Managers Index (PMI) grew to 57.5 in August 2019, from 58.2 in the preceding month, signalling a decline in business conditions in the private sector but still above the average. The index moved in line with business confidence indices, which remained in the optimistic territory in the quarter to July 2019. Notwithstanding the continued optimism by businesses, confidence indices were less upbeat across all sectors, save for the agriculture and manufacturing sectors but with a less buoyant outlook. On the other hand, consumer sentiments on the economy improved, albeit still in the pessimistic zone, with expectations and current economic conditions sub-components registering an improvement. Figure 12 depicts the growth in GDP and CIEA. 18 | P a g e
Figure 12: Real GDP Growth by Expenditure

           4.00
           3.50
           3.00
 percent

           2.50
           2.00
           1.50
           1.00
           0.50
             -

                                   Quarterly changes-CIEA              UBOS GDP

Source: Uganda Bureau of Statistics

Looking forward, the Ugandan economy is projected to continue on its growth trajectory, as it’s
estimated to grow between 6 and 6.3 percent in FY 2019/20, and between 6.5 and 7.0 percent
over the medium term. Growth prospects are expected to emanate from strengthening private
sector activity; public investment in infrastructure; higher agricultural output due to favourable
weather and government efforts in improving agriculture. In addition, improvements in regional
security particularly in the Democratic Republic of Congo and South Sudan following the
signing of the revitalised peace agreement could provide an impetus to Uganda’s exports, and in
turn, boost growth. The start of oil production will provide additional boost to overall GDP.
Continued strong growth in services, industry, and construction will provide the needed
impetus to sustain strong overall growth. Growth in services (7-7.5 percent a year) will continue
to rely on strong performance in information and communication, transport, and tourism.
Industrial growth (5 percent) will be supported by the expansion of industrial parks, while
construction (7-8 percent) will be driven by public investment projects. Agriculture is expected
to grow on average 3 percent a year and is facing downside risks from the increasing severity
and frequency of unfavourable weather events.

The growth outlook, however, remains subject to downside risks, which include:
           a) continued slow execution of public investments could moderate the expected support
                  from Government investment and the multiplier effect on growth;
           b) political and policy uncertainty which are very elevated in several major economies with
                  global growth continuing to be biased downwards. Already, odds for a global recession
                  are very high. Heightened uncertainty and declining international trade that have

19 | P a g e
You can also read