EPIC Economic Performance Indicators for Cape Town - 2018: Quarter 1 (January - March) - Invest Cape Town
←
→
Page content transcription
If your browser does not render page correctly, please read the page content below
EPIC
Economic Performance Indicators for Cape Town

2018: Quarter 1 (January - March)
Introduction
This is the 20th edition of the EPIC publication, which presents and analyses economic (and
related) trends in Cape Town on a quarterly basis. This edition focuses on the first quarter of
2018, covering the period 1 January to 31 March 2018.

Rationale for a quarterly economic publication
Accurate and up-to-date economic information is critical in providing direction for
economic development and related strategies. It is essential to understand the nature,
composition and performance of the local economy to monitor its status and know what
must be done. While there is a wealth of economic statistics and information available for
Cape Town, it often exists in discrete, isolated parcels customised to serving a specific
purpose at a given time. Furthermore, in most cases, relevant economic information is only
presented on an annual basis. This period is sometimes simply too long to inform immediate
policy decisions or to get a proper grasp of the dynamic nature of economic trends. These
factors underpin the need for a consolidated, quarterly economic performance publication
for the City of Cape Town.

Acknowledgements
The EPIC quarterly publication is a product of the Organisational Policy and Planning
Department of the City of Cape Town. The publication is authored, consolidated and edited
by the Economic Research Unit within the City’s Research Branch, Department of
Organisational Policy and Planning.

Produced by the Economic Research Unit

Manager: Research                            Head: Economic Research
Carol Wright                                 Paul Court

Editor-in-chief                              Project managers and authors
Meagan Jooste                                Dilshaad Gallie
                                             Monique Petersen
Authors
Layarn Booley
Namhla Malgas
Nicole Londt

Email: economic.research@capetown.gov.za

Additional sources of information:
City of Cape Town, Transport Development Authority: Suzelle Williams, Marius Crous and
Lizanne Ryneveldt
City of Cape Town, Water & Sanitation: Cheryl Kessler
Cape Town Tourism: Roxanne Lombard and Nolubabalo Manona
Wesgro: Latecia Philips

                                                                                              i
Contents
Introduction ................................................................................................................................................... i
Acknowledgements .................................................................................................................................... i
1. Economic Growth .............................................................................................................................. 3
a. Quarter-on-quarter GDP-R growth rate .................................................................................... 3
b. Sectoral drivers of economic growth in the Western Cape ................................................. 3
2. Inflation ................................................................................................................................................ 5
a. Inflation overview........................................................................................................................... 5
b. Geographical inflation ................................................................................................................. 6
3. Labour Market .................................................................................................................................... 7
a. Cape Town’s labour market performance .............................................................................. 7
b. Employment comparison of metros ........................................................................................... 7
c. Unemployment in Cape Town .................................................................................................... 8
d. Sector employment trends for Cape Town .............................................................................. 9
4. Infrastructure ..................................................................................................................................... 10
a. Container handling ..................................................................................................................... 10
b. Airport statistics ............................................................................................................................. 11
c. Water.............................................................................................................................................. 12
5. Tourism ................................................................................................................................................ 13
6. Additional Indicators ....................................................................................................................... 14
a. Building developments ............................................................................................................... 15
b. Commercial property developments...................................................................................... 15
c. New vehicle sales ........................................................................................................................ 17
Reference List ............................................................................................................................................ 18
Abbreviations ............................................................................................................................................ 19
List of tables
Table 1: Official (strict) versus expanded (broad) unemployment rates ........................................ 9
Table 2: Income derived from tourist accommodation, Quarter 1, 2017 versus Quarter 1, 2018
..................................................................................................................................................................... 13
List of figures
Figure 1: Real GGP growth for the Western Cape, Quarter 1, 2008 to Quarter 1, 2018 ............... 3
Figure 2: Sectoral real GDP-R growth rates in the Western Cape, Quarter 1, 2018 ...................... 4
Figure 3: CPI and PPI trends for South Africa, January 2013 to March 2018 ................................... 5
Figure 4: CPI inflation rate at a provincial level, January to March 2018 ....................................... 6
Figure 5: Employment comparison with other metros, Quarter 4, 2017 versus Quarter 1, 2018 . 8
Figure 6: Quarterly and annual change in employment per sector for Cape Town, Quarter 1,
2018 ............................................................................................................................................................... 9
Figure 7: Total containers handled (TEUs), January 2014 to March 2018 ...................................... 10
Figure 8: Total passenger movements at South Africa’s major airports, January 2014 to March
2018 ............................................................................................................................................................. 11
Figure 9: Daily average water production (7 day average) ........................................................... 12
Figure 10: Potable water consumption by use category (2017)..................................................... 13
Figure 11: Total visits to the top 5 tourist destinations of Cape Town, Quarter 1, 2013 to Quarter
1, 2018 ......................................................................................................................................................... 14
Figure 12: Building plans submitted to the CCT, 2012-2018 .............................................................. 15
Figure 13: Office/banking space sector developments, January 2016 to March 2018 ............. 16
iiCAPE TOWN OVERVIEW – 2018 Q1
Cape Town gross geographic product &
employment contributions to SA, 2017e
100%
42.3%
75% 48.0%
2.0%
50% 1.7% 10.0%
7.7%
13.1% 15.3%
25%
7.5% 7.0%
8.3% 9.7%
Of South Africa’s R3 139 890 million gross
domestic product (GDP) generated in the first 9.6% 9.6%
quarter of 2018, the Western Cape accounted 0%
for R433 713 million. Whilst GDP data is not Employment GDP
available at the city-level on a quarterly basis, (formal + informal) (current prices)
annually, Cape Town typically contributes Cape Town eThekwini Ekurhuleni
a
around 72% of the provincial GDP. Johannesburg Nelson Mandela Bay Tshwane
Mangaung Buffalo City Rest of SA
During the first quarter of 2018, the Western
Cape had a quarter-on-quarter GDP growth rate Cape Town gross value added (GVA) versus
of -2,8%, compared to a national growth rate of national GVA, 2017f
b
-2,2%.
Agriculture 2.6%
1.0% SA GVA
In 2017, South Africa had a GDP per capita, of Mining 8.0% Cape Town GVA
R88 262, while the Western Cape’s GDP per 0.2%
13.2%
capita was R97 983 and Cape Town’s was Manufacturing 14.4%
c
R106 839. Electricity 3.7%
2.1%
Construction 3.9%
4.7%
Trade 15.0%
3,8% 4,4% 17.9%
Transport 9.9%
11.9%
Finance 20.2%
29.7%
Community services 23.5%
At the end of the first quarter of 2018, South 18.2%
Africa had a lower rate of inflation of 3,8%, than 0% 10% 20% 30% 40%
d
the Western Cape which had a rate of 4,4%.
South Africa has 56 521 948
people: 6 510 312 (11,4%) live in
the Western Cape and, of those,
4 174 510 are resident in Cape In the first quarter of 2018, tourists and residents made 7 406 900
i
Town.
g visits to Cape Town’s five major attractions.
In 2017 South Africa had a Gini Of the 9 251 329 passenger movements
coefficient of 0,63, while Cape through South Africa’s three international
j
Town had a slightly lower value airports during the first quarter of 2018,
of 0,61.
h 2 816 009 were through Cape Town
k
International Airport.
a,b. At constant 2010 prices. Source: Quantec, 2018. h. Source: IHS Markit, 2018.
c,f. At current prices. Source: IHS Markit, 2018. i. Source: Cape Town Tourism and Wesgro, 2018.
d, g. Source: Statistics South Africa (StatsSA), 2018. j. Cape Town, OR Tambo and King Shaka.
e. GGP at current prices. Source: IHS Markit, 2018. k. Source: ACSA, 2018.
1
EPIC Economic Performance Indicators for Cape Town 2018 Quarter 1LABOUR OVERVIEW – 2018 Q1
The Working-Age working-age population The Strictly Unemployed
Population is all persons includes only people
who are actively
aged 15-64 years old. labour force seeking work (i.e.
‘searching
The Labour Force comprises
employed unemployed’).
all persons who are
employed plus The Broadly
searching
unemployed. Unemployed includes
unemployed the ‘searching
non-searching unemployed’ as well as
unemployed ‘discouraged’ and
The Employed are those ‘other non-searching’
who, during a reference job seekers.
week, did any work for at
least 1 hour or had a job or A ‘discouraged job seeker’ is a person who was not employed during the
business (even if reference period, was available, but did not take active steps to find work
temporarily absent). during the last 4 weeks.
Cape Town South Africa
Recorded Q-on-Q Y-on-Y Recorded Q-on-Q Y-on-Y
Working-age population 2 884 14 56 37 678 153 617
Labour Force 2 049 41 85 22 358 307 -68
Employed: total 1 589 18 78 16 378 206 165
(thousands, ‘000’s)
Employed: Formal sector 1 287 1 70 11 355 111 18
Number
Employed: Informal sector 189 19 6 2 901 93 220
Unemployed 459 23 7 5 980 100 -234
Not economically active 836 -27 -30 15 320 -154 686
Discouraged work-seekers 14 -3 3 2 787 249 510
Other 821 -24 -32 12 533 -403 176
Official/strict unemployment 22,4 0,7 -0,6 26,7 – 0,0 -1,0
(percentage, %)
Broad/expanded
Unemployment
23,8 0,3 -1,3 36,7 0,4 0,3
Rate
Absorption 55,1 0,4 1,7 43,5 0,4 -0,2
Labour Force Participation 71,0 1,1 1,6 59,3 0,5 -1,2
increase decrease improvement deterioration – No change (due to rounding)
Source: Statistics South Africa, Quarterly Labour Force Survey, 2018 Quarter 1, May 2018.
Note:
- A ‘quarter-on-quarter’ comparison is between the current quarter and the previous quarter (for example: Quarter 1, 2018 versus Quarter 4, 2017).
- A ‘year-on-year’ comparison is between the same quarters in two consecutive years (for example: Quarter 1, 2018 versus Quarter 1, 2017).
2
EPIC Economic Performance Indicators for Cape Town 2018 Quarter 11. Economic Growth
a. Quarter-on-quarter GDP-R growth rate
The Western Cape economy contributes around 14% of national gross domestic product
(GDP) (IHS Markit, 2018). The province’s economic performance is strongly influenced by
national economic conditions and, in line with the downward path of national quarter-on-
quarter growth in the first quarter, growth in the Western Cape economy decreased by 6,1
percentage points from the previous quarter 1 to -2,8% in the first quarter of 2018. As with
growth at a national level, the weak economic performance in the first quarter was driven by
the agricultural sector 2 which contracted by -41,5% quarter-on-quarter. The agricultural
sector’s substantial contraction can be attributed to the impact that the drought has had on
agricultural production in the province (BER, 2018a), with (major) dams’ reaching particularly
low storage levels in the first quarter of 2018 (City of Cape Town [CCT], 2018a). As figure 1
shows, on a year-on-year basis, the province’s economy grew by 1,3%, although this
represented a decline from the previous quarter’s year-on-year growth rate of 1,6%.
While GDP-R statistics for Cape Town are not available on a quarterly basis, the performance
of the metropolitan municipality’s economy can be expected to typically mirror that of the
provincial economy. This is because the city contributes around 70% of the provincial
economic output (IHS Markit, 2018). On average, in the last 10 years, the variation of the
city’s GGP growth rate from the provincial rate has been 0,2 percentage points. If this were
to hold true for the first quarter of 2018, a plausible range for Cape Town’s quarter-on-quarter
economic growth is between -3,0% and -2,6%.
Figure 1: Real GGP growth for the Western Cape, Quarter 1, 2008 to Quarter 1, 2018
Quarter-on-quarter Year-on-year percentage
6
4
2
0
2008q1
2008q2
2008q3
2008q4
2009q1
2009q2
2009q3
2009q4
2010q1
2010q2
2010q3
2010q4
2011q1
2011q2
2011q3
2011q4
2012q1
2012q2
2012q3
2012q4
2013q1
2013q2
2013q3
2013q4
2014q1
2014q2
2014q3
2014q4
2015q1
2015q2
2015q3
2015q4
2016q1
2016q2
2016q3
2016q4
2017q1
2017q2
2017q3
2017q4
2018q1
-2
-4
-6
Source: Quantec, June 2018.
b. Sectoral drivers of economic growth in the Western Cape
The Western Cape economy’s weak performance in the first quarter of 2018 is reflected
across most of its sectors. The most prominent contributors to the Western Cape’s total gross
value added (GVA) in the first quarter of 2018 were the finance (30,9%), trade (16,0%) and
manufacturing (14,9%) sectors (Quantec, 2018). Of these, only the finance sector contributed
1 Quarterly GDP growth for the fourth quarter of 2017 has been revised from 3,9% to 3,3% (Quantec,
2018).
2 Quarterly GDP growth for the agricultural sector for the fourth quarter of 2017 has been revised from
32,7% to 13,1% (Quantec, 2018).
3
EPIC Economic Performance Indicators for Cape Town 2018 Quarter 1positively to the province’s quarterly economic growth rate, contributing 0,32 of a
percentage point. The agricultural sector, despite constituting a relatively small share of the
Western Cape’s total GVA (3,9%), was the largest negative contributor to growth in the first
quarter, reducing growth by 2,18 percentage points alone. The next largest reduction in
economic growth came from the manufacturing sector which reduced growth by -0,99 of a
percentage point.
As noted above, in terms of the quarter-on-quarter growth (figure 2), the agricultural sector
contracted significantly, following its recovery throughout 2017. Although the mining and
quarrying sector observed the second highest contraction in the Western Cape (-11,2%), it
only comprises 0,3% of the province’s GDP-R. The manufacturing sector, which contributes
14,9% to the Western Cape’s GDP-R, recorded the third largest negative growth rate of -6,5%
in the first quarter of 2018 - a decline of 10,7 percentage points from the previous quarter. The
trade sector also contracted with -2,9% quarter-on-quarter growth; this is partly attributed to
its inability to replicate boosted sales activity experienced in the previous quarter related to
‘Black Friday’ promotions (BER, 2018b). General government services recorded the highest
quarter-on-quarter growth amongst the sectors with 1,7%. Whilst the finance and business
services grew by 1,0% quarter-on-quarter in the first quarter of 2018, it declined by 1,44
percentage points compared to the previous quarter. These trends in the Western Cape are
however in line with national trends for the first quarter of 2018.
Figure 2: Sectoral real GDP-R growth rates in the Western Cape, Quarter 1, 2018
quarter-on-quarter % change percentage
Agriculture, forestry and fishing
-41.5
Mining and quarrying -11.2
Manufacturing -6.5
Electricity and water -0.1
Construction -1.9
Wholesale & retail trade; hotels & restaurants -2.9
Transport and communication 0.9
Finance, real estate and business services 1.0
Community, social and other personal services 1.2
General government services 1.7
-45 -40 -35 -30 -25 -20 -15 -10 -5 0 5
Source: Quantec, June 2018.
Similar sectoral growth rates can be expected for Cape Town, as the city is the major
contributor to most economic sectors in the province. In particular, it comprises 82% of the
Western Cape’s finance and business services, 77% of its transport, 72% of its wholesale and
retail trade, 69% of its manufacturing, and 62% of its construction sectors (IHS Markit, 2018). As
such, the city is likely to have experienced very similar growth rates to those at a provincial
level in these sectors in the first quarter of 2018.
In contrast to Cape Town’s contribution to the tertiary sector output of the province, its
contribution to the province’s total primary sector GGP is only 20% (IHS Markit, 2018). Thus, it is
difficult to make inferences about the performance of the city’s primary sector based on
primary sector GGP growth in the Western Cape. However, even if Cape Town’s primary
sector (agriculture, in particular) did mirror provincial trends, it is unlikely that this would have
4
EPIC Economic Performance Indicators for Cape Town 2018 Quarter 1had a large impact on the overall growth rate of the city, as the primary sector contributes
only 1% to Cape Town’s total GGP. Rather, the performance of the city’s economy in the first
quarter of 2018 would have been driven by that of the finance, trade, manufacturing and
transport sectors that comprise 30%, 18%, 14% and 12% of the city’s economy, respectively.
2. Inflation
Price fluctuations of goods and services in an economy are measured by the consumer price
index (CPI) inflation rate and producer price index (PPI) inflation rate. The CPI measures the
change in the cost of living for households and the PPI measures the change in the cost of
production.
a. Inflation overview
In the first quarter of 2018, the CPI saw a decline in comparison to the fourth quarter of 2017.
As illustrated in figure 3, the CPI recording for January was 4,4%, decreasing to 4,0% in
February and further to 3,8% in March 2018. The March recording marks the lowest inflation
rate over the preceding five-year period. According to the Monetary Policy Committee
(MPC) statement of March 2018 (South African Reserve Bank [SARB], 2018), increased
international competition and slower growth in relation to output costs resulted in an
improved exchange rate overriding the value added tax (VAT) increase of 15% that was
implemented in April 2018 and consequently leading to a lower CPI in the first quarter.
Similar to the movement of CPI, the PPI declined when compared to the end of the fourth
quarter of 2017. Since reaching 5,2% in December 2017, the PPI decreased significantly
throughout the first quarter of 2018 recording a rate of 5,1% in January, decreasing to 4,2% in
February and further to 3,7% in March. The main inflationary contributors to the PPI
throughout the first quarter of 2018 (in terms of final manufactured products) were the prices
of coke, petroleum, chemical, rubber and plastic products, transport equipment, as well as
paper and printed products. Encouragingly, both the CPI and PPI inflation rates were lower in
the first quarter of 2018, as compared to the same period of 2017. The two rates also
remained well within the inflation target range of 3-6% over the last 12 months (April 2017-
March 2018).
Figure 3: CPI and PPI trends for South Africa, January 2013 to March 2018
Repo Rate CPI PPI Reserve Bank inflation target range Percentage
10
9
8
7
6
5
4
3
2
1
0
Q1 Q2 Q3 Q4 Q1 Q2 Q3 Q4 Q1 Q2 Q3 Q4 Q1 Q2 Q3 Q4 Q1 Q2 Q3 Q4 Q1
2013 2014 2015 2016 2017 2018
Source: CPI and PPI extracted from Statistics South Africa, 2018, and repurchase rate extracted from
SARB, 2018.
5
EPIC Economic Performance Indicators for Cape Town 2018 Quarter 1Figure 3 illustrates changes in the repurchase rate (repo rate). As indicated in the graph, the
repo rate was reduced in March 2018. According to the MPC statement of the same month,
the decision to reduce the repo rate by 25 basis points to 6,50% was informed by inflation
remaining below the 6% inflation target range and an improved inflation outlook. The MPC
plans to continuously monitor inflation expectations as a result of the 1% VAT increase that
took place in April 2018. Furthermore, monitoring global monetary developments and credit
ratings would be the MPC’s first priority in future decision-making processes (SARB, 2018).
b. Geographical inflation
The Western Cape recorded a lower inflation rate of 4,4% at the end of the first quarter, in
March 2018, in comparison to the end of fourth quarter of 2017. Although remaining within
the inflation target range at the end of the quarter, the provincial inflation rate remained
higher than the national rate (3,7%). Figure 4 illustrates inflation rates recorded in the first
quarter of 2018 across all nine provinces in the country. In comparison to the end of the
fourth quarter of 2017, most provinces recorded a decline in inflation rates by the end of the
first quarter of 2018. The Western Cape recorded the highest inflation rate throughout the first
quarter, followed by Gauteng and the Eastern Cape, whilst the North West recorded the
lowest inflation rate.
Figure 4: CPI inflation rate at a provincial level, January to March 2018
January 2018 February 2018 Percentage
March 2018 Reserve Bank inflation target range
7%
6%
5%
4%
3%
2%
1%
0%
Western Cape
Mpumalanga
Gauteng
KwaZulu-Natal
Northern Cape
North West
Limpopo
Eastern Cape
Free State
Source: Statistics South Africa, May 2018.
Food price inflation in the Western Cape was 4,9% in March 2018 (decreasing from 5,3% in
February 2018), whilst nationally it was 2,8% in March 2018 (decreasing from 3,3% in February
2018). The specific food products which drove higher food inflation in the Western Cape in
March 2018 were milk, eggs and cheese, vegetables as well as sugar, sweets and desserts
(Statistics South Africa, 2018). The continued drought in the Western Cape has adversely
affected agricultural production but has not yet resulted in a direct impact on food prices in
the province, according to the MPC statement of March 2018 (SARB, 2018). Water and other
6
EPIC Economic Performance Indicators for Cape Town 2018 Quarter 1services’ 3 price inflation in the Western Cape was 8,5% in March 2018 (decreasing from 8,8%
in February 2018), higher than the 6,8% at a national level; potentially indicative of the
inflationary impact of water tariff increases in the first quarter (CCT, 2018b). Water tariff
increases were implemented in Cape Town as a demand-side management mechanism
(CCT, 2018e). Private transport fuel price inflation in the Western Cape was 2,9% in March
2018 (decreasing from 5,3% in February 2018). This was on par with private transport fuel price
inflation at the national scale which was also 2,9% (decreasing from 5,1% in February 2018)
and underpinned by a domestic petrol price decrease of R1 within this quarter (Automobile
Association of South Africa, 2018). Electricity and other fuels price inflation reached 3,1% in
the Western Cape and 2,1% nationally in March 2018.
3. Labour Market
The labour market is the point at which economic production meets human development.
As such employment creation and unemployment reduction are top priorities for all spheres
of government. Labour market performance is tracked through a variety of indicators, many
of which are reflected on in this section.
a. Cape Town’s labour market performance
In the first quarter of 2018, Cape Town’s working age population (2,88 million) and labour
force (2 million) increased on both a quarter-on-quarter and year-on-year basis. Similarly,
employment (1,58 million) increased by 18 000 individuals on a quarter-on-quarter
comparison and by 78 000 individuals year-on-year. This is the sixth consecutive quarter of
positive employment growth. Formal and informal sector employment increased on both a
quarterly and a year-on-year basis to a total of 1,28 million and 189 000 individuals,
respectively. The increases in employment led to a slight increase in the labour absorption
rate to 55,1% compared to 54,7% in the fourth quarter of 2017. Similarly, the increase in the
labour force led to an increase of 1,1 percentage points in the labour force participation
rate (71%) compared to the previous quarter (69,9%).
b. Employment comparison of metros
To measure Cape Town’s job creation performance, a comparison with other metropolitan
municipalities (metros) in the country is helpful. In the first quarter of 2018, Cape Town had
the second largest number of people employed in the country, with 1,58 million people
employed in the city, second only to Johannesburg where 2 million people were employed.
This is to be expected as Johannesburg has a significantly larger population.
Turning attention to employment trends in the first quarter of 2018, Johannesburg, eThekwini
and Cape Town experienced positive growth on both a quarterly and year-on-year level.
Nelson Mandela Bay and Ekurhuleni experienced increased employment when compared
to the previous quarter, however decreased employment when compared to first quarter of
2017. Johannesburg experienced the highest quarter-on-quarter increase in employment (90
546), followed by eThekwini (38 514); whilst Tshwane was the only metro to experience
negative growth on both a quarter-on-quarter (-21 892) and year-on-year (-69 014) basis and
also shed jobs at the fastest rate (-5,4%), quarter-on-quarter. In contrast, employment grew
the fastest in Cape Town (5,12%) when compared to the first quarter of 2017.
3 As defined by Statistics South Africa, this category includes water supply, rates, taxes and levies
(Statistics South Africa, 2017).
7
EPIC Economic Performance Indicators for Cape Town 2018 Quarter 1Figure 5: Employment comparison with other metros, Quarter 4, 2017 versus Quarter 1, 2018
2017:Q4 2018:Q1 Employment
(millions)
2.0
1.5
1.0
0.5
0.0
Cape Town Tshwane Nelson Mandela Johannesburg Ekurhuleni eThekwini
Bay
Source: Statistics South Africa, Quarter Labour Force Survey, 2018 Quarter 1, May 2018.
c. Unemployment in Cape Town
Cape Town experienced an increase in the number of unemployed people on both a
quarter-on-quarter and year-on-year basis by 22 971 and 7 124 individuals, respectively. This
resulted in the strict unemployment rate increasing by 0,7 of a percentage point, on a
quarter-on-quarter basis, to 22,4%. The youth unemployment rate in Cape Town, defined as
the strict unemployment rate for individuals aged 15 to 24, was estimated at 45,5% in the first
quarter of 2018, having decreased from 47,4% in the previous quarter, and having
decreased significantly from 49,8% in the first quarter of 2017. While this is below the national
rate of 52,4%, it is nonetheless markedly high by developing-country standards and poses a
key challenge to economic policymakers in the city.
Whilst traditional comparisons of Cape Town’s unemployment trends with that of South Africa
as a whole are important, it is perhaps more revealing to compare these trends to other
metros that have similar labour market dynamics (see table 1). EThekwini, Ekurhuleni and
Nelson Mandela Bay were the only metros to experience decreases in both strict and
expanded unemployment rates in the first quarter of 2018. Cape Town was the only metro to
experience an increase in both the strict and expanded unemployment rates. Nelson
Mandela Bay had the highest strict unemployment and expanded unemployment rates
(36,3% and 36,4%, respectively), while eThekwini had the lowest strict unemployment rate
(20,3%) and Cape Town the lowest expanded unemployment rate (23,8%). Notably, table 1
indicates the large differences in the relationship between strict and expanded
unemployment rates in each of the six metros, with Nelson Mandela Bay recording a 0,1
percentage points difference between the two rates of unemployment, whereas Tshwane
recorded a 7,6 percentage points difference. Cape Town continues to record relatively low
differences between the two rates of unemployment, remaining below 2 percentage points
for the past four quarters, attributable to the city having the second smallest number of
discouraged work-seekers in the metro (after Nelson Mandela Bay metro).
8
EPIC Economic Performance Indicators for Cape Town 2018 Quarter 1Table 1: Official (strict) versus expanded (broad) unemployment rates
Official (strict) Expanded (broad)
Metro 2018: Q1 2017: Q4 2017: Q1 2018: Q1 2017: Q4 2017: Q1
Cape Town 22,4 21,7 23,0 23,8 23,5 25,1
eThekwini 20,3 21,9 21,8 27,4 28,1 28,7
Ekurhuleni 30,9 33,6 30,8 34,9 36,7 34,0
Johannesburg 28,8 28,2 28,3 31,4 32,3 30,2
Nelson Mandela Bay 36,3 36,9 30,2 36,4 37,0 30,4
Tshwane 26,0 26,9 28,3 33,5 32,0 30,1
Source: Statistics South Africa, Quarterly Labour Force Survey, 2018 Quarter 1, May 2018.
d. Sector employment trends for Cape Town
Figure 6 presents the change in the level of employment by sector within Cape Town in the
first quarter of 2018. Overall, six sectors made a positive contribution to employment when
compared to the previous quarter, specifically, manufacturing (21 500), trade, hotels and
restaurants (14 673) as well as private households (6 374). Community, social and other
personal services as well as construction were more modest contributors to employment. The
key job-shedding sectors in Cape Town in the first quarter, as compared to the previous
quarter, were transport and communication (-11 655), finance, real estate and business
service (-9 853) as well as agriculture, forestry and fishing (-7 488). Further, quarterly
employment losses were experienced within the electricity and water, as well as mining and
quarrying sectors.
Figure 6: Quarterly and annual change in employment per sector for Cape Town, Quarter 1, 2018
Quarterly change Annual change
Agriculture, forestry and fishing
Mining and quarrying
Manufacturing
Electricity and water
Construction
Trade, hotels and restaurants
Transport and communication
Finance, real estate and business services
Community, social and other personal services
Private households
Other
-20 000 -10 000 0 10 000 20 000 30 000 40 000 50 000
Source: Statistics South Africa, Quarterly Labour Force Survey, 2018 Q1, May 2018.
On a year-on-year basis seven sectors added to employment growth whereas four sectors
recorded employment losses when compared to the first quarter of 2017. Encouragingly,
trade, hotels and restaurants continued its positive performance by adding the most to
employment growth (38 384). In contrast to its negative quarter-on-quarter performance,
finance, real estate and business services added to employment on a year-on-year basis
(34 329). The sectors which mirrored their poor quarterly performance with poor year-on-year
performances included transport and communication (-7 756), electricity and water (-2 424)
9
EPIC Economic Performance Indicators for Cape Town 2018 Quarter 1as well as mining and quarry (-957). In contrast to its positive performance on a quarterly
level, private households observed negative employment year-on-year change (- 2 191).
4. Infrastructure
Cape Town is often promoted as the gateway to South Africa, and to Africa more generally.
This status is sustained by the city’s well-developed transportation infrastructure, with Cape
Town being home to South Africa’s second-busiest airport as well as (historically) its’ second-
busiest container port. This section reviews infrastructure developments in relation to Cape
Town’s port and airport, as well as in terms of water production and consumption, in light of
the drought the Western Cape is facing.
a. Container handling
Container traffic is very seasonal, as figure 7 indicates, thus it is best to compare total
containers handled over the period of a year. The number of containers handled at the Port
of Cape Town increased from 239 936 in the first quarter of 2017 to 250 874 in the first quarter
of 2018 – a 4,56% increase, which follows three consecutive quarters of negative growth on a
year-on-year comparison. In the first quarter of 2018, the Port of Durban 4 was the largest
container handling port in the country (comprising 59% of all containers handled in South
Africa), followed by the Port of Cape Town (20%) and the Port of Ngqura 5 (16%). The Port of
Cape Town regained its position as the second-largest container handling port in the country
following two consecutive quarters of being out-performed by the Port of Ngqura. Capacity
constraints experienced at the Port of Cape Town may again impact on this positioning.
However, Transnet has approved plans for a multibillion-rand upgrade to Cape Town’s
container-handling facilities, which should alleviate congestion problems in the medium-
term.
Figure 7: Total containers handled (TEUs) 6, January 2014 to March 2018
South Africa Cape Town Ngqura Durban TEUs
500 000
400 000
300 000
200 000
100 000
0
Q1 Q2 Q3 Q4 Q1 Q2 Q3 Q4 Q1 Q2 Q3 Q4 Q1 Q2 Q3 Q4 Q1
2014 2015 2016 2017 2018
Source: Transnet National Ports Authority, May 2018.
4 The Port of Durban is located in eThekwini metropolitan municipality.
5 The Port of Ngqura is located in Nelson Mandela Bay metropolitan municipality.
6 A TEU (20-foot equivalent units) is an inexact unit of cargo capacity, based on the volume of a 20-foot
long (6,1m) container. There is a lack of standardisation with regard to height, ranging between 4 feet 3
inches (1,30m) and 9 feet 6 inches (2,90m), with the most common height being 8 feet 6 inches (2,59m).
The 40-foot (12,2m) or 45-foot (13,7m) containers – the sizes most frequently used – are both defined as
two TEU.
10
EPIC Economic Performance Indicators for Cape Town 2018 Quarter 1Despite the downturn it observed in the fourth quarter of 2017 7, the Port of Durban
maintained its top position amongst the key container handling ports in South Africa
(handling 745 037 TEUs in the first quarter) and recorded an increase in container handling by
70 026 (10%) in the first quarter of 2018, compared to the same period in 2017. Increased
container handling by the aforementioned three ports contributed towards total container
handling, at a national scale, increasing by 13% year-on-year in the first quarter of 2018.
b. Airport statistics
Cape Town International Airport is South Africa’s second-busiest airport, after OR Tambo
International Airport in Johannesburg. It recorded 2,82 million total passenger movements in
the first quarter of 2018 compared to 5,06 million passenger movements at OR Tambo
International and 1,38 million at King Shaka International airports during the same period.
Total passenger movements at Cape Town International in the first quarter of 2018 was 2,15%
higher compared to the first quarter of 2017, when 2,76 million passenger movements were
recorded. Following its slowing growth trend in the fourth quarter of 2017, OR Tambo
International observed a lower year-on-year growth rate (1,03%) in passenger movements.
Contrastingly, King Shaka International Airport saw a year-on-year increase of 7,5% in
passenger arrivals. However, after surpassing the 500 000 monthly passenger movement mark
in December 2017, the airport reverted to below this mark throughout the first quarter of
2018.
Figure 8: Total passenger movements at South Africa’s major airports, January 2014 to March 2018
OR Tambo International Cape Town International Number of
passengers
King Shaka International
2 000 000
1 500 000
1 000 000
500 000
0
Q1 Q2 Q3 Q4 Q1 Q2 Q3 Q4 Q1 Q2 Q3 Q4 Q1 Q2 Q3 Q4 Q1
2014 2015 2016 2017 2018
Source: ACSA, May 2018.
Figure 8 indicates the pronounced degree of seasonality in Cape Town’s air passenger
movements, with these consistently declining in the second quarter when the city enters its
winter months and picking up again in the fourth quarter with the onset of summer. In the first
quarter of 2018, Cape Town International’s total passenger arrivals decreased by 6,35% when
compared to the fourth quarter of 2017. However, on a year-on-year basis (which controls for
seasonal effects) total passenger arrivals at Cape Town International increased by 2,55%,
while international arrivals increased by 9,94%. The relatively slow year-on-year growth of
7As a result of a storm in the KwaZulu-Natal region in October 2017 which resulted in the closure of the
port for several weeks.
11
EPIC Economic Performance Indicators for Cape Town 2018 Quarter 1passenger arrivals could, in part, be reflective of the negative perception-related impact
that the water crisis has had on the number of tourists visiting Cape Town, especially over the
latter part of the first quarter.
c. Water
Cape Town is experiencing its worst drought in recorded history with dam levels in the
Western Cape remaining low relative to previous years. The City of Cape Town (CCT/City) is
pursuing a range of augmentation options for alternative water supply, including seawater
desalination, wastewater reuse and groundwater extraction.
The City has implemented water restrictions and tariff changes to induce a reduction in
water demand in line with a total water supply target of a maximum of 450 million litres (Ml)
per day. On a quarter-on-quarter basis, water production declined by 11% in the first quarter
of 2018, relative to the fourth quarter of 2017. However, as figure 9 shows, while water
production 8 in the city has declined in the last year, relative to its historical trend, it is still
above the 450 Ml per day target.
Figure 9: Daily average water production (7 day average)
Target (Megalitres/day) Average Production (Megalitres/day) Production (Ml/day)
1 400
1 200
1 000
800
600
400
200
0
01-May-16
01-May-17
01-May-14
01-May-15
01-Mar-17
01-Jul-17
01-Sep-17
01-Mar-18
01-Nov-17
01-Mar-14
01-Mar-15
01-Sep-15
01-Mar-16
01-Jul-14
01-Sep-14
01-Nov-14
01-Jul-15
01-Nov-15
01-Jul-16
01-Sep-16
01-Nov-16
01-Jan-17
01-Jan-18
01-Jan-14
01-Jan-15
01-Jan-16
Source: City of Cape Town: Department of Water & Sanitation, 2018.
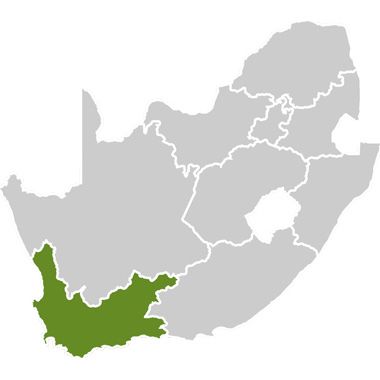
Drinking water consumption 9 in 2017, as illustrated in figure 10, was largely dominated by
domestic 10 and commercial (Retail and Office spaces) categories, which respectively
accounted for approximately 68,9% and 13,5% of total water consumption. This was followed
by Other customer types (6%), City-owned facilities and City Departments (5,5%), Industry
(4,2%) and Government (1,9%).
8 Readers are cautioned not to interpret this water production indicator as synonymous with water
consumption in Cape Town, as it includes losses (for example, due to leaks), as well as treated water
provided to external customers like neighbouring municipalities.
9 Water consumption data is only updated on an annual basis.
10 Which comprises the following categories: Houses (53,7%), Flats and complexes (9,2%), Informal
Settlements (4%) and Domestic other (2%).
12
EPIC Economic Performance Indicators for Cape Town 2018 Quarter 1Figure 10: Potable water 11 consumption by use category (2017)
2.0% 1.9% Houses
4.0%
4.2% Retail & Offices
5.5%
Flats & complexes
6.0% Other
City-owned facilities and CCT Departments
53.7%
9.2% Industry
Informal settlements
13.5% Domestic other
Government
Source: City of Cape Town: Department of Water & Sanitation, 2018.
5. Tourism
Cape Town is a well-known tourist destination, both locally and internationally, and the
tourism sector is a valuable contributor to the city’s economy. The occupancy and revenue
figures presented in table 2 are derived from a monthly survey of an average of 91 tourism
accommodation establishments in the Cape Town metropolitan area (Cape Town Tourism,
2018a). Occupancy rates at city accommodation establishments decreased by an average
of 5,9 percentage points in the first quarter of 2018 compared to the same period in 2017.
The month of February recorded the highest occupancy rate (81,1%) in the first quarter of
2018, but recorded a year-on-year decrease of 5,1 percentage points when compared to
February 2017. The average room rate marginally increased year-on-year in the first quarter
of 2018 by R17, although it was lower in February and March than it had been in these
months in the previous year. Contrastingly, the revenue per room decreased by R120 when
compared to the first quarter of 2017, predominantly driven by poorer year-on-year
performance in March.
Table 2: Income derived from tourist accommodation, Quarter 1, 2017 versus Quarter 1, 2018
January February March First-quarter average
Indicator 2018 2017 2018 2017 2018 2017 2018 2017
Occupancy
72,3% 77,4% 81,1% 86,2% 72,9% 80,4% 75,4% 81,3%
rate
Average
R 2 340 R 2 172 R 2 364 R 2 389 R 2 040 R 2 132 R2 248 R2 231
room rate
Revenue per
R 1 693 R 1 682 R 1 918 R 2 060 R 1 486 R 1 714 R1 699 R1 819
room
Source: Derived from Cape Town Tourism data, Selected Accommodation Establishments, May 2018.
Overall, tourist accommodation in Cape Town, on average, continues to perform weaker
than the corresponding period last year. This may be reflective of the possible negative
impact that water shortages are having on the demand for tourist accommodation in Cape
Town, particularly from the domestic market. It is however also an outcome of the increased
11 Water that is of a safe drinking standard.
13
EPIC Economic Performance Indicators for Cape Town 2018 Quarter 1supply of tourism beds in the city in 2017, placing further downward pressure on hotel
occupancy rates. In terms of an occupancy breakdown by type of accommodation
establishment, the highest occupancy rate in the first quarter of 2018 was achieved by
Backpacker accommodation (81,1%).
On a year-on-year basis only two of the five major Cape Town tourist attractions 12 recorded
increases in the number of visits in the first quarter of 2018. Table Mountain Aerial Cableway
observed the largest increase of 18 783 visitors (5,6% growth), followed by Boulders Beach,
with an increase of 4 417 visitors (1,6%). Decreases in visitor numbers were observed for
Robben Island (-18,1%), Kirstenbosch National Botanical Gardens (-5,5%) and the Table
Mountain Park: Cape of Good Hope (-5,0%).
Figure 11 illustrates that Cape Town’s attractions are subject to strong seasonality, with peak
visitor activity occurring in the summer period from November to March. The lowest tourist
visitor numbers are seen during the period May to July, which are Cape Town’s winter
months. Despite the positive performance of some of Cape Town’s top attractions, total visits
to the five major attractions declined by 2,2% in the first quarter of 2018 compared to the
same period in 2017. This provides further evidence of the degree to which the tourism
industry struggled in the first quarter of 2018, as water supply and related concerns intensified.
Figure 11: Total visits to the top 5 tourist destinations of Cape Town, Quarter 1, 2013 to Quarter 1, 2018
Cape Point Boulders Cableway Kirstenbosch Robben Island Thousands
160
140
120
100
80
60
40
20
0
Q1 Q2 Q3 Q4 Q1 Q2 Q3 Q4 Q1 Q2 Q3 Q4 Q1 Q2 Q3 Q4 Q1 Q2 Q3 Q4 Q1
2013 2014 2015 2016 2017 2018
Source: Derived from Wesgro and Cape Town Tourism data, May 2018.
6. Additional Indicators
In addition to macroeconomic indicators, administrative data capture specific consumer
trends and provide strong indications of the performance of the local economy. In
particular, building plan statistics and property development are key indicators of the levels
of confidence in the economy, while passenger vehicle sales mirror trends in the business
cycle and are regarded as a leading indicator of GDP growth.
12 Includes, Cape of Good Hope, Boulders Beach, Table Mountain Aerial Cableway, Kirstenbosch
National Botanical Gardens and Robben Island.
14
EPIC Economic Performance Indicators for Cape Town 2018 Quarter 1a. Building developments
The economic growth data for the first quarter of 2018 highlights that output at a national
level in the construction industry contracted by 1,9% quarter-on-quarter, its fifth consecutive
contraction. On a year-on-year basis, the sector contracted by 1,3% in the first quarter of
2018 as compared to its year-on-year contraction of 1,1% in the fourth quarter of 2017
(Quantec, 2018). The Western Cape’s construction industry also contracted by 1,9% quarter-
on-quarter in the first quarter of 2018, and by 1,3% on a year-on-year basis, putting it on par
with the national trend. Furthermore, the First National Bank (FNB)/BER composite Building
Confidence Index 13 (BER, 2018b) remained below 50 points despite gaining 12 index points to
register at 43 index points for the first quarter of 2018.
Building plans submitted to the City in the first quarter of 2018 decreased by 8,4% from the
previous quarter. Figure 12 provides an annual comparison of the number of building plans
submitted in each of the quarters over the past seven years, thereby controlling for seasonal
trends in the building and construction industry. Building plans submitted to the City in the first
quarter of 2018 increased by 6,6% compared to the corresponding period in 2017.
Figure 12: Building plans submitted to the CCT, 2012-2018
2012 2013 2014 2015 2016 2017 2018 Thousands
9
8.1 8.0 8.0
7.7 7.7 8
7.3 7.5 7.5
7.1 7.2 7.2
6.9 6.9 6.8 6.9 6.8 6.9
6.6 6.6 7
6.3 6.3 6.4
6.0 6.0
6
5.2
5
4
3
2
1
0
January-March (Q1) April-June (Q2) July-September (Q3) October-December (Q4)
Source: Transport Development Authority: Business Support Department, CCT, May 2018.
b. Commercial property developments
The performance of the commercial property market can be tracked in a number of ways.
An indicative trend analysis is provided in figure 13 by review of the observed variation in the
quarterly office vacancy rate, the total floor area of completed office buildings added to
the office property stock, the total floor area of completed office building alterations and
the quarter-on-quarter percentage change in provincial GVA for the finance and business
services sector. The finance, business and real estate service sector is the largest in Cape
Town and as such property developments in this sector are a useful measure of economic
activity.
13The FNB/BER Building Confidence Index captures the percentage of architects, quantity surveyors,
and contractors and manufacturers of building material, who are satisfied with or, wary of the
prevailing business conditions.
15
EPIC Economic Performance Indicators for Cape Town 2018 Quarter 1In the first quarter of 2018, construction of 649 m2 of new office or banking space was
reported to have been completed as well as 3 729 m2 of office or banking space alterations.
In terms of new office or banking space completed, this represents a notable decrease in
completions of -72,3% when compared to the fourth quarter of 2017 in which construction of
2 346 m2 of new office or banking space was completed. This substantial decrease in new
office space or bank space completed is also at odds with a historical trend where large
increases in completions of new office or banking space tend to take place in the first
quarter each year. It should however, be noted that one major development which was
originally planned for completion in the first quarter of 2018, the 156 Roggebaai
development (16 000 m2) in the Cape Town Central Business District (CBD), has now had its
completion date pushed out to the third quarter of 2018 (Jones Lang LaSelle [JLL], 2018a and
2018b). The vacancy rate remained at 6,9% in the first quarter of 2018, although new office
developments in Century City and Cape Town CBD are expected to be completed in the
second and third quarters of 2018, respectively, and thus expected to increase the stock of
office space which would place upward pressure on the vacancy rate in forthcoming
quarters (JLL, 2018b).
Figure 13: Office/banking space sector developments, January 2016 to March 2018
Total floor area (m2) Percentage (%)
100 000 10%
8%
80 000
6%
60 000
4%
40 000
2%
20 000
0%
0 -2%
Q1 Q2 Q3 Q4 Q1 Q2 Q3 Q4 Q1
2016 2017 2018
Total floor area of alterations
5 203 1 294 11 934 5 008 622 1 086 1 672 5 027 3 729
of new office/banking space
Total floor area of completed
70 671 13 045 12 951 1 953 7 548 3 629 17 164 2 346 649
of new office/banking space
Office vacancy rate 7.20% 7.80% 7.60% 7.60% 7.60% 7.30% 6.80% 6.90% 6.90%
Quarter-on-quarter change in
Finance, real estate and 2.5% 3.5% 2.4% 2.6% -0.5% 3.1% 1.9% 2.5% 1.0%
business services' GDP
Source: Transport Development Authority: Business Support Department, CCT, May 2018; Jones Lang
LaSelle, February 2018; and Quantec, June 2018.
As figure 13 shows, Cape Town’s office vacancy rate in the first quarter of 2018 remained the
same as in the previous quarter, at a rate of 6,9% (South African Property Owners Association
[SAPOA], 2018). The finance and business services sector in the Western Cape reported a
decrease in GVA growth from 2,5% in the fourth quarter of 2017 to 1,0% in the first quarter of
2018. According to the South African Property Owners Association (2017), a sustained
improvement in the office vacancy rate (i.e. return to the natural vacancy rate), depends on
the long-term strength of key economic drivers such as economic growth and business
confidence.
16
EPIC Economic Performance Indicators for Cape Town 2018 Quarter 1c. New vehicle sales
Total vehicle sales in the Western Cape increased from 15 911 in the fourth quarter of 2017 to
16 088 in the first quarter of 2018. Year-on-year results, which offer a more precise reflection of
vehicle sales’ performance over time however, saw a slight decline of 0,91% (a decrease in
vehicle sales by 147 units) from the 16 235 total vehicle sales observed in the corresponding
period in 2017. Passenger vehicle sales, which are the private consumer segment of the
market, increased from 10 463 in the fourth quarter of 2017 to 10 923 vehicles sold in the
Western Cape in the first quarter of 2018. On a year-on-year comparison, an increase of
1,09% (118 passenger vehicles) was recorded relative to the 10 805 passenger vehicles sold in
the first quarter of 2017. At the national level however, passenger vehicle sales decreased by
3,30% year-on-year to a total of 93 667 sales in the first quarter of 2018. The increase in
passenger vehicle sales in the Western Cape, at a time when they decreased nationally,
may be indicative of marginally higher consumer confidence levels in the province than the
country more broadly. Impacting positively on quarter-on-quarter passenger vehicles sales’
results, the National Association of Automobile Manufacturers of South Africa (NAAMSA)
attributes boosted sales throughout the country in March to consumers attempting to avoid
VAT-induced price hikes (Car Magazine, 2018), which came into effect at the start of the
second quarter (in April 2018).
17
EPIC Economic Performance Indicators for Cape Town 2018 Quarter 1Reference List
Airports Company South Africa (ACSA), 2018, Passenger movements.
Bureau for Economic Research (BER), 2018a, GDP comment: Notable contraction at the start
of 2018.
Bureau for Economic Research (BER), 2018b, FNB/BER Building Confidence Index, Quarter 1,
2018.
Cape Town Tourism, 2018a, Accommodation Performance Review and Forecast Report,
January to March 2018.
Cape Town Tourism, 2018, Highlights and Monthly Dashboards, January to March 2018.
Car Magazine, 2018, NAAMSA: March 2018 – ‘pre-emptive buying’ boosts sales, 3 April 2018,
http://www.carmag.co.za/news/naamsa-march-2018-pre-emptive-buying-boosts-
sales/.
City of Cape Town, 2018a, City of Cape Town: Water Dashboard, 25 June 2018. Water and
Sanitation Department
City of Cape Town, 2018b, Level 6 Water and Sanitation Tariffs, Water and Sanitation
Department. Available online at -
http://resource.capetown.gov.za/documentcentre/Documents/Forms,%20notices,%20
tariffs%20and%20lists/Water%20Sanitation_restriction_Tariffs_L6.pdf.
City of Cape Town, 2018c, Building developments, January 2011 to March 2018, Transport
Development Authority: Business Support Department.
City of Cape Town, 2018d, Water production and consumption, September 2013 to March
2018, Water and Sanitation Department.
City of Cape Town, 2018e, Water and Sanitation Tariff FAQs (31 May 2018), Water and
Sanitation Department. Available online at -
http://resource.capetown.gov.za/documentcentre/Documents/Procedures%2c%20gui
delines%20and%20regulations/Proposed%20Water%20and%20Sanitation%20Tariff.pdf.
IHS Markit, 2018, Regional eXplorer.
Jones Lang LaSalle (JLL), 2018a, Cape Town Office Market Report, Quarter 4 2017.
Jones Lang LaSalle (JLL), 2018b, Cape Town Office Market Report, Quarter 1 2018.
National Association of Automobile Manufacturers of South Africa (NAAMSA), 2018, New
vehicle sales, March 2008 to March 2018.
Quantec, 2018, EasyData.
South African Property Owners Association (SAPOA), 2017, Office Vacancy Report, April 2017.
South African Reserve Bank (SARB), 2018, Monetary Policy Statement, 28 March 2018.
Statistics South Africa, 2017-2018, various publications.
The Automobile Association of South Africa (AA), 2018, Fuel Pricing, Available online at -
https://www.aa.co.za/fuel-pricing
Transnet National Ports Authority of South Africa, 2018, Transnet Port Terminals: Ports Statistics.
Wesgro, 2018, Cape Town attractions: January to March 2018.
18
EPIC Economic Performance Indicators for Cape Town 2018 Quarter 1Abbreviations
ACSA: Airports Company South Africa
BER: Bureau for Economic Research
CCT/City: City of Cape Town
CPI: consumer price index
FNB: First National Bank
GDP: gross domestic product
GDP-R: regional gross domestic product
GGP: gross geographic product
GVA: gross value added
Ml: million litres
MPC: Monetary Policy Committee
NAAMSA: National Association of Automobile Manufacturers of South Africa
PPI: producer price index
SARB: South African Reserve Bank
V&A: Victoria and Alfred
VAT: value-added tax
19
EPIC Economic Performance Indicators for Cape Town 2018 Quarter 1You can also read