City of Ottawa Rental Market Analysis - Final - Documents
←
→
Page content transcription
If your browser does not render page correctly, please read the page content below
City of Ottawa Rental
Market Analysis
Final

 Prepared by:
 Prism Economics and Analysis
 March 15th, 2019
Contents

City of Ottawa Rental Market Analysis ............................................................................ 0
 Executive Summary ..................................................................................................... 3
 State of the Rental Market ....................................................................................... 3
 Private Rental Listing Platforms ............................................................................... 4
 Short-Term Rentals .................................................................................................. 4
 Rental Market Forecast ............................................................................................ 5
 1. Introduction............................................................................................................ 6
 2. Methodology .......................................................................................................... 7
 2.1 Rental Accommodation Inventory ...................................................................... 7
 2.2 State of the Rental Housing Market ................................................................... 9
 2.3 Rental Housing Market Forecast ........................................................................ 9
 Demographics and Households ............................................................................. 10
 Dwelling Stock........................................................................................................ 11
 Short-Term Rental Scenarios ................................................................................. 11
 Affordability Thresholds .......................................................................................... 12
 3. Findings from the Rental Housing Inventory........................................................ 13
 3.1 Profile of Overall Rental Supply ....................................................................... 13
 3.2 Profile of Average Rents .................................................................................. 19
 3.3 Housing Affordability ........................................................................................ 21
 3.4 Short-Term Rentals .......................................................................................... 24
 4. Findings from the Market Rent Analysis .............................................................. 27
 5. Rental Market Forecast ....................................................................................... 31
 5.1 Population and Demographics ......................................................................... 31
 5.2 Change in the Housing Stock ........................................................................... 32
 5.3 Change in Average Monthly Rent .................................................................... 37
 5.4 Change in Affordability ..................................................................................... 39
 5.5 Impact of short-term rentals on monthly rents .................................................. 40
 Conclusion ................................................................................................................. 42

Ottawa Rental Market Report
 1
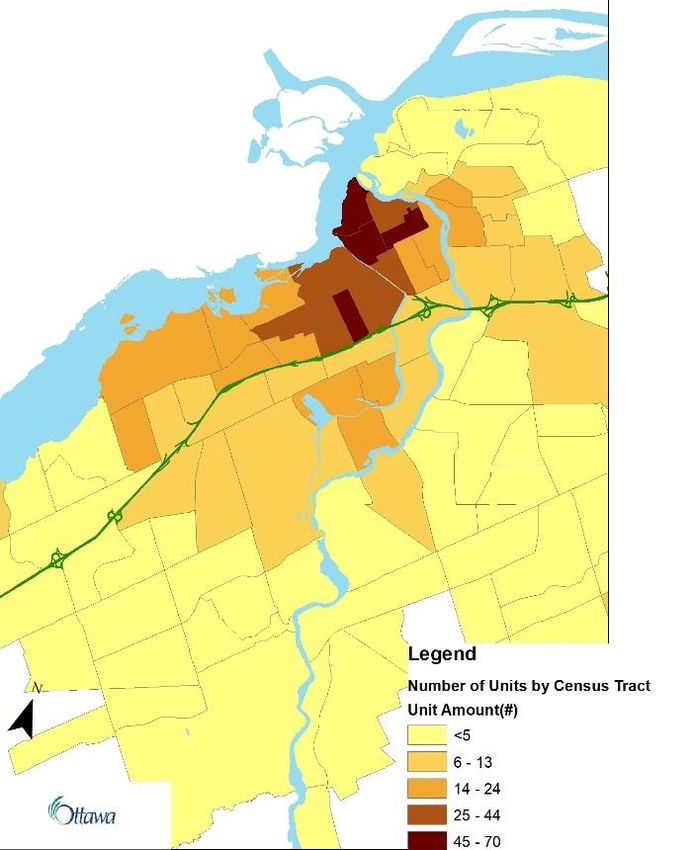
Table of Figures and Tables:
Figure 1 -Dwelling Types: Percent of High-Rise Apartments ........................................ 15
Figure 2 - Dwelling Types: Percent of Low-Rise Apartments ........................................ 16
Figure 3 – Starts by Dwelling Type: Ottawa .................................................................. 17
Figure 4 – Starts by Intended Market: Ottawa ............................................................... 17
Figure 5 – Affordability threshold for renters by Census Tract. ..................................... 21
Figure 6 - Crowding Map, Population per Bedroom ...................................................... 24
Figure 7 – Distribution of Short-term rental Units by Census Tract ............................... 26
Figure 8 - Population by Age Group .............................................................................. 31
Figure 9– Percentage Change in Population: 2016-2031.............................................. 32
Figure 10- Number of Dwellings: Status Quo Mix of Starts ........................................... 33
Figure 11 – Proportion of Housing Stock: Status Quo Mix of Starts .............................. 33
Figure 12 - Stock of Dwellings in Housing Forecast ...................................................... 34
Figure 13 – Dwellings by Use in Two Growth Scenarios ............................................... 34
Figure 14 - Supply/Demand Gaps ................................................................................. 36
Figure 15 - Total Dwelling Stock and Number of Households ....................................... 36
Figure 16 - Total # of Unaffordable Households ........................................................... 40
Figure 17 – Vacancy Rates and Rent Increases, 1992 to 2018 .................................... 40

Table 1 (A) – City of Ottawa, Renters and Units, 2016-2018 ........................................ 13
Table 1 (B) – Ottawa CMA (including Gatineau), Renters and Units, 2016-2018.......... 13
Table 2 – Inventory of housing units by Tenure, City of Ottawa, 2018 .......................... 14
Table 3 – Rental Units by Construction Era, Dwelling Types, 2018 .............................. 18
Table 4 – Rental Apartments by Construction Era, 2018 .............................................. 18
Table 5 – Buildings with Rental Units by Estimated Age of Construction, 2018 ............ 19
Table 6 (A) – Apartments .............................................................................................. 19
Table 6 (B) – Single Detached House ........................................................................... 19
Table 7 – Average monthly renter costs by neighbourhood, 2018 ................................ 20
Table 8 – Renter affordability threshold and population, 2016 ...................................... 22
Table 9 – Short-term Rental Listings 2016-2018 ........................................................... 25
Table 10 – Top Five Neighbourhoods for Short-Term Rental........................................ 25
Table 11 – Short-term Rentals by Dwelling Type and Bedrooms .................................. 27
Table 12 – Market Rent Listings by Bedroom Type, 2018 ............................................. 27
Table 13 – Average Asking Rent for Market Rentals by Bedroom ................................ 28
Table 14 – Growth Targets by Dwelling Type ............................................................... 37
Table 15 – Average Apartment Monthly Rents for the City of Ottawa By Bedroom, 2008
to 2031 .......................................................................................................................... 38
Table 16 – Average Row Housing Rent by Bedroom, 2008 to 2031 ............................. 39
Table 17 – Summary of Short-term Rental Impacts by 2031......................................... 41

Ottawa Rental Market Report
 2
Executive Summary
This report has two objectives. The first is to profile the current state of the rental
market in the City of Ottawa, including the emerging area of short-term rental properties.
The second is to forecast how the rental market in Ottawa is likely to develop over the
next decade.

The findings presented in this report are based on:

 • detailed data from the 2016 Census on housing and costs;
 • Canada Mortgage and Housing Corporation (CMHC) survey data on
 the change in rental prices from 2016 to 2018;
 • CMHC counts of new construction activity including the construction of
 rental-purposed units and condominiums;
 • the City of Ottawa forecasts on population and household composition;
 • Multiple Listing Service (MLS) records for the City of Ottawa to capture
 the upper end of the rental market;
 • Kijiji listings for rental properties to capture the middle and lower ends
 of the rental housing market;
 • online listings for short-term rentals in the period from 2016 to 2018;
 • additional data sources integrated into the Canadian Centre for
 Economic Analysis’ (CANCEA) forecast model;
 • data on the stock of buildings with rental accommodation obtained from
 the Municipal Property Assessment Corporation (MPAC).
This approach is comprehensive; it includes both primary (purpose-built rentals) and
secondary (e.g. rented condos, home conversions, etc.) rental markets and includes
both high-end house rentals and low-end shared accommodation for estimating both
total units and rent.

State of the Rental Market

The housing stock in Ottawa is divided between owners, who largely live in single
detached homes covering most of the City’s area, and renters, who largely live in
apartments located in concentrated areas accessible by transit. The rental market has
grown in supply (number of rental units) by approximately 1% between 2016 to 2018,
while over the same period, the population living in rental accommodation has grown by
a faster rate of 2.9%. This has contributed to a sharp rise in rents – over that same
period, apartment rents have risen by 7.8% and house rents by 11.3%. The increase in
rents reflects faster growth in population relative to the housing stock, a general rise in
incomes, and in some areas, the rapid growth of short-term rentals as an alternative use

Ottawa Rental Market Report
 3
of rental stock. Because rental housing is geographically concentrated, so are the
households facing housing affordability pressures. These households make up 40% of
renter households and that percentage is expected to continue to rise over the long-
term.

Private Rental Listing Platforms

There are a number of privately maintained platforms that provide information on
currently available rental units, including shared and rooming house accommodation.
These include Kijiji, Viewit, Padmapper, Liveonrent, and Craigslist, among others. In
this study, data from Kijiji was used to obtain information on the size and nature of rental
market units, current asking rents, and location. The statistical reliability of findings
based on these private platforms is not as strong as CMHC’s surveys which apply more
rigorous sampling rules. However, a large sample of private platform listings is
nevertheless indicative of actual trends in asking rents and fills an important gap in
information on the actual cost of shared and rooming house accommodation.

Short-Term Rentals

This study included a scraping of short-term rental listings from short-term rental
websites. It includes all listings from AirBnB and VRBO in the Ottawa area taken in the
period from August 2015 to December 2018. Although there are other short-term rental
services (e.g. Expedia), these services do not provide enough data to avoid duplication
issues (where the same properties are listed on multiple sites), and because they are
new entrants, each with a relatively small market share of overall properties, they were
not included. Key findings of the analysis include:

• The number of short-term rentals has grown rapidly, with listings increasing by 83%
 since 2016 and the number of exclusively short-term rental units increasing by 254%
 over the same period.
• Rapid growth is from a small base number of properties, and the pace of market
 growth is showing some signs of stabilizing.
• Short-term rentals are in the majority apartments.
• Short-term rentals are concentrated in areas of tourist interest and have low market
 penetration outside those areas.
• Approximately 1.2% of apartments (excluding purpose-built rental units) were used
 for short-term rentals, up from less than 0.4% in 2016.
• The share of exclusive STR units (those rented for more than 120 days a year) has
 doubled from 10% of overall listings in 2016 to 20% in 2018.

Ottawa Rental Market Report
 4
• By 2031, up to 1.85% of the rental stock could be short-term rentals if the current
 growth trends were to continue. If this were to result in pushing the vacancy rates by
 half that amount, annual rent increases could reach over 5%.

Rental Market Forecast

The supply of housing units has maintained a relatively stable linear growth in the City
of Ottawa, and this report forecasts that the stock of dwellings will continue to increase
by about 5,600 per year with the shift in construction moving away from single-detached
homes and towards apartments and row houses. If the current construction rates
continue and are considered against current demographic forecasts, this report
forecasts by 2031 a gap of approximately 18,000-19,000 dwellings for the population
trying to settle in Ottawa. In this scenario, average apartment rents would be expected
to rise by 41% in the period between 2018 and 2031.This would result in almost 25,000
more households living in unaffordable dwellings by 2031.

Ottawa Rental Market Report
 5
1. Introduction
Ottawa’s real estate market is characterized by rising prices and scarce availability of
rental units, which creates pressures for housing affordability but also motivates new
residential investment. This study compiles the available information about the current
stock of rental accommodation in the City of Ottawa (nature, size and location), and
provides estimates of current market rates for housing based on primary data obtained
from online listing platforms. The study also provides a forecast to 2031 of the future
rental housing market based on anticipated trends in population growth and economic
conditions. This study employs rental data from CMHC’s Rental Market Survey and
Secondary Rental Market Surveys which provide a base but an incomplete sample of
the overall rental housing market. For example, rooming houses and shared
accommodation are not covered by CMHC surveys. However, data from the 2016
Census makes it possible to capture the diverse changes in Ottawa’s housing market
among the City’s many neighbourhoods and distinguish between different types of
rental properties.

A key objective of this report is to address the City’s information gap about the current
state of the housing market by providing credible estimates of:
 • the stock of rental units by rental type
 • the number of buildings with residential rental accommodations
 • rent costs correlated with unit type, their location, and other relevant
 characteristics.

In addition, the report provides a ten-year forecast of the rental accommodation market
at the neighbourhood level taking into account the impact of the short-term rental
market.

Ottawa Rental Market Report
 6
2. Methodology
The findings in this report are based on the following data sources:

 • Detailed data from the 2016 Census on housing and costs.
 • CMHC survey data on the change in rental prices from 2016 to 2018.
 • CMHC counts of new construction activity including the construction of
 rental-purposed units and condominiums.
 • The City of Ottawa forecasts on population and household composition;
 • Multiple Listing Service (MLS) records for the City of Ottawa to capture
 the upper end of the rental market.
 • Kijiji listings for rental properties to capture the middle and lower ends
 of the rental housing market.
 • Online listings for short-term rentals in the period from 2016 to 2018;
 • Additional data sources integrated into CANCEA’s forecast model.
 • Data on the stock of buildings with rental accommodation obtained from
 the Municipal Property Assessment Corporation (MPAC).

Analysis of the dataset is divided into three components: the rental accommodation
inventory, the state of the rental accommodation market, and the rental market forecast.

2.1 Rental Accommodation Inventory

The first step in analyzing the rental market was developing an inventory of the number,
size, location, physical attributes (e.g., number of bedrooms and state of repair) and
average shelter costs of housing in the Ottawa Census Metropolitan Area (CMA). This
data was collected both for rental housing and for owner-occupied housing at the
Census Tract level from the 2016 Census. Housing was classified by dwelling type
(either an apartment, a semi-detached house, a row house, a detached house or a
moveable dwelling). It was also classified by the number of bedrooms (up to and
including three). The stock of housing and of rental housing were calculated by using
CMHC housing completion data and changes in short-term rentals from a dataset of
scraped data provided by AirDNA.

In order to advance Census data from 2016 to the current period, other existing data
sources, such as CMHC’s rental market data, were used to provide an estimate of the
change in average rents. The actual rents reported by CMHC’s survey were not used in
the analysis. The main CMHC survey is performed on purpose-built rental
accommodation but this distinction is not listed in the Census data and this was found to
produce a bias in most rent estimates because the secondary market forms a large
Ottawa Rental Market Report
 7
share of the rental housing market but CMHC’s supplementary secondary rental market
survey does not have the same level of precision as the primary study. In addition,
available data does not cover basement apartments or shared accommodations which
are vital components of the housing supply for low-income tenants. Instead, CMHC’s
observed changes in rental prices were applied to the 2016 Census data for rental
shelter costs.

Shelter costs is a term used by Statistics Canada to refer to the average monthly total of
all shelter expenses paid by households that own or rent their dwelling. Shelter costs for
owner households include, where applicable, mortgage payments, property taxes and
condominium fees, along with the costs of electricity, heat, water and other municipal
services. For renter households, shelter costs include, where applicable, the rent and
the costs of electricity, heat, water and other municipal services. Within this document,
the term rent is used to refer to shelter costs where the residents rent their
accommodation. This may understate shelter costs with respect to market rent data
because it is not uncommon for listings to exclude additional costs after rent in the text
of advertisements.

To measure housing affordability, the dataset uses Statistics Canada’s ‘Shelter-cost-to-
income ratio’, defined as the proportion of average total household income spent on
shelter costs. By this measure, shelter costs which exceed 30% of total income are
classified as unaffordable. Housing affordability data was also collected using dwelling
and bedroom type by Census Tract; however, data suppression was high at this level of
detail in less populated Census Tracts.

Population and household data is based on the 2016 Census demographic data
collected at the same level of detail as the housing dataset. In order to bring
demographic estimates forward to 2018, neighbourhood-level changes in terms of
populations and households, forecasted by the City of Ottawa, were applied to Census
Tract-level data and then normalized against the tract-level housing stock and the
overall population estimate for the City.

A growing factor in the supply of rental units are short-term rentals. Short-term rental
data was purchased from AirDnA, which conducts regular scrapes of AirBnB and VRBO
listings and compiles them into a historic database. Although monthly listing data was
available, the inventory analysis of short-term rental listings was based on repeated
listers for which data was scraped in the year being analyzed. Short-term rentals are
modelled in this analysis as a pure substitute for long-term rentals when the unit is listed
for more than 120 days in the twelve months prior to when the data was scraped.
AirDNA data includes the latitude and longitude of rented properties, which was used to
attach short-term rentals with individual Census Tracts. Properties listed for fewer than
120 days were not included in the overall rental analysis. Without further market
research, it unclear whether these rentals are at the expense of a long-term renter.

Ottawa Rental Market Report
 8
2.2 State of the Rental Housing Market

Some of the most up to date and detailed data on the rental market are the listings on
public rental boards such as Kijiji, Viewit, Padmapper, Liveonrent, and Craigslist.
Multiple listings on these sites contain details on the type of unit, the rent, and
approximate location (some listings have the exact address but not all). The listings are
updated frequently on these platforms and some are even updated in real-time. Since
the extent of cross-posts between platforms is high and unmeasurable, market rents
were extracted from three online sources:

 • short-term rents were extracted from online listings, as provided by AirDNA;
 • mid and lower market rents were extracted from Kijiji listings in October,
 November, and December of 2018; and
 • top-level rents were extracted from Multiple Listing Service (MLS) listings for
 houses in October, November, and December of 2018.

Rents are clearly stated in all web listings, although these represent asking rates
(overwhelmingly posted by landlords) rather than confirmed market-clearing rents,
which represent private transactions.

An additional source of error is found in the listings themselves. Kijiji postings often
contain incomplete information and errors. For example, many listings advertised on the
website for Ottawa were in fact for apartments outside the Ottawa CMA. Only data for
which dwelling types, number of bedrooms and location could be extracted from the
listing were used in the market rate analysis. Locations were determined either by
addresses or by nearby landmarks or neighbourhoods referenced in the listing. This
reduced the number of observations from 3,374 raw listings to 2,363 data points used.
MLS data was used for high-end rentals, typically single detached homes that are
infrequently rented through Kijiji. Only a small number of listings (139) were available for
the time period. Data quality for the listings was found to be high but not representative
in cost. However, there was no reasonable measure of this bias, therefore the data from
this sample was combined with Kijiji data without weighting.

2.3 Rental Housing Market Forecast

The rental housing market forecast was produced by the Canadian Centre for Economic
Analysis (CANCEA), using CANCEA’s Prosperity at Risk (PaR) model, a computer
simulation platform that incorporates and combines social, health, economic, financial,
and infrastructure factors into a single system in order to serve Canadians’ policy
interests. PaR is a unique, agent-based simulation modelling platform, wherein ‘agents’

Ottawa Rental Market Report
 9
(e.g., individuals, industries, governments and non-residents) are modelled
simultaneously as a complete system. These agents have a long list of attributes
(currently over 850) and behavioural rules, as well as associated financial statements
and assets. In particular, the people and households modelled in the platform have the
key attributes related to housing and affordability including age, income, household
structure (i.e. single, couple, lone-parent, with or without children), and dwelling type
(i.e. detached, apartment, semis, etc.). The resulting heterogeneity of the agents in the
system provides a realistic representation of the society of interest and allows
longitudinal tracking of individuals and households. For example, one could follow an
individual from birth, through employment, potentially becoming married, having
children, to retirement and eventually death. This modelling approach is uniquely suited
to identify the development of housing markets based on region, economic state and
household formation, as well as additional requirements such as accessibility and low
incomes.

Within the simulation platform, agents interact with each other, natural resources, the
infrastructure, and the economy, in accordance with their behavioural rules. In addition
to the endogenous rules of behaviour, external policy rules, such as limitations on
populations within a region or population density restrictions are a standard part of the
platform. PaR reflects over 5,000 Canadian census subdivisions that are linked through
population, health, infrastructure, socioeconomic policy and industry development
interdependencies with consistent historical data. For this analysis, PaR incorporated
Ottawa-specific housing and demographic data collected as part of the housing
inventory analysis and through the City’s plans for development over the next decade.

Demographics and Households

Demographics are modelled using a longitudinal stock-flow consistent model. The
various factors driving population growth – births, deaths, in-migration, and out-
migration -- are simulated based on recent regional historical trends. In general,
average birth rates are decreasing and women are having children at an older age.
Age-standardized death rates are also decreasing, resulting in an ageing population.
International immigration is a primary driver of overall population growth in Canada.

Within the population, households are formed following recent trends as well. Overall,
as the population ages and families are forming at later ages and with fewer children
per family and therefor the average household size is decreasing. The result is that the
number of households is increasing faster than the population. Household size is falling
from the 2.50 people per household observed in the 2016 Census to 2.46 projected in
2031.

Ottawa Rental Market Report
 10
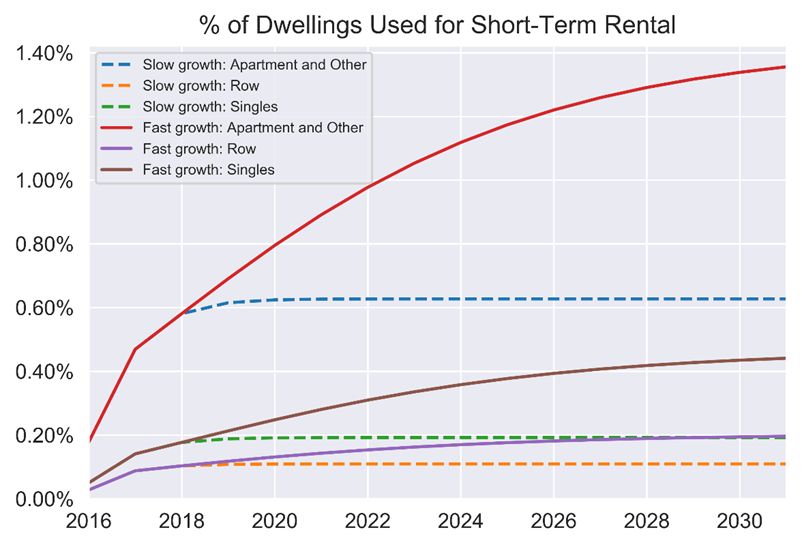
It is important to note that the demographic projection is modelled without any housing
constraints in order to capture the anticipated demand for housing. In practice, the
actual population of Ottawa could be reduced (or increased) if fewer (or more) dwellings
were built than required.

Dwelling Stock

The current dwelling stock is estimated from the rental housing inventory analysis. The
construction of dwellings is based on CMHC reported starts and completions by census
division. Under the status quo model, construction rates are assumed to follow the
average starts over the last five years. The dwelling stock and construction is divided
into 4 structural types, including:

 • Single detached home
 • Semi-detached home (relatively rare in Ottawa)
 • Row home
 • Apartments
Each dwelling is assigned one of 5 uses:
 • Owner-occupied
 • Primary rental (purpose-built rental)
 • Secondary rental (long-term)
 • Short-term rental
 • Other use
The ‘Other use’ category includes dwellings occupied by households not captured in the
census such as non-permanent residents.

The initial distribution of dwelling use is based on CMHC surveys and the 2016
Canadian Census Profile. The projected use of dwellings assumes that the current use
trends persist with a proportional adjustment for increased short-term rentals.

Short-Term Rental Scenarios

The introduction of short-term rentals into the housing market is a relatively recent
phenomenon, therefore historical trends are not available. However, over the last 3
years, there has been a considerable increase in the number of dwellings being rented
on a short-term basis. Over the long term, such rapid increases are unlikely to persist.
Therefore, two scenarios were considered:
 • Slow growth in short-term rentals: The prevalence of short-term rentals will
 increase slightly over the next couple of years before levelling off
 • Fast growth in short-term rentals: The prevalence of short-term rentals will
 continue to increase at rates seen recently for several more years before starting
 to level off

Ottawa Rental Market Report
 11
Actual growth can easily fall between these two scenarios. Short-term rentals are
concentrated in tourist areas of the City and thus have a natural limit that can constrain
adoption but are building from a relatively small base with most growth happening in just
the last two years.
Affordability Thresholds

The number of households facing affordability challenges (i.e. spending more than 30%
of the income on shelter costs) depends on both the incomes of the household
members and costs of dwellings in a dynamic housing market. Both incomes and
housing costs depend on many variables, such as interest rates, labour markets, and
international economic activity. Numerous assumptions would be required to fully model
the dynamics. However, a simplified approach is to ask the question of: How many
more households would face affordability issues if the status quo was to continue? The
forecast analysis is based on the continuation of rent increases currently seen over the
short-term (the next two years) easing into an inflation-based estimation over the
medium to long term. These conservative estimates are compared against the
continuation of current trends in income growth to estimate the change in the number of
households living below the affordability threshold.

Ottawa Rental Market Report
 12
3 Findings from the Rental Housing Inventory
This section reports the findings from the quantitative analysis of the inventory of rental
housing.

3.1 Profile of Overall Rental Supply
Over the last three years, the supply of new rental units has increased by 1%, but the
population living in rental housing increased by 2.9%. As a result, the population per
rental unit has risen from 2.05 residents to 2.07 in the City of Ottawa.

 Table 1 (A) – City of Ottawa, Renters and Units, 2016-2018

 Year Rental Units Population in Population per
 Rental Housing unit
 2016 131,444 269,228 2.05
 2017 131,629 271,531 2.06
 2018 132,567 274,616 2.07

 Table 1 (B) – Ottawa CMA (including Gatineau), Renters and Units, 2016-2018

 Year Rental Units Population in Population per
 Rental Housing unit
 2016 179,075 359,152 2.01
 2017 179,757 365,192 2.03
 2018 180,899 369,117 2.04

The above figures are based on a simple calculation: the population estimate provided
by the City of Ottawa, the number of purpose-built rental and condominium housing
units completed as reported by CMHC, the number of units used for short-term rentals,
and the historic distribution between use in condominiums between owner and renter
occupation. It may be the case that the city has seen an expansion of the secondary
rental universe at the expense of owner-occupied housing. This which would alleviate
the trend of higher population per unit but there is no data available to test this
hypothesis.

Most housing in the City of Ottawa is composed of owner-occupied, single-detached
homes, with high rise apartments contained within the region surrounded by Ottawa’s
green belt. The estimated 2018 distribution of units by dwelling types for the City of
Ottawa shows that most renters (69%) live in apartments and relatively few reside in
homes of any type except row houses. Table 2 provides an estimate of the inventory of
housing units by type and tenure for 2018.

Ottawa Rental Market Report
 13
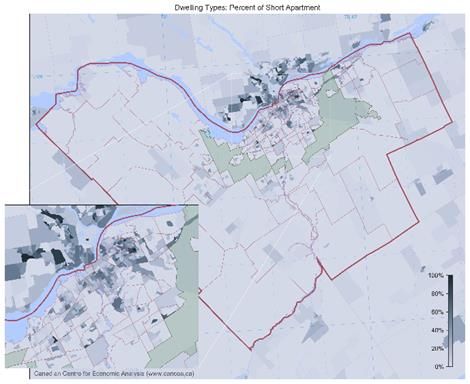
Table 2 – Inventory of housing units by Tenure, City of Ottawa, 2018

 All Apartment Row Semi- Single Movable
 Houses Detached Detached dwellings (e.g.
 Homes Mobile Homes)
 Owner 270,802 27,309 55,478 17,477 169,613 925
 Renter 132,887 91,886 26,422 4,775 9,644 160
 Total 403,689 119,195 81,900 22,252 179,257 1,085

Of the apartments, most of the stock is highly concentrated in distinct neighbourhoods
in the City of Ottawa and are mainly comprised of high-rise apartments (low-rise
apartments, buildings of 5 storeys or less, are relatively more common in Gatineau) as
shown in Figures 1 & 2.

Ottawa Rental Market Report
 14
Figure 1 -Dwelling Types: Percent of High-Rise Apartments

Source: CANCEA

Ottawa Rental Market Report
 15
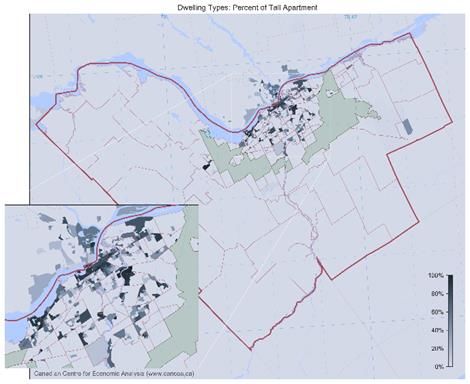
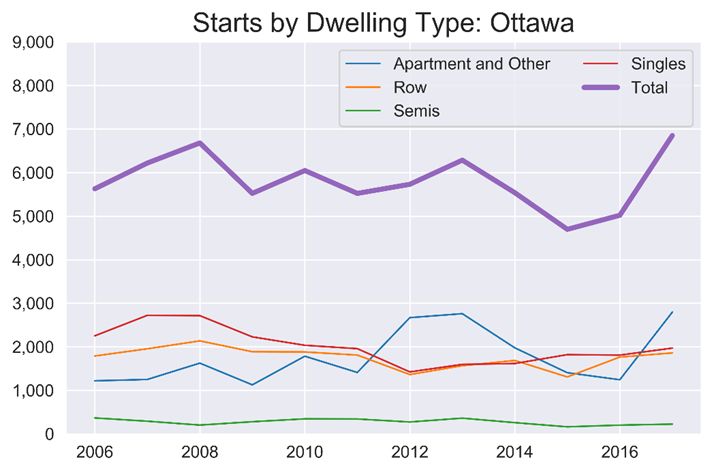
Figure 2 - Dwelling Types: Percent of Low-Rise Apartments

Source: CANCEA

Total housing construction has averaged about 5,800 units per year in Ottawa for the
past decade. The units constructed have been fairly evenly split between apartments
(1,770 per year), row houses (1,750 per year), and single-detached houses (2,010 per
year). Starts have fallen slightly over the past five years but this has been counteracted
somewhat by a slow but consistent increase, starting in 2012, in the number of units
intended for the rental market as shown in Figures 3 & 4

Ottawa Rental Market Report
 16
Figure 3 – Starts by Dwelling Type: Ottawa

Figure 4 – Starts by Intended Market: Ottawa

Ottawa Rental Market Report
 17
The rental housing stock for the City of Ottawa is aging, with most (62%) of rental units
built before 1979. New rental units that are being constructed are overwhelmingly (97%)
apartments, either purpose-built units or new condominiums rented by their owners.
There is anecdotal evidence, however, that there are newly constructed single detached
homes that have been converted to secondary market rental units but no hard data on
this is available.

 Table 3– Rental Units by Construction Era, Dwelling Types, 2018

 Before 1960 to 1980 to 2000 to After 2016
 1960 1979 1999 2016
 All 28,649 54,140 30,751 18,063 1,613
 Apartment 20,678 40,029 19,450 10,424 1,573
 Row 2,724 9,356 8,701 5,654 40
 Semi- 1,750 1,657 766 601 n/a
 Detached
 Single 3,497 3,098 1,834 1,384 n/a

Limiting the housing stock to only rental units and looking at the number of bedrooms
available in these units (see Table 4 below) shows that over time there has been a shift
in supplier preferences towards apartments with more bedrooms. In buildings older than
1960, 51% of units are one-bedroom, but that is true of only an estimated 32% of
buildings built in the last two years. Conversely, the share of two-bedroom units has
risen from 37% of units in apartment buildings older than 1960 to 51% of units in new
construction.

 Table 4 – Rental Apartments by Construction Era, 2018

 Before 1960 to 1980 to 2000 to After
 1960 1979 1999 2016 2016
 Bachelor
 586 1,088 405 221 89
 1 Bedroom
 10,614 21,512 9,528 4,645 489
 2 Bedroom
 7,663 14,659 8,306 5,012 772
 3+
 Bedroom 1,806 2,796 1,254 461 165
 All
 20,669 40,055 19,493 10,339 1,515

This data can further be broken down by the number of buildings themselves, as shown
in Table 5 below. This table estimates the distribution of building ages based on building

Ottawa Rental Market Report
 18
counts provided by MPAC. For apartments, this includes both owned and rented
condominium properties because both properties can be found within condominium
buildings.

 Table 5 – Buildings with Rental Units by Estimated Age of Construction, 2018
 Before 1960 1960 to 1979 1980 to 1999 2000 and After Total
 All 10,584 31,348 27,672 18,045 87,649
 Apartment 435 846 476 359 2,116
 Row 8,064 27,696 25,757 16,857 78,374
 Semi- 1,801 1,706 789 619 4,915
 Detached
 Single 284 1,100 650 210 2,244

3.2 Profile of Average Rents

Shelter costs for the City of Ottawa have risen rapidly since 2016, with apartment rents
rising 7.8% over a two-year period and rent on detached homes increasing by 11.2%.
This has increased the average rent for a three-bedroom house from $1,547 in 2016 to
$1,737 in 2018.

Average Rents in the City of Ottawa by Dwelling Type, 2016-18
 Table 6 (A) – Apartments

 Percentage (%) Change Average Rent ($) per month
 Bedrooms Bedrooms
 Bachelor 1 2 3+ Total Bachelor 1 2 3+ Total
 2016 n/a n/a n/a n/a n/a 769 959 1,237 1,313 1,088
 2017 3.5 2.0 2.0 2.3 2.1 796 978 1,262 1,343 1,111
 2018 5.2 5.9 5.8 5.6 5.6 838 1,036 1,335 1,419 1,173

 Table 6 (B) – Single Detached House

 Percentage (%) Change Average Rent ($) per month
 Bedrooms Bedrooms
 Bachelor 1 2 3+ Total Bachelor 1 2 3+ Total
 2016 n/a n/a n/a n/a n/a 1,279 986 1,223 1,547 1,454
 2017 4.0 4.0 4.4 6.1 4.0 1,331 1,025 1,277 1,641 1,513
 2018 7.0 7.0 6.4 5.9 7.0 1,424 1,097 1,358 1,737 1,645

A geographic analysis of average rents in the City of Ottawa shows some common
patterns can be identified when looking at specific housing types. Rents are generally
higher close to the downtown core and in areas close to public transportation, but
Ottawa shows an interesting contrast in that some suburban areas show relatively

Ottawa Rental Market Report
 19
expensive rental markets – Kanata/Stittsville, for example, has higher rental costs, than
downtown neighbourhoods like the Glebe.

 Table 7 – Average monthly renter costs by neighbourhood, 2018

 Semi-
 Neighbourhood All Apartment Row Single
 Detached
 City of Ottawa 1,264 1,173 1,408 1,423 1,645
 Alta Vista 1,173 1,113 1,311 1,177 1,584
 Barrhaven and Rural
 1,606 1,449 1,611 1,636 1,939
 Nepean
 Bayshore/Crystal
 1,303 1,184 1,432 1,436 1,449
 Beach/West College
 Beacon Hill/Cyrville 1,291 1,146 1,435 1,394 1,612
 Britannia/Lincoln Heights 1,087 1,072 959 1,504 1,463
 Carlington 1,040 981 1,041 1,250 1,573
 Chinatown/Hintonburg 1,136 1,093 1,158 1,522 1,756
 Clarence-Rockland 1,207 1,032 1,206 1,287 1,607
 Downtown 1,319 1,298 1,625 1,511 1,687
 Eastern Orleans/Rural
 1,432 1,190 1,600 1,160 1,633
 Eastern Ottawa
 Gatineau 928 874 918 1,082 1,107
 Glebe 1,519 1,485 1,561 1,682 1,867
 Gloucester/Western
 1,405 1,263 1,469 1,461 1,706
 Orleans
 Hampton Park 1,409 1,314 1,284 1,915 1,951
 Hunt Club/South Keys 1,152 1,026 1,265 1,420 1,519
 Iris/Queensway
 1,214 1,151 1,284 1,395 1,487
 Terrace/Whitehaven
 Kanata/Stittsville 1,559 1,527 1,561 1,325 1,806
 Knoxdale 1,317 1,171 1,479 1,287 1,516
 Lowertown 1,191 1,163 1,315 1,437 1,246
 New Edinburgh/Manor
 1,234 1,128 1,260 2,001 2,295
 Park/Rockcliffe Park
 North Grenville MU 1,298 1,080 1,381 1,168 1,561
 Old Ottawa South 1,377 1,274 1,767 1,800 1,918
 Overbrook/Castle Heights 1,103 1,005 1,279 1,247 1,393
 Rural Western Ottawa 1,445 969 1,554 1,184 1,623
 Sandy Hill 1,216 1,188 1,172 1,741 1,762
 Vanier 1,068 1,050 1,246 1,109 1,197
 West Centretown/Fisher
 1,421 1,331 1,577 1,861 1,670
 Park
 Westboro North/Tunney's
 1,334 1,292 1,595 1,798 1,589
 Pasture
 Westboro South 1,164 1,141 1,431 1,008 1,943

Ottawa Rental Market Report
 20
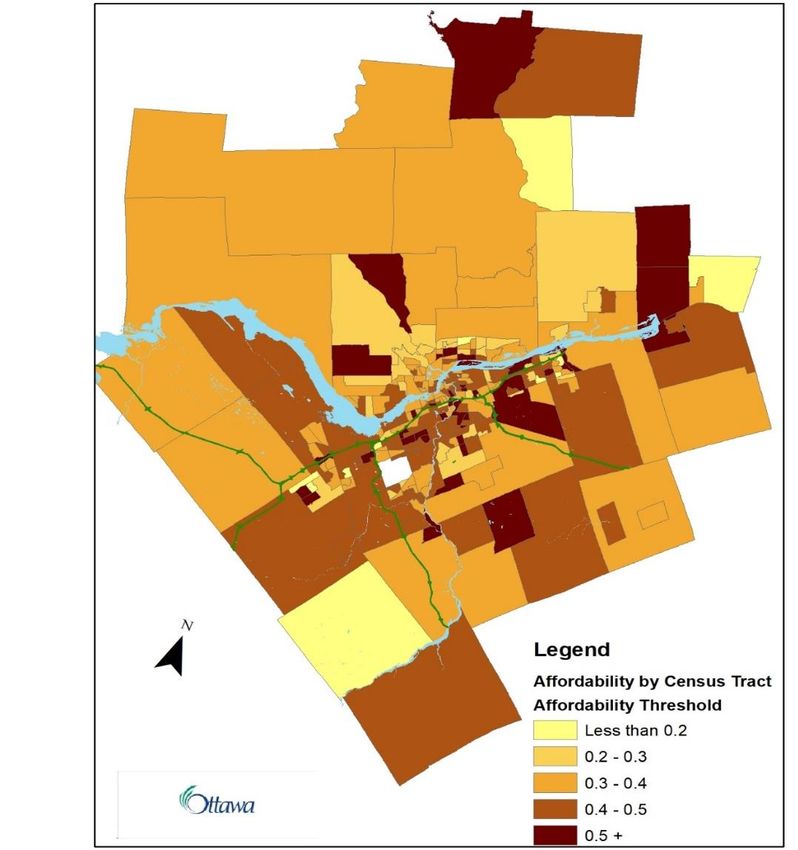
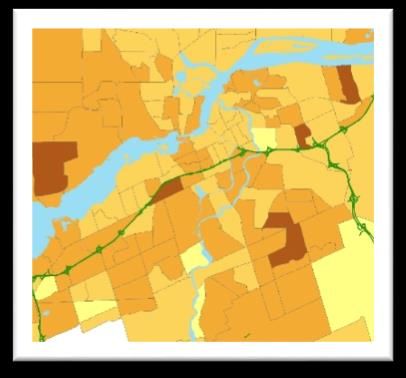
3.3 Housing Affordability

The continued rise in rental prices has created challenges for lower-income residents
struggling to find affordable and appropriate shelter. In order to measure this, Statistics
Canada uses the shelter-cost-to-income ratio - the proportion of average total income of
household which is spent on shelter costs. The affordability measure is simply the share
of households with a shelter-cost-to-income ratio above 30%. This measure does not
show the severity of unaffordable housing within an individual household, but when
considered within a geographic area it can be used to observe the scope of
unaffordable housing within the area. In 2016, over 42% of all renter households and
14% of all owner-occupied households in the City were paying over 30% of their total
income on shelter expenses. Figure 5 shows the share of the population below the
affordability threshold for renters by Census Tract. It shows that unaffordable housing
exists not only in lower-income suburban areas but also in pockets of exurban tracts,
likely reflecting the high cost of single detached homes even in less dense communities.

Figure 5 – Affordability threshold for renters by Census Tract.

Ottawa Rental Market Report
 21
From a public policy standpoint, combining population with the affordability threshold for
the renter population shows the concentration of need. Communities like Alta Vista
combine high shelter costs with high population (10,327 people there are estimated to
spend more than 30% of their income on shelter costs).

 Table 8 – Renter affordability threshold and population, 2016

 Shelter
 Population
 Spending
 in
 Neighbourhood Over Population
 Unaffordable
 Affordability
 Housing
 Threshold
 City of Ottawa 0.42 269,536 113,205
 Alta Vista 0.48 21,515 10,327
 Barrhaven and Rural Nepean 0.39 10,442 4,072
 Bayshore/Crystal Beach/West College 0.44 12,012 5,285
 Beacon Hill/Cyrville 0.42 10,721 4,503
 Britannia/Lincoln Heights 0.43 10,290 4,425
 Carlington 0.42 10,550 4,431
 Chinatown/Hintonburg 0.46 7,270 3,344
 Clarence-Rockland 0.45 3,613 1,626
 Downtown 0.38 20,690 7,862
 Eastern Orleans/Rural Eastern
 0.4 10,237 4,095
 Ottawa
 Gatineau 0.36 89,618 32,262
 Glebe 0.39 3,405 1,328
 Gloucester/Western Orleans 0.4 17,105 6,842
 Hampton Park 0.42 2,730 1,147
 Hunt Club/South Keys 0.41 19,913 8,164
 Iris/Queensway Terrace/Whitehaven 0.39 11,996 4,678
 Kanata/Stittsville 0.39 13,281 5,180
 Knoxdale 0.48 15,614 7,495
 Lowertown 0.42 8,500 3,570
 New Edinburgh/Manor Park/Rockcliffe
 0.37 6,119 2,264
 Park
 North Grenville MU 0.42 1,695 712
 Old Ottawa South 0.53 4,556 2,415
 Overbrook/Castle Heights 0.4 12,632 5,053
 Rural Western Ottawa 0.39 2,915 1,137
 Sandy Hill 0.46 8,125 3,738
 Vanier 0.49 10,500 5,145
 West Centretown/Fisher Park 0.41 3,315 1,359

Ottawa Rental Market Report
 22
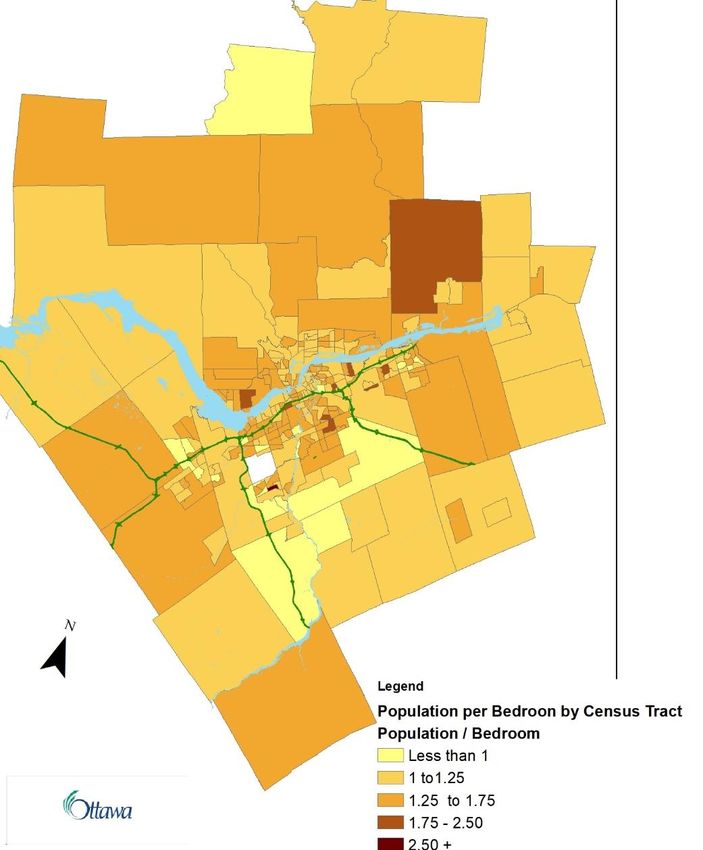
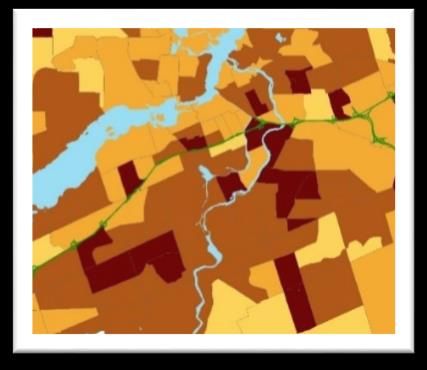
Shelter
 Population
 Spending
 in
 Neighbourhood Over Population
 Unaffordable
 Affordability
 Housing
 Threshold
 Westboro North/Tunney's Pasture 0.35 6,735 2,357
 Westboro South 0.48 3,060 1,469

Since 2016 the shortage of affordable rental accommodations has likely worsened, as
the number of rental units has grown slower than the population in rental
accommodation and current market rent listings for apartments are on average 28%
higher than 2018 average rents (see Section 4 – Findings from the Market Rent
Analysis).

Unaffordable housing can also lead to over-crowding, particularly with shared
accommodation. Table 1 shows that between 2016 and 2018, the per-bedroom
population in Ottawa rose from 2.01 to 2.04. Mapping this data onto Census Tracts
(Figure 6) show that there is a generally uniform level of crowding across the city, with
the exception of a few small pockets. In general, suburban areas in the south and west
of the City are more crowded and this correlates with the share of households in
unaffordable rental housing.

Ottawa Rental Market Report
 23
Figure 6 - Crowding Map, Population per Bedroom

3.4 Short-Term Rentals

The number of short-term rental units has been growing quickly over the last several
years, with total listings increasing from 3,434 in 2016 to 6,278 in 2018. An important
distinction can be made between exclusive listings (whole properties that are put on the
short-term rental market for more than 120 days a year) and non-exclusive listings
(properties that are put up for short-term rental on a highly seasonal basis or for which
only individual rooms are rented). Exclusive listings increased from 349 in 2016 to 1,236
in 2018. While the total number of listed properties levelled off between 2017 and 2018,
the share of exclusive short-term rental listings continued to rise. As a result, overall
revenue from short-term rentals continued to climb, from $11.7M in 2016 to about
$39.8M in 2018.

Ottawa Rental Market Report
 24
Table 9 – Short-term Rental Listings 2016-2018

 Total Exclusive Revenue ($millions)
 Listings Listings
 2016 3,434 349 11.7
 2017 6,286 980 31.4
 2018 6,278 1,236 39.8

Exclusive listings are highly concentrated in areas with high levels of tourism traffic. As
shown in Table 10, 52% of short-term rentals are based in five neighbourhoods and
36% in the top two neighbourhoods of Downtown and Lowertown. Figure 7 shows the
distribution of short-term rentals by Census Tract.

 Table 10 – Top Five Neighbourhoods for Short-Term Rental

 Neighbourhood Units Share
 of
 Total
 Downtown 248 20%
 Lowertown 197 16%
 Sandy Hill 78 6%
 Chinatown/Hintonburg 67 5%
 Vanier 57 5%

Ottawa Rental Market Report
 25
Figure 7 – Distribution of Short-term rental Units by Census Tract

The high concentration of short-term rental units in the downtown is a pattern seen in
most other cities and one that places a limit on the adoption of short-term rentals over
the city as a whole. At the same time, this concentration intensifies the impact in those
areas where full-time use as a short-term rental is desirable, materially eroding the
stock of rental housing for long-term use.

The units placed up for exclusive short-term rent mirror the long-term rental housing
stock in the areas where they are located - whereas most dwellings in Ottawa are
houses, most short-term rentals are apartments (see Table 7). The impact on the
overall rental housing stock is small but growing: In 2018, over 1.2% of apartments
(excluding purpose-built rental units) were used for short-term rentals, up from less than
0.4% in 2016.

Ottawa Rental Market Report
 26
Table 11 – Short-term Rentals by Dwelling Type and Bedrooms

 Bachelor 1 2 3+ Total
 Bedroom Bedroom Bedroom
 Apartment
 2016 29 132 61 21 243
 2017 89 346 174 56 665
 2018 124 418 227 71 840
 House
 2016 3 9 30 64 106

 2017 4 31 80 200 315

 2018 6 37 98 255 396

4 Findings from the Market Rent Analysis
Samples of online rental data from the period from October to December 2018 extracted
2,214 apartment listings and 230 house listings that could be identified as rentals from
the content of the advertisements themselves. Prices in listings largely reflect rents
asked by landlords and may be higher than the rent actually paid. In general, asking
rents are much higher than average rents: averaging $1,572 for apartments against a
2018 average rent of $1,173 and $2,714 for single detached homes against an average
rent of $1,645. Assuming that listings are more likely to be made in neighbourhoods
with higher average rents, the average asking rent is approximately 28% above the
average rent for apartments, 30% above the average rent for row houses and 84%
above the average rent for single detached homes. For single detached homes, this is
likely exacerbated by some selection bias towards the higher end in MLS data.

 Table 12 – Market Rent Listings by Bedroom Type, 2018

 1 2 3
 Bachelor All
 Bedroom Bedroom bedroom
 Apartment
 Asking Rent 1,174 1,401 1,674 1,977 1,572
 Number of Listings 207 755 977 275 2,214
 Average Rent 838 1,036 1,335 1,419 1,173
 Row Housing
 Asking Rent 906 1,380 1,862 1,926 1,737
 Number of Listings 4 11 23 23 61
 Average Rent 937 978 1,278 1,441 1,408
 Single-Detached Housing
 Asking Rent 1,050 1,819 2,525 2,948 2,714
 Number of Listings 2 14 47 106 169
 Average Rent 1,424 1,097 1,358 1,737 1,645

Ottawa Rental Market Report
 27
Breaking down the online listings into neighbourhoods shows that the listings
 themselves are concentrated in particular neighbourhoods, with downtown properties
 attracting the most listings (418), which is likely due to a tendency for landlords to
 describe properties as being located downtown when they are, in fact, not. But other
 downtown neighbourhoods without this problem also show high numbers of listings,
 including Sandy Hill (182), Chinatown/Hintonburg (135), and Lowertown (252).

 Table 13 – Average Asking Rent for Market Rentals by Bedroom

 1 2 3+
 Neighbourhood Dwelling Type Bachelor Listings
 bedroom bedroom bedrooms
Alta Vista Apartment n/a 1,037 1,356 1,884 102
Alta Vista Single n/a n/a 2,575 2,967 8
Barrhaven and Rural
 Apartment 1,000 1,200 1,479 1,974 36
Nepean
Barrhaven and Rural n/a n/a
 Row 1,750 1,740 2
Nepean
Barrhaven and Rural n/a n/a
 Single 2,830 5
Nepean
Bayshore/Crystal n/a
 Apartment 1,390 1,561 1,917 55
Beach/West College
Bayshore/Crystal n/a n/a n/a
 Row 1,650 1
Beach/West College
Bayshore/Crystal n/a n/a
 Single 2,200 2,548 3
Beach/West College
Beacon Hill/Cyrville Apartment 985 1,317 1,339 1,886 35
Beacon Hill/Cyrville Row n/a n/a n/a 1,675 1
Beacon Hill/Cyrville Single n/a 900 n/a 3,667 4
Britannia/Lincoln
 Apartment 996 1,119 1,424 1,636 101
Heights
Britannia/Lincoln n/a n/a n/a
 Row 1,150 1
Heights
Britannia/Lincoln n/a
 Single 1,500 1,072 2,150 4
Heights
Carlington Apartment 1,012 1,116 1,372 2,048 119
 n/a n/a n/a
Carlington Row 1,666 3
 n/a n/a n/a
Carlington Single 3,358 3
Chinatown/Hintonburg Apartment 1,362 1,590 1,908 2,391 135
Chinatown/Hintonburg Row n/a n/a 1,900 1,395 2
Chinatown/Hintonburg Single n/a 1,722 2,491 2,700 8
Clarence-Rockland Apartment 834 858 1,099 1,200 22
Downtown Apartment 1,200 1,591 1,846 2,048 418

 Ottawa Rental Market Report
 28
1 2 3+
 Neighbourhood Dwelling Type Bachelor Listings
 bedroom bedroom bedrooms
Downtown Row 975 1,650 2,329 2,650 13
Downtown Single n/a 2,500 2,892 3,367 7
Eastern Orleans/Rural n/a n/a
 Apartment 1,525 1,775 6
Eastern Ottawa
Eastern Orleans/Rural n/a n/a n/a
 Single 2,833 9
Eastern Ottawa
Gatineau Apartment n/a 812 1,817 800 23
Glebe Apartment 1,275 1,514 1,841 2,750 30
Glebe Row n/a n/a n/a 3,500 1
Gloucester/Western
 Apartment 882 1,223 1,395 1,684 61
Orleans
Gloucester/Western n/a n/a
 Row 1,775 1,898 4
Orleans
Gloucester/Western n/a n/a
 Single 2,020 2,928 13
Orleans
Hampton Park Apartment 930 1,666 2,113 2,306 107
Hampton Park Row 950 n/a n/a n/a 1
Hampton Park Single n/a n/a 2,286 3,562 11
Hunt Club/South Keys Apartment 1,050 1,090 1,470 1,416 59
Hunt Club/South Keys Row n/a n/a 1,186 1,900 4
Hunt Club/South Keys Single n/a n/a 1,925 2,899 9
Iris/Queensway
 Apartment 1,012 1,184 1,396 1,845 59
Terrace/Whitehaven
Iris/Queensway n/a n/a n/a
 Single 2,360 5
Terrace/Whitehaven
Kanata/Stittsville Apartment 1,027 1,539 2,046 1,345 30
Kanata/Stittsville Row n/a n/a 1,450 1,620 5
Kanata/Stittsville Single n/a 1,200 2,550 2,726 19
Knoxdale Apartment n/a 1,313 1,680 1,538 47
Knoxdale Single n/a n/a n/a 2,950 4
Lowertown Apartment 1,383 1,585 1,975 2,092 252
Lowertown Row 450 1,717 2,600 n/a 5
Lowertown Single n/a 2,000 2,600 3,275 10
New
Edinburgh/Manor Apartment 1,133 1,658 1,729 1,988 38
Park/Rockcliffe Park
New n/a n/a n/a
Edinburgh/Manor Single 2,600 1
Park/Rockcliffe Park
Old Ottawa South Apartment n/a 1,212 1,318 1,475 7
Old Ottawa South Single n/a n/a 2,500 3,300 2

 Ottawa Rental Market Report
 29
1 2 3+
 Neighbourhood Dwelling Type Bachelor Listings
 bedroom bedroom bedrooms
Overbrook/Castle
 Apartment 888 1,047 1,238 1,268 43
Heights
Overbrook/Castle n/a
 Single 2,268 3,464 3,025 12
Heights
Rural Western Ottawa Apartment 979 1,120 1,469 1,947 95
Rural Western Ottawa Row n/a 875 1,750 1,841 7
Rural Western Ottawa Single 600 n/a 2,267 2,619 12
Sandy Hill Apartment 1,295 1,273 1,617 2,407 182
Sandy Hill Row n/a 450 1,700 2,800 4
Sandy Hill Single n/a n/a 1,487 3,815 5
Vanier Apartment 803 1,312 1,376 1,358 69
Vanier Row n/a n/a 1,200 n/a 1
Vanier Single n/a n/a n/a 3,600 2
West
Centretown/Fisher Apartment 962 1,302 1,570 2,100 19
Park
West n/a n/a
Centretown/Fisher Row 1,250 1,950 2
Park
West n/a
Centretown/Fisher Single 2,100 2,600 3,694 9
Park
Westboro
North/Tunney's Apartment 1,111 1,341 1,810 2,184 78
Pasture
Westboro n/a n/a
North/Tunney's Row 2,165 2,400 4
Pasture
Westboro n/a n/a
North/Tunney's Single 3,950 2,000 4
Pasture
Westboro South Apartment n/a 1,360 1,574 n/a 9

 Ottawa Rental Market Report
 30
5 Rental Market Forecast
5.1 Population and Demographics

The population used for the rental market forecast is based on a natural growth model.
It follows the current migration, death, and birth trends for the City independent of
housing stock constraints. The model forecasts a 24% increase in population between
2016 and 2031. The existing growth plans for the City of Ottawa are consistent with this
approach.

Figure 8 - Population by Age Group

From 2016 to 2031, the age distribution of the City is expected to significantly skew
older, with the population at or above the age of 75 more than doubling. As a share of
overall population, the percentage of persons 75 and over will increase from 6% to 10%
by 2031. During that same time, the share of the population between 25 and 65 years of
age is forecasted to decline from 56% of the population in 2016 to 51% in 2031.

Ottawa Rental Market Report
 31
Figure 9– Percentage Change in Population: 2016-2031

As the population ages, the average household size in Ottawa is expected to fall, from
2.50 in 2016 to 2.46 in 2031. This places pressure on housing availability, because
housing demand is driven by households and falling household size results in demand
for housing increasing faster than the population.

5.2 Change in the Housing Stock

If current building trends continue, the stock of dwellings is expected to increase by
about 5,600 per year. Two scenarios are considered in the rental market forecast: a
slow growth approach where short-term rentals increase slightly and then level off after
2018; and a fast growth approach where trends over the last two years continue at a
similar rate. In the fast growth scenario, the number of new rental units are expected to
increase over time, rising from 1,205 new units per year in 2018 to 2,203 by 2031
(considering both purpose-built rental units and units originally intended as owner-
occupied housing) at the expense of growth of owner-occupied housing. In the forecast
for each scenario, the share of apartment and row houses increases and the fraction of
single-detached homes falls. This is in keeping with the historic trend for the City. New
rental units are distributed in a relatively stable pattern with almost all new units (99%)
composed of either row houses or apartment units. This analysis does not include the
constraint on land imposed by each building’s footprint but if land-use constraints were
applied, this change would be even more pronounced.

Ottawa Rental Market Report
 32
Figure 10- Number of Dwellings: Status Quo Mix of Starts

Figure 11 – Proportion of Housing Stock: Status Quo Mix of Starts

Ottawa Rental Market Report
 33
Figure 12 - Stock of Dwellings in Housing Forecast

The fast growth scenario results in a significant loss of long-term rental accommodation
to short-term rentals, amounting to about 1.4% of all dwellings, with a particular impact
on apartment units rented on the secondary market (not purpose-built rental units put on
the rental market). Still, neither scenario substantively impacts the ownership structure
of dwellings expected in the City.

 Figure 13 – Dwellings by Use in Two Growth Scenarios

Ottawa Rental Market Report
 34
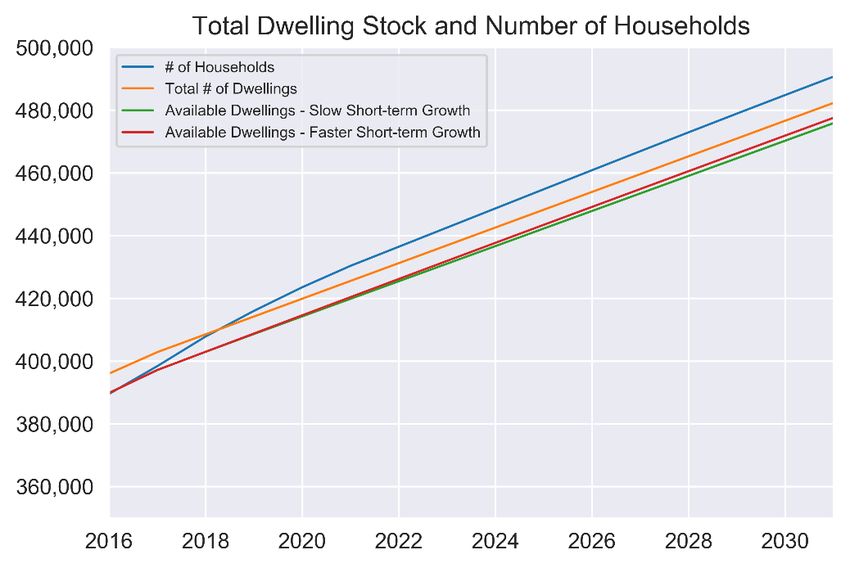
Overall, if current construction rates continue, by 2031 there will be a gap of about
18,000 dwelling units between the population trying to settle in Ottawa and the available
number of dwellings. This could increase to over 19,000 under the high growth scenario
for short-term rentals. Not included in this analysis is the concentration of these effects;
as was shown in Figure 7, short-term rentals are highly clustered in the downtown area.
This suggests that gaps will be more severe at a neighbourhood level in areas attracting
a disproportionate share of visitors.

Ottawa Rental Market Report
 35
Figure 14 - Supply/Demand Gaps

Figure 15 - Total Dwelling Stock and Number of Households

In order to meet the shortfall, annual growth will need to accelerate (as shown in Table
14, below) from the previous growth plans, particularly in regions inside the Greenbelt.

Ottawa Rental Market Report
 36
Table 14 – Growth Targets by Dwelling Type

 Dwelling Type Inside Outside Total
 Greenbelt Greenbelt
 Total Dwellings 2016 231,429 164,556 395,98
 5
 Current Trend Dwellings 2031 247,058 226,956 474,01
 4
 Growth Plan Target Dwellings 2031 270,000 210,000 480,00
 0
 Natural Growth Required Dwellings 2031 251,376 230,922 482,29
 8
 Required Annual Growth 2016 to 2031 2,571 3,030 5,601
 Change In Growth Rate To Meet Growth 247% 73% 108%
 Plan

 Change In Growth Rate To Meet Natural 128% 106% 111%
 Growth

5.3 Change in Average Monthly Rent

Since 2008, Ottawa has seen escalating rents, particularly in the last few years.
Currently, vacancy rates are near historic lows and if recent trends continue, future
demand would exceed supply, suggesting that rents will continue to rise. However,
forecasting future changes in rent is subject to many uncertainties:

• they are dependent on household incomes and local labour markets both as a driver
 of rising rents and as a constraint on their rise;
• supply is influenced by local policy through construction and development plans;
• supply is influenced by provincial policy through rent controls and tax incentives;
• both supply and demand are influenced by interest rates and tax policy; and
• consumer preferences change over time.

This forecast assumes that the high growth in rents will continue for two more years and
then begin to taper towards the inflation rate. The impact of this forecast is shown in
Table 14, which show the progression of average rents in the City of Ottawa from 2008
to 2031 for apartments by the number of bedrooms. Average rents for all apartment
sizes taken together are expected to increase by 41% in the period from 2018 to 2031,
from $1,235 to $1,744, or 2.7% per year. This is comparable to the long-term average
growth of apartment rents during the period from 2008 to 2018, which averaged 3.3%
per year.

Ottawa Rental Market Report
 37
You can also read