Education Awa Education outcomes for Māori - August 2019
←
→
Page content transcription
If your browser does not render page correctly, please read the page content below
v

    Education Awa
    Education outcomes for Māori

                            August 2019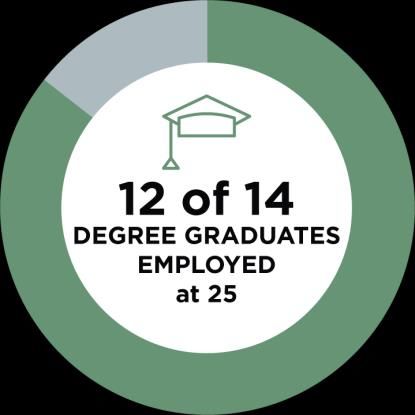
Author: Sam Green, Hillmare Schulze

All work is done, and services rendered at the request of, and for the purposes of the client only. Neither BERL nor any of its employees accepts any responsibility on any
grounds whatsoever, including negligence, to any other person.

While every effort is made by BERL to ensure that the information, opinions and forecasts provided to the client are accurate and reliable, BERL shall not be liable for any
adverse consequences of the client’s decisions made in reliance of any report provided by BERL, nor shall BERL be held to have given or implied any warranty as to whether any
report provided by BERL will assist in the performance of the client’s functions.

©BERL                                         Reference No: #5963                                   August 2019
i
ii
,

    iii
iv
Education awa

Contents
1    The awa of education ....................................................................................................................................................................... 1

2    Pressure points in the awa ............................................................................................................................................................... 2

3    Positive levers in the awa ................................................................................................................................................................. 5

4    Your income potential – if you leave school before year 13 ......................................................................................................... 9

5    End of the awa – completing tertiary education .......................................................................................................................... 11

6    Employment and income for 25 year olds .................................................................................................................................... 13

7    Model for success ........................................................................................................................................................................... 17

Appendix A         Data ................................................................................................................................................................................. 21

Appendix B         Methodology ................................................................................................................................................................... 22

Appendix C         Detailed figures ............................................................................................................................................................... 24

                                                                                                                                                                                        Contents               v
Education awa
Tables
Table 1: NCEA level 1 achievement by school type (%) ........................................................................................................................................................................................... 6
Table 2: Outcomes of Māori age 22 by school leaver qualification......................................................................................................................................................................... 9
Figures
Figure 1 Highest qualification of school leavers ...................................................................................................................................................................................................... 2
Figure 2 Qualification non-completion at age 25 by enrolment ............................................................................................................................................................................. 3
Figure 3 Education outcomes age 25 as share of population .................................................................................................................................................................................. 4
Figure 4 Achievement of school leavers that achieved MCAT assessment ............................................................................................................................................................ 7
Figure 5 Likelihood of students not attempting the MCAT assessment ................................................................................................................................................................. 8
Figure 6 Sector of employment for degree holders seven years after high school .............................................................................................................................................. 13
Figure 7 Top 8 largest sectors of employment for NC level 4 holders seven years after high school ................................................................................................................. 14
Figure 8 Average working income by qualification, age 25 ................................................................................................................................................................................... 15
Figure 9 Income by industry with a Bachelor’s degree or higher, age 25 ............................................................................................................................................................. 15
Figure 10 Income by industry with a National Certificate level 4, age 25 ............................................................................................................................................................. 16
Figure 11 Top decile of income earners by highest qualification, age 25 ............................................................................................................................................................. 17
Figure 12 Industry of employment of top earners with no qualification .............................................................................................................................................................. 18
Figure 13 Industry of employment of top earners with a Bachelor’s degree or above ....................................................................................................................................... 19
Figure 14 Income pathway for Māori in top decile of income earners ................................................................................................................................................................. 20
Contents viEducation awa
Disclaimer
detail can be found in the Privacy assessment for the Integrated Data
The results in this report are not official statistics. They have been created for
Infrastructure available from www.stats.govt.nz.
research purposes from the Integrated Data Infrastructure (IDI), managed by
Statistics New Zealand (Stats NZ). The results are based on tax data supplied by Inland Revenue to Statistics NZ
under the Tax Administration Act 1994. This tax data must be used only for
The opinions, findings, recommendations, and conclusions expressed in this
statistical purposes, and no individual information may be published or disclosed
report are those of the authors, not Statistics NZ, the Ministry of Education,
in any other form, or provided to Inland Revenue for administrative or
Inland Revenue or the Ministry of Social Development.
regulatory purposes.
Access to the anonymised data used in this study was provided by Statistics NZ
Any person who has had access to the unit record data has certified that they
under the security and confidentiality provisions of the Statistics Act 1975. Only
have been shown, have read, and have understood section 81 of the Tax
people authorised by the Statistics Act 1975 are allowed to see data about a
Administration Act 1994, which relates to secrecy. Any discussion of data
particular person, household, business, or organisation, and the results in this
limitations or weaknesses is in the context of using the IDI for statistical
report have been confidentialised to protect these groups from identification
purposes, and is not related to the data's ability to support Inland Revenue's
and to keep their data safe.
core operational requirements.
Careful consideration has been given to privacy, security, and confidentiality
issues associated with using administrative and survey data in the IDI. Further
Disclaimer viiEducation awa
1 The awa of education
Participating in the New Zealand education system is like flowing down an awa The first cohort looks at 49,500 rangatahi Māori that are in year 11 from 2008-
to a moana of success. The system is a network of streams, with some parts 2012. The final outcomes include outcomes at age 25 for all school leavers from
being crafted into canals. From year 1 to 13, the system has been designed to 2008 to 2010. In total, this group is made up of 29,900 rangatahi Māori until
focus the flow to progress students towards achieving university entrance and they are 25 years old.
then moving to tertiary education.
Like flowing down the awa, while in the main flow the journey is easy, and
continuing down the awa eventually lead students to the prescribed Importance of education in addressing equity
destinations. But, what if people divert from the main stem of the awa? Once The Māori population is both growing and youthful, and in the coming years will
outside of the traditional flow, the support systems are not there, the route is form an increasing share of the New Zealand labour force.
unclear and it is very difficult to return to the main flow of the awa.
In 2018, BERL completed a study on the income gap for Māori in New Zealand.
In New Zealand, with a diverse and ever-changing labour force, not all students Accounting for the significant differences in the age profile of Māori, they found
are needed to be in the same part of the moana, and having a wide range of an income gap of $2.6 billion per year. Perpetuation of this inequality with the
skills will always be required. Given this need, the education system needs to be growing Māori population will cause this gap to grow significantly. By 2040, this
remodelled, acknowledging that there is more than one route to success, and is projected to grow to $4.3 billion.
success looks different for different students.
This study also considered the differences in employment and education levels
100 school leavers for Māori. With low education limiting the ability for Māori to access high-skilled
This report includes data from two cohorts of school leavers. Throughout this jobs. It is evident that we need to remove the obstacles to achieving higher
report, we refer to the group as 100 representative individuals, each education, and achieving education that has relevant and quality employment
representing one percent of Māori school leavers from their respective cohort. opportunities.
1 The awa of education 1Education awa
2 Pressure points in the awa
From the 100 school leavers it is evident that a significant proportion does not
Māori more likely to leave school with no qualifications than non-Māori
follow the well-established flow of the awa. Through our research, we have
identified three significant pressure points for Māori in the education system. Māori are much more likely to leave school with no qualifications than their non-
Māori peers. For every 100 Māori school leavers 19 have no qualifications,
2.1 Pressure point 1: Not completing NCEA level 1 compared to only nine of every 100 non-Māori.
Figure 1 shows the high school attainment of school leavers for non-Māori as There are many characteristics that influence an individual’s education
well as for Māori. This is a picture of the start of the crossroads, with the NCEA decisions: many of the decisions made can depend on individual characteristics,
level 3 being the main flow. Leaving before level 3 can be the result of choosing or based on the subjects or careers that seem most enjoyable or rewarding. The
alternative education providers. decision to continue in education is closely linked with their level of achievement
in previous years.
Figure 1 Highest qualification of school leavers
Non-Māori Māori
8%
6% 9% No qualification
6% 19%
3% NCEA1
0%
19% 5% NCEA1 Endorsed
Partial level 2
5%
0% NCEA2
14% 24%
NCEA2 Endorsed
9%
Partial level 3
1%
NCEA3
11% NCEA3 Endorsed
32% 16%
12%
0% Other
2 Pressure points in the awa 2Education awa
Figure 2 Qualification non-completion at age 25 by enrolment1
While high achievement typically results in continued education, lack of
achievement can also result in barriers to further education. Achievement at
Leaving education with no qualifications
high school can restrict opportunities to participate in subjects at higher levels
while not having university entrance (UE) limits access to universities and degree 60
programmes.
Proportion with no qualification at 25 (%)
2.2 Pressure point 2: Low completion rates for
40
apprenticeships
The alternative education flows to university have a number of challenges. This
results in levels of completion varying significantly between types of education
providers. Figure 2 shows the educational outcomes of students that enrolled in 20
tertiary education in the three years after leaving school. In many cases, the
completed qualification are not from the same provider of original enrolment.
The majority of students achieve some form of tertiary qualification by the time
0
they are 25, though some flows have much lower completion rates than others.
Non-Māori
Non-Māori
Non-Māori
Non-Māori
Non-Māori
Māori
Māori
Māori
Māori
Māori
In particular, there is very low completion rates for apprenticeships.
More than half of the individuals that start an apprenticeship do not
complete University Wānaga ITP PTE Apprenticeship
More than half of the individuals that start an apprenticeship do not complete
any formal qualification as part of their apprenticeship by the time they are 25.
This is a substantial leak in the education for both Māori and non-Māori,
particularly with the current shortages in the labour market for trades people.
On the other hand, university education typically requires a minimum three-year
programme to complete a formal qualification and by age 25; 60 percent of
Māori that enrol in universities achieve a bachelor’s degree or above, and 14
percent achieve a level 4-6 qualification.
1
A more detailed figure is presented in Appendix C with completion rates and highest
qualification achieved.
2 Pressure points in the awa 3Education awa
2.3 Pressure point 3: Underrepresentation in
Bachelor’s degrees Figure 3 Education outcomes age 25 as share of population
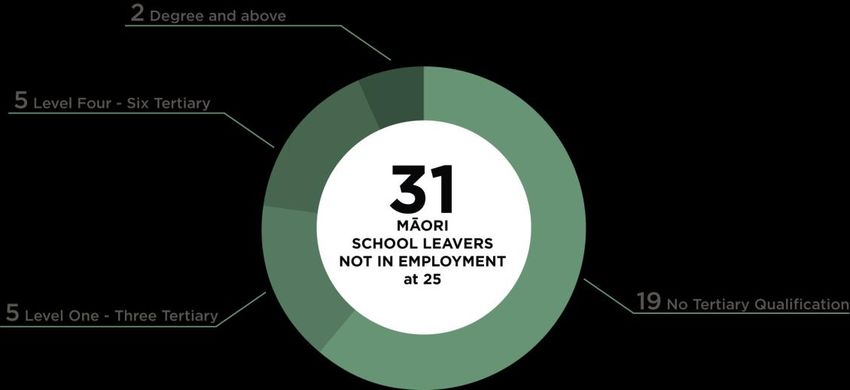
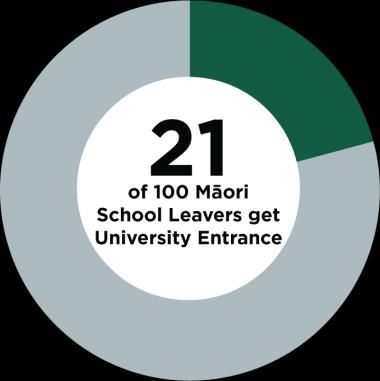
Through the various providers and subject areas, half of Māori school leavers
Tertiary qualification outcomes
achieve a tertiary qualification. Māori are underrepresented with Bachelor’s 40
degrees, with just 14 of every 100 Māori school leavers achieving a Bachelor’s
degree by the time they are 25 years old. Māori are highly represented in
National Certificates, with 12 of every 100 school leavers achieving a National
Proportion of population (%)
30
Certificate level 4 and six of every 100 achieving a National Certificate level 1-3.
An additional 12 students receive a level 1 to 3 certificate from a tertiary
education organisation or other qualification. A significant proportion also 20
achieve a certificate from a tertiary education organisation.
10
0
Bachelor or Nat Cert 4 Nat Cert 1-3 Diploma Certificate Other
above Māori Non-Māori
2 Pressure points in the awa 4Education awa
3 Positive levers in the awa
As mentioned, from the 100 school leavers it is evident that a significant These findings reinforce the importance of not only being enrolled in school, but
proportion does not follow the well-established currents in the awa. Through also being engaged and seeing value in schooling. Relatively high rates of non-
our research we have identified specific levers to support Māori in the education attendance significantly reduce the likelihood of achieving NCEA level 1, which
system. then results in restricted future employment opportunities.
3.1 Lever 1: Going to and staying in school Primary schooling forms the foundation for the remainder of the
education system.
“Every day a student is not at school is a day they are not learning” 2
From age five to 11, students learn the fundamental principles of literacy and
The Ministry of Education has an initiative called Every Day Matters to assist numeracy while also forming an opinion on which subject areas they enjoy.
schools to turn attendance data into insights. It aims to assist schools to develop
an attendance strategy. Since 2011, the Ministry has invited all state, state- While there is no national level data available to measure achievement at
integrated and partnership schools to submit their term 2 attendance data. In primary school, there is substantial evidence that tamariki who do not learn to
summary, some of the key findings of this data is that: read, write and communicate well at primary school level have a range of
disadvantages that continue far into their adult lives. Without effective language
There is a positive relationship between students regularly attending and communication skills, very young tamariki may struggle to grasp foundation
school in Year 10 and Year 11, and the probability of achieving NCEA level literacy and numeracy skills. Later in schooling, difficulties in literacy and
1. numeracy are linked to other compounding factors including truancy, exclusion,
Year 6 students have the highest level of regular school attendance. While alcohol or drug abuse and increased health risks. These tamariki are more likely
Year 13 students have the lowest. to leave school early, be unemployed or in low-skilled jobs, have poorer
emotional and physical health, have higher rates of poverty, and are more likely
Māori students have the lowest levels of regular school attendance. Asian
to end up in prison.
students have the highest.
This is irrespective of the innate potential of the child and represents a loss to
A higher proportion of primary and intermediate school students attend
the individual and to society, as each person affected is unable to reach their
regularly than students at secondary school.
potential and contribute fully. As a component of basic education and a
Unjustified absences increased noticeably in the middle and end of Term 2. foundation for lifelong learning, literacy is the key to enhancing human
capabilities and enabling full participation in social and civic life. Literacy and
2 Ministry of Education. (2016). Attendance in New Zealand Schools 2015. Ministry of Education:
Wellington.
3 Positive levers in the awa 5Education awa
numeracy carry extensive benefits not only for individuals but also for whānau, 3.3 Lever 3: Continuous Māori medium education
community and wider society.3
In New Zealand, schooling is available in both English and te reo Māori. As
Throughout the education system, continuity is an important factor in English is the most widely spoken language in New Zealand, many of these
maintaining engagement in education. Frequently changing school, having to students become bilingual.
make new friends and other disruptions can make learning more difficult. When
changing schools also requires the primary language of the education to also All transitions in the education system are challenging for students and
change, this creates an additional barrier to learning. transitioning from Māori medium education to English-speaking high schools is
particularly challenging. Compared with all Māori, students that complete their
The flows from primary school to high school can be a stressful transition for whole school journey in Māori medium schooling have higher achievement
students, though compulsory enrolment results in the overwhelming majority levels. Only 22 percent of Māori in Māori medium schooling do not achieve
of students continuing in the education system. One challenge is maintaining NCEA level 1, compared with 30 percent of Māori in English medium schooling.
engagement with the education system, though this is difficult to measure until
NCEA level 1. Table 1: NCEA level 1 achievement by school type (%)
Māori medium primary school
NCEA 1 Achievement All Māori
3.2 Lever 2: School ‘success’ keeps students in the MM high school non-MM high school
main flow Excellence 5 9 5
At high school, there is a focus on achieving academic success, and progressing Merit 21 34 21
students through the system. After achieving each year the default flow is to Achieved 45 35 37
progress to the next year, resulting in a significant majority of students that pass
their subjects continuing in schooling. This results in success being measured Not Achieved 30 22 37
through NCEA achievement, students that meet this success measure then
The inverse is true for students that participated in Māori medium primary
continue to strive for and achieve these same measures in subsequent years.
schools, and completed NCEA level 1 in an English medium high school; 37
From 100 Māori school leavers, none 4 achieved NCEA level 1 or NCEA level 2
percent of this group did not achieve NCEA level 1, though the rates of Merit
with a merit or excellence endorsement and did not continue onto the next
and Excellence endorsement are comparable to the overall Māori average.
NCEA level.
After completing schooling, the enrolment in university education is comparable
For both Māori and non-Māori, the largest group of individuals that leave before
for students that achieved UE either through Māori medium or English medium
year 13, have no qualification, or have NCEA level 2 with no endorsement.
schooling.
3
Early Literacy and Numeracy Matters: Enriching Literacy and Numeracy Experiences in Early 4
less than 0.5 percent of students
Childhood. French, G (2012). Dublin: Barnardos
3 Positive levers in the awa 6Education awa
3.4 Lever 4: Completing school is not the only flow to achievement as a pre-requisite for enrolment in mathematics in NCEA level 2 or
other subjects requiring algebra including physics.
tertiary education
Students that achieve the MCAT have very positive educational outcomes. Two
Māori are more likely than non-Māori to engage in education outside of the
thirds of Māori students that achieve the MCAT leave school with NCEA level 3,
traditional school system while still school age. During year 12, one-in-four
and only six percent leave before achieving NCEA level 2. There is also a strong
Māori choose education from tertiary providers, rather than continuing through
link with university entrance. 56 percent of Māori MCAT achievers achieve
the school system. Approximately one-in-five non-Māori receive education from
university entrance, almost three times the Māori average.
tertiary providers during year 12.
Figure 4 Achievement of school leavers that achieved MCAT assessment
This shows that many Māori choose an alternative education flow, and the
decision to leave school earlier is part of this education decision. For the quarter
School achievement if MCAT achieved
of Māori that leave school before year 13 for tertiary education, the most
common tertiary providers are polytechnics followed by private training
establishments (PTEs). Enrolling into apprenticeships while still high school age No qual
1%
2%0%3%
is uncommon. NCEA1
26% 12%
NCEA1 Endorsed
This relationship inverts once students have completed school age; three years
1% Partial level 2
after year 11, students that have stayed in schooling will have completed school,
and 65 percent of non-Māori and 50 percent of Māori are engaged in tertiary NCEA2
14%
education. NCEA2 Endorsed
Partial level 3
This relationship is due to a majority of students that complete high school
NCEA3
transitioning straight to university education. Of Māori that achieve UE, 60
NCEA3 Endorsed
percent enrol in university in the first year after completing year 13. From the 41%
100 Māori school leavers, this group is 12 students.
3.5 Lever 5: Importance of algebra
School subject decisions and achievement in certain subjects can significantly
limit options later in the awa. One of the critical subjects in high school is NCEA
level 1 algebra. The Mathematics Common Assessment Task (MCAT) is the
standard for assessing algebra skills for NCEA level 1 students and is widely
feared as one of the most challenging exams. Some schools use MCAT
3 Positive levers in the awa 7Education awa
While the MCAT often results in very positive outcomes, the assessment itself is Figure 5 Likelihood of students not attempting the MCAT assessment
a substantial challenge, and more than half of the Māori do not attempt the
assessment. Liklihood of not sitting MCAT
There are a number of reasons individuals may not attempt the MCAT. At large
schools, mathematics is often streamed, with advanced streams often sitting
assessments years in advance and some streams being excluded from Maori
assessments. In some schools, individuals that are not expected to achieve the
standard may also be directed, or choose not to attempt the assessment.
Non-Maori
0 10 20 30 40 50 60 70
Liklihood %
3 Positive levers in the awa 8Education awa
4 Your income potential – if you leave school before year 13
While the default flow for high achieving students is continuing through the Leaving High school with no qualifications is not the end of education for many
school system, many students decide to leave school before completing year 13, students. Approximately one third leave school to enrol in tertiary education or
either to pursue work or other education. On average, the lower the commence apprenticeships.
qualification achieved from school, the worse outcomes for individuals.
Income prospects
The relationship between higher qualifications and better income and
employment outcomes is clear. Having higher qualifications when leaving school On average, income levels for working Māori that left school with no
is often related to better employment outcomes, lower benefit receipt, and qualifications are $20,000 per year when they are 22 years old. Currently in New
higher incomes. Of Māori that leave school with no qualifications (19 from 100), Zealand, the living wage is defined as “the income necessary to provide workers
58 percent (11) are on some form of benefit while 43 percent (8) are in some and their families with the basic necessities of life. A Living Wage will enable
form of paid employment. workers to live with dignity and to participate as active citizens in society”.
Table 2: Outcomes of Māori age 22 by school leaver qualification The living wage is currently estimated to be $20.55 per hour, which is
approximately $40,000 per year in full time work. This means on average, school
Highest school qual Employed % Annual income ($) Work benefit % Other benefit %
leavers with no qualifications have only half the required income to “live with
No qualification 43 20,300 38 20
dignity and to participate as active citizens in society”. Only five percent of Māori
NCEA 1 52 25,100 30 12
that left school with no qualifications earned $40,000 in the year they turned 22
NCEA 2 55 27,100 21 6 years old, and three quarters of these individuals participated in further
NCEA 3 58 20,300 16 3 education or training after leaving school.
4.1.1 Leaving school with no NCEA achievement 4.1.2 Leaving school with NCEA level 1
Just under one-in-five Māori leave school without completing NCEA level 1. This Leaving school after achieving NCEA level 1 can occur for a number of reasons.
compares to one-in-ten for non-Māori. For both Māori and non-Māori, leaving Students typically start NCEA level 1 before turning 16, while still in compulsory
school with no qualifications is associated with the highest level of benefit education. For students that have already chosen a flow from school, through
receipt, the lowest likelihood of further education enrolment and relatively low apprenticeships, tertiary education or employment, the end of compulsory
employment levels. schooling will then result in them leaving after completing NCEA level 1. From
the overall cohort, this remains a fairly small proportion of school leavers.
Of Māori that leave school with no qualifications, 40 percent are on a work-
related benefit by time they are 20 years old. An additional 20 percent are on
benefits related to their health or family situation.
4 Your income potential – if you leave school before year 13 9Education awa
Income prospects 4.1.4 Leaving school with NCEA level 3
Income prospects for individuals that leave school with NCEA level 1 are much Completing schooling with NCEA level 3 provides a significant component of
higher than individuals that leave school with no qualifications. At age 22, achieving UE. If students take approved subjects, achieving NCEA level 3 will
working Māori with NCEA level 1 achieve an average annual income of 24 usually meet the requirements for UE.
percent higher ($4,800) than working Māori with no qualifications.
Beneficiary receipt
4.1.3 Leaving school with NCEA level 2
Achieving NCEA level 3 has the lowest benefit rate of any school leaving group.
For both Māori and non-Māori, NCEA level 2 is a level with a significant No more than one in five Māori, and one in ten non-Māori from this group are
proportion of school leavers. 28 percent of Māori and 25 percent of non-Māori on any benefit in a year from leaving school to 22 years old. The rates of family
leave school after achieving NCEA level 2. NCEA level 2 is also a requirement for and health benefits are also very low, with less than three percent on family
a number of apprenticeships and tertiary programmes. benefits, and one percent on health benefits.
A very small proportion of NCEA Level 2 achievers will enrol directly in
Tertiary education
University. While universities usually require UE, some students are allowed
discretionary entrance though this usually requires the student to achieve More than two thirds of Māori and three fifths of non-Māori that achieve NCEA
exceptional results in NCEA level 2. level 3 enrol in tertiary education or training after leaving school. This is
significantly higher than any other school level. Less than half of Māori with each
Tertiary education of NCEA 1 and 2 enrol in tertiary education after school.
Leaving school with NCEA level 2 is an entry requirement for a number of tertiary
Income prospects
study options, including some apprenticeships. For students that leave school
with NCEA level 2, just under half (48 percent) of Māori are enrolled in tertiary By age 22, Māori with NCEA level 3 have the lowest average working income,
education in the year that they would be in year 13 if they stayed in the school equal to students with no qualifications. This is due to a very large proportion of
system. this group being in tertiary education, resulting in many students working part
time.
Having NCEA level 3 also results in much lower unemployment, and higher
employment levels, with 60 percent of Māori in some form of employment.
4 Your income potential – if you leave school before year 13 10Education awa
5 End of the awa – completing tertiary education
5.1 Background 5.2 Tertiary enrolment
Individuals seek higher education for a wide range of reasons. Increasing
Enrolment in tertiary education is the most common post-school activity for our
capability, increased employment opportunities and higher future incomes are
cohort, though a large proportion also have some form of employment,
common reasons for pursuing tertiary educations. Having higher education
including as part of their education and training. The education decisions of
levels also benefits the New Zealand economy. This provides the main rationale
individuals are also related to their overall employment decisions.
for the Government to invest significant resources into tertiary education and
training. 5.2.1 More than one way to achieve UE
The Treasury has indicated in their publication Holding On and Letting Go: While high school achievement is the usual flow to UE, there are alternative
Opportunities and Challenges for New Zealand’s economic performance that the flows through a number of tertiary providers that can also provide access to
returns to the New Zealand economy from education vary widely by level, university education or degree programmes. This flow is relatively small group,
subject, provider and student group.5 These returns also appear to be low by with 12 percent of Māori and non-Māori students that achieve UE having left
international standards. To improve this, the Treasury has argued that going school for tertiary education before year 13. After leaving school, night schools,
forward the tertiary education system must be equipped to invest in “high-value and some tertiary providers can provide the requirements to attain UE outside
areas.” of the traditional flow.
To determine what these high-value areas are it is important to better
understand graduate outcomes and what employers want in terms of skills, 5.2.2 Tertiary education providers
knowledge and attributes. The Government has therefore signalled that it Māori enrol in a more broad range of tertiary providers than non-Māori. For
wants a better connection between tertiary education and employers to ensure non-Māori in New Zealand, the significant majority of tertiary education is
positive graduate outcomes, a good return on investment, and that people are provided through universities while Māori are relatively more represented in
work ready. polytechnics; universities, Private Training Establishments (PTEs) and
As a result of this, a series of research projects have been undertaken by the apprenticeships all have comparable enrolment rates.
Tertiary Education Commission, the Ministry of Education, Statistics New After completing school, half of Māori engage in tertiary education. Enrolment
Zealand, the Ministry of Business Innovation and Employment, and Careers New levels vary between tertiary providers from 31 percent in polytechnics to seven
Zealand on graduate outcomes. percent in wānanga. This information is shown on a yearly basis in Appendix C.
5
The Treasury. (2014). Holding On and Letting Go: Opportunities and challenges for New
Zealand’s economic performance. The Treasury: Wellington.
5 End of the awa – completing tertiary education 11Education awa
Once in tertiary education, students have the opportunity to change their minds 22 percent of Māori that enrol in university education have no tertiary
about their study options, either through changing subject areas or changing to qualification by 25 years old.
different providers. Often any achievement from one provider will be able to be
cross-credited to another provider, even if the fields of study are not closely 5.3.1 Apprenticeships, trades training and level 4 qualifications
related. Apprenticeships are a practical opportunity for individuals to learn on-the-job,
while earning an income. With reduced need for any student loans, this can be
5.3 Tertiary enrolment and achievement a financially rewarding flow to the labour force. On average, some existing
One common measure of student success is the completion of qualifications research shows that apprenticeships have similar lifetime outcomes to degrees.
and/or the progression in to higher levels of study. This requires that individuals complete their training. Leaving a trade early,
particularly for labouring jobs, can result in a short-term increase in income, but
Qualifications are a signal – they are used by employers to determine what level
can significantly restrict the potential for income to continue to grow. Increasing
of skill, experience or knowledge a person may have. They are also used as a
this completion rate, through improving support for apprentices to complete
signal in terms of salary.
their apprenticeship, and perhaps new apprenticeship formats, is essential for
In regulated industries or sectors, a qualification is also used as a requirement improving the skills of the New Zealand labour force while filling shortages in
for entry, showing that a person has passed the minimum requirements for qualified tradespeople.
registration and may be a suitable candidate for this profession. This is a
requirement for accountants, lawyers, engineers, medical professionals, 5.3.2 Tertiary providers and degrees
builders, and many other areas of employment. New Zealand has eight universities as well as a range of polytechnics that
From the 100 Māori school leavers, 50 will achieve a tertiary qualification by age provide degrees. On average, the population that receive a degree have the
25. This is slightly lower than non-Māori leavers, where 58 will achieve a highest average income in this cohort. One of the largest hurdles for individuals
qualification. The largest difference in qualifications is the level of qualifications to get a degree is achieving UE. The rate of degree completions at universities is
achieved, only 13 of every 100 Māori leavers achieve a bachelor’s degree very high, and much more comparable between Māori and non-Māori than
compared with 33 non-Māori. This outcome is highly related to the levels of achieving UE.
enrolment in tertiary education. From 20 percent of Māori that achieve UE,
approximately 75 percent enrol in some form of tertiary education. In total, only
5 End of the awa – completing tertiary education 12Education awa
6 Employment and income for 25 year olds
6.1 Employment of degree holders
The comparability of income for individuals that have at least a degree is Figure 6 Sector of employment for degree holders seven years after high school
particularly interesting when considering the sectors of employment for Māori
and non-Māori that achieve these qualifications.
shows the industries of employment, and the income levels of Māori and non-
Industry of employment with Bachelor's degree
Māori with at least a Bachelor’s degree. 35
The industry of employment for Māori and non-Māori show some substantial
30
differences. Māori are much more likely to go into the education and training
and the health care and social services sectors, while non-Māori are more likely
25
% of workers with degree
to be employed in the professional, scientific and technical services sector.
20
15
10
5
0
Education and Health Care Professional, Public Retail Trade Financial and Other
Training and Social Scientific and Administration Insurance
Services Technical and Safety Services
Services
Māori Non-Māori
6 Employment and income for 25 year olds 13Education awa
6.2 Employment with National Certificate level 4 Figure 7 Top 8 largest sectors of employment for NC level 4 holders seven years
after high school
While degrees have the highest average annual earnings of the major
qualification types, degrees are not the only flows to success. The high debt
often required to complete a degree and the years of limited earning ability Industry of employment with National Certificate level 4
15
while studying can result in no different lifetime earning outcomes when
compared with apprenticeships. Māori are relatively highly represented in
% of workers with National Certificate level 4
apprenticeships, resulting in 12 percent of Māori achieving level 4 National
Certificates, compared with 8 percent for non-Māori.
10
The types of apprenticeships are also interesting. A quarter of non-Māori
apprentices and just under a third of Māori apprentices complete
apprenticeships within food and hospitality sector. Māori are particularly
highly represented in apprenticeships in the fields of agriculture and
5
environmental work, accounting for almost 20 percent of Māori apprentices,
compared with 11 percent of non-Māori apprentices.
Employment with a National Certificate level 4 also significantly reduces the
differences in the income gaps between Māori and non-Māori as seen in Figure
0
7. Construction and manufacturing employ one-in-five of the working Accommodation and Construction Retail Trade Manufacturing Public Administration Administrative and
Food Services and Safety Support Services
population with level 4 qualifications and have comparable income levels for Māori Non-Māori
Māori and non-Māori.
33 percent of Māori and 35 percent of non-Māori work in an industry not shown
in Figure 7, with 5 percent of Māori workers or less in each industry.
6 Employment and income for 25 year olds 14Education awa
6.3 Income outcomes 6.4 Employment with qualifications
The end of the education pipeline is the start of an individual’s career. After Achieving qualifications and then obtaining a job in a related field has much
starting a career, some individuals retrain upskill and change occupations higher earnings prospects. This also significantly reduces the gap between Māori
though for many this will be the platform that they build their career on. By age and non-Māori. Students that achieve a bachelor’s degree and are employed as
25, there are a number of success opportunities. Having higher qualifications is professionals or in the health sector earn an average of 50 percent more than
associated with positive employment outcomes. Seven years after leaving high those in the retail industry as seen in Figure 9.
school, the income of individuals that have achieved a degree are higher than
Figure 9 Income by industry with a Bachelor’s degree or higher, age 25
for individuals that have any other qualification or no qualification. Achieving a
degree also results in a significant decrease in the income gap between Māori Income with Bachelor's degree or higher
and non-Māori as shown in Figure 8. 60,000
Figure 8 Average working income by qualification, age 25
Average working income by qualification
Annual income ($)
40,000
50,000
40,000
20,000
Annual income ($)
30,000
0
20,000 Education and Health Care and Professional, Public Retail Trade Financial and
Training Social Services Scientific and Administration Insurance Services
Technical Services and Safety
10,000 Māori Non-Māori
0
Degree or above National certificate Diploma Nat cert 1-3 Certificate from TEO
lvl 4
Māori Non-Māori
6 Employment and income for 25 year olds 15Education awa
The income levels with a National Certificate level 4 is also dependent on the
occupation of employment after completing the qualification. The
manufacturing and construction industries, both of which have a high
concentration of level 4 qualifications, have substantially higher incomes than
individuals working in the tourism or retail related industries as seen in Figure
10.
Figure 10 Income by industry with a National Certificate level 4, age 25
Income with National Certificate Lvl 4
60,000
Annual income ($)
40,000
20,000
0
Construction Manufacturing Accomodation and Retail
Māori Non-Māori Food services
6 Employment and income for 25 year olds 16Education awa
7 Model for success Figure 11 Top decile of income earners by highest qualification, age 25
Chance of being high earner
Being sucessful in terms of employment can be the result of a wide range of 15
characteristics. No single pipeline is a sure set path to high incomes, though all
high earners have a pathway to achieve their destination. Of the highest income
% of qualification in top 10% of earners
earners, the largest group are those that achieve high qualifications, though
other pathways can also be effective. 10
By looking at the top ten percent of earners at 25 years old, we can work
backwards and explore the education and employment decisions leading to this
point. The results of this section show that there is no one pathway to success 5
in the labour market.
When considering the cumulatiutive earnings to age 25 there are also significant
benefits for individuals completing apprenticeships. Of the highest earners, 0
Post-Graduate Bachelor National Cert Lvl 4 Other No Quals
university students earned substantially less income than their peers doing
Māori Non-Māori
engineering apprenticeships, or other forms of education and training.
As shown in Figure 11, having higher qualifications results in having a higher
liklihood of being in the top 10 percent of earners.
7 Model for success 17Education awa
7.1 With no tertiary education Figure 12 Industry of employment of top earners with no qualification
Relatively large portions of individuals that achieve the top ten percent of High income earners with no tertiary qualification
income have no tertiary qualifications. However, it is important to note that 45
these individuals are a very small portion of the overall population with no
Share of earners with no qualification (%)
qualifications – just six percent of our cohort with no qualifications achieve the
top 10 percent of high incomes. Of the highest income earners with no 30
qualifications, the largest groups are in the primary and manufacturing
industries, together making up half of the top earners with no qualifications as
15
seen in Figure 12. When considering these numbers, it is important to consider
the values relative to the overall totals. For both Māori and non-Māori, a
significant proportion of individuals have no qualifications, and the individuals 0
that achieve high incomes are a significant minority, as having no qualifications Construction Manufacturing Primary Transport, Postal Public
and Warehousing Administration and
Other
have relatively low average incomes in general. Safety
Māori Non-Māori
7 Model for success 18Education awa
7.2 With Bachelors degree or above Figure 13 Industry of employment of top earners with a Bachelor’s degree or
above
Of the top decile of income earners in the cohort, the largest group is individuals
with a bachelor’s degree or higher. This group is the most educated, and, on High income earners with Bachelor's or above
45
average, they have the most positive outcomes. With all qualifications, the
Share of earners with Bachelor's or above (%)
qualification itself is often the signal required for high-skill employment. This
makes attainment of a high-skill job after graduating the main hurdle for the
30
graduated.
The industries with the highest population in the top earning decile are health
and social services, professionals and other industries with typically high-skill 15
employment opportunities as seen in Figure 13. This is in line with the overall
average income levels of individuals with degrees as shown in Figure 13.
0
Health and Social Professionals Financial and Public Admin and Education and Other
Insuance Safety Training
Māori Non-Māori
7 Model for success 19Education awa
7.3 Engineering apprenticeships Figure 14 Income pathway for Māori in top decile of income earners
Apprenticeships are also another flow of higher education and training that Income pathway for top earners
provides significant income potential, while also earning an income. 80,000
Apprenticeships in Engineering have a particularly high representation in the
highest income earner group.
60,000
Almost a quarter of Māori (22 percent) and almost a fifth of non-Māori (17
Annual Income ($)
percent) in the top income decile completed engineering apprenticeships. While
40,000
having a high income after completing their training, they also earn substantially
more than the other top earners in the years leading up to 25 years old.
20,000
The average income of earners in the top income decile is approximately
$75,000 as seen in Figure 14. For the engineering apprentices, income levels
increase smoothly from leaving high school until they are 25 years old. The 0
university pathway typically only allows for part-time employment outside of -2 -1 0 1 2 3 4 5 6 7
Years from Year 13
holiday periods. This results in the average income being just $10,000 per year Engineer Degree Average
until they graduate. After completing qualifications, students then need to find
full-time employment and the income levels increase sharply.
7 Model for success 20Education awa
Appendix A Data Inland Revenue data
The data used for this study is the StatsNZ Integrated Data Infrastructure (IDI). The main financial information is obtained from Inland Revenue. These data are
The IDI is a very detailed database linking individual data across a number of used for measuring annual family income, and the outcomes of students
Government agencies and over a number of years. Every person in New Zealand The income in a given year for students is in calendar years rather than financial
is assigned a unique identifier, which can be used to link data from the census years as individuals typically finish school at the end of the calendar year. Upon
to their actual employment information through Inland Revenue and completing high school, leavers range from 17 and a half to 18 and a half years
educational outcomes from the Ministry of Education. old.
Census data Ministry of Social Development data
The data for this analysis is limited to individuals that were present at the 2013 The MSD data includes the total days on a benefit in any given year.
New Zealand Census. The Census forms the basis of the demographic
information used, including sex, ethnicity and age. Our results include whether an individual received a certain type of benefit at
any point in a financial year.
Māori is defined as any individual that self-identified as Māori in the 2013
Census, as any one of their ethnic groups. The types of benefit have been classified into three types of benefit, health,
work and family based on the following table:
Ministry of Education data
Ministry of Social Development data
The Ministry of Education (MoE) data is the primary data source.
The MSD data includes the total days on a benefit in any given year.
Tertiary data
Our results include whether an individual received a certain type of benefit at
The tertiary education data is based on the tertiary education tables. A student any point in a financial year.
is considered enrolled if they enrol with any tertiary provider in that calendar
year. There are some cases where students are enrolled in more than one The types of benefit have been classified into three types of benefit, health,
institution in the year and will be counted as in both groups. work and family based on the following table:
Secondary school data Family Health Work
The secondary school data is primary sourced from the school leaver data. These Widow's Benefit Supported living payment Jobseeker support
data include the highest qualification attained, the reason for leaving. Students Sole parent support Invalids benefit Jobseeker student hardship
that left to go overseas are dropped and not included in the figures and Youth payment young parent Sickness benefits Jobseeker related
statistics. Emergency benefit
Data 21Education awa
Appendix B Methodology The major limiting characteristics include university entrance, having numeracy
and literacy skills, and achieving NCEA levels 1 to 3.
This report uses data from the Stats NZ Integrated Data Infrastructure (IDI) to
The cohort for this transition selects individuals based on when they were in
build a picture of the education pipeline. The journey through the education
year 11 at school. Where the school enrolment did not have an enrolled year
system.
indicator, their age was used based on birth date from July to June. Students in
Due to data limitations, it is not possible to track a single group of individuals year 11 from 2008 to 2012 were included in this cohort.
from primary school through to their career. To overcome this data limitation,
we have divided the education pipeline into three sections, which can be Transition 3 - Post School education and employment
combined to tell a picture of the full pipeline. Through the education system,
into work
there are a wide range of factors that affect an individual’s ability to achieve
their potential. This report considers the effect of some of these factors on Post-school education and employment decisions also make a significant impact
individuals at that time period, to generate evidence for the whole education on long-term employment outcomes. The skills, qualifications and work
pipeline. experience obtained by the time an individual is 25 years old.
The main points being considered in this report are from primary school to high The cohort for this transition is based on the time when individuals completed
school, from high school to tertiary education or work, and tertiary education school. At the end of year 13, students are aged from 17 and a half years old to
into work. 18 and a half years old. We select students that are in this age range from 2008
to 2010, and track the cohort to the end of the 2018 financial year.
Transition 1 - Primary School to High School The main limitation to the data is the amount of consecutive years for tracking
The transition from primary school into high school is a significant challenge for an individual. The MoE data for primary and high schools is only accurate from
students. There are substantial challenges that arise when students move 2008 onwards. This limits the outcomes to be a maximum of nine subsequent
between schools, in particular when students transition from Māori medium calendar years. To increase the population size, and achieve more specific
schooling to English medium schooling. outcomes, years can be combined, though this reduces the number of years to
track outcomes. Due to this limitation, we measure outcomes for three cohorts.
Transition 2 - High School into work To maximise the number of observations for each transition, the cohort is made
up of the total population of the school year, which is then reduced based on
After completing year 11 at high school, students have a wide range of options specific characteristics to compare outcomes based on certain characteristics.
for what they will do in the subsequent years. With no more compulsory
schooling, students can seek employment, continue education in or outside of Who are the people that are part of the cohorts?
their high school or engage in neither employment nor education. While there How have we selected these people
is a wide range of possibilities, these can be significantly limited based on
How do we follow them
educational achievement and participation.
Methodology 22Education awa
What information is available to us on these people.
What are the limitations of using this data
Horizon
What do we not know, and therefore what assumptions are we making
How robust is the IDI data compared to other data sources, or methods of
data collection such as sample surveys.
Outcomes measured
Qualifications
While there are significant differences in averages, some Māori have very
positive outcomes. One observation from the data includes the comparison of
outcomes for Māori with a bachelor’s degree. Once limiting the population to
individuals with at least a bachelor’s degree, the difference between Māori and
non-Māori disappears.
While this is a positive observation, non-Māori are much more likely to have a
bachelor’s degree. Around a third of the study population have a degree,
compared with about 15 percent for Māori.
Industry training and apprenticeships
Another form of building capability and lifting employment outcomes is through
learning trades. There are a number of benefits of trades, including the lack of
student debt, earning an income while gaining experience. For Māori that
completed an apprenticeship, or on-the-job training, there are also very similar
income levels once these individuals are 25 years old.
Methodology 23Education awa
Appendix C Detailed figures
Highest qualification by enrolment
80%
60%
40%
20%
0%
Non-Māori Māori Non-Māori Māori Non-Māori Māori Non-Māori Māori Non-Māori Māori
University Wānaga ITP PTE Apprenticeship
Bachelor's or above Level 4-6 Level 1-3 No Qualification
Detailed figures 24Education awa
Māori enrolment in tertiary education and training
20%
15%
Proportion enrolled
10%
5%
0%
0 1 2 3 4 5 6 7
Years from year 11
PTE ITP University Wānanga Apprentice
Detailed figures 25You can also read