COVID-19 mortality rate in nine high-income metropolitan regions
←
→
Page content transcription
If your browser does not render page correctly, please read the page content below
Acta Biomed 2020; Vol. 91, Supplement 9: 7-18   DOI: 10.23750/abm.v91i9-S.10134                                        © Mattioli 1885

                                                   Original article

     COVID-19 mortality rate in nine high-income
     metropolitan regions
     Carlo Signorelli1, Anna Odone1,2, Vincenza Gianfredi1,3, Eleonora Bossi1, Daria Bucci1,
     Aurea Oradini-Alacreu1, Beatrice Frascella1, Michele Capraro1, Federica Chiappa1,
     Lorenzo Blandi4, Fabio Ciceri2
     1
      Scuola di Specializzazione in Igiene e Medicina Preventiva, Università Vita-Salute San Raffaele, Milano; 2 IRCCS Ospedale
     San Raffaele, Milano; 3 CAPHRI Care and Public Health Research Institute, Maastricht University, The Netherlands; 4 IRCCS
     Policlinico San Donato, Scuola di Specializzazione in Igiene e Medicina Preventiva, Università di Pavia

     Abstract. We analyzed the spread of the COVID-19 epidemic in 9 metropolitan regions of the world with
     similar socio-demographic characteristics, daytime commuting population and business activities: the New
     York State, Bruxelles-Capital, the Community of Madrid, Catalonia, the Île-de-France Region, the Greater
     London county, Stockholms län, Hovedstaden (Copenhagen) and the Lombardy Region. The Lombardy
     region reported the highest COVID-19 crude mortality rate (141.0 x 100,000) 70-days after the onset of the
     epidemic, followed by the Community of Madrid (132.8 x 100,000) New York State (120.7 x 100,000). The
     large variation in COVID-19 mortality and case-fatality rates for COVID-19 in different age strata suggested
     a more accurate analysis and interpretation of the epidemic dynamics after standardization of the rates by age.
     The share of elder populations (>70 years) over total population varies widely in the considered study settings,
     ranging from 6.9% in Catalonia to 17.0% in Lombardy. When taking age distribution into consideration the
     highest standardized mortality rate was observed in the State of New York (257.9 x 100,000); with figures in
     most of the European regions concentrated between 123.3 x 100,000 in Greater London and 177.7 x 100,000
     in Bruxelles-Capital, lower in French and Danish regions. We also report and critical appraise, when available,
     COVID-19 mortality figures in capital cities, nursing homes, as well as excess mortality at country level. Our
     data raise awareness on the need for a more in-depth epidemiological analysis of the current COVID-19 pub-
     lic health emergency that further explores COVID-19 mortality determinants associated with health services
     delivery, community-level healthcare, testing approaches and characteristics of surveillance systems, including
     classification of COVID-19 deaths. (www.actabiomedica.it)

     Key words: COVID-19, Mortality, Metropolitan regions, Elderly population

Introduction                                                                    Containment measures have evolved over time: in
                                                                          addition to quarantine, health authorities have under-
     The COVID-19 pandemic had major impacts in                           taken limitations of mobility (2), lockdown measures
urban settings, (1), including in London, Paris, New                      (3), have established “red zones” (4), contact tracing (1),
York, Madrid, Bruxelles and Milan, among others. All                      home fiduciary isolation (5), supported by advances in
these metropolitan areas share similar characteristics                    technology (6), and better risk communication (7-9).
and well-established commercial exchanges with Chi-                       These non-pharmacological preventive measures have
na, where SARS-CoV-2 transmission started between                         played a crucial role, also considering the current lack
the end of year 2019 and the beginning of 2020.                           of effective drugs and vaccines for COVID-19 (10, 11).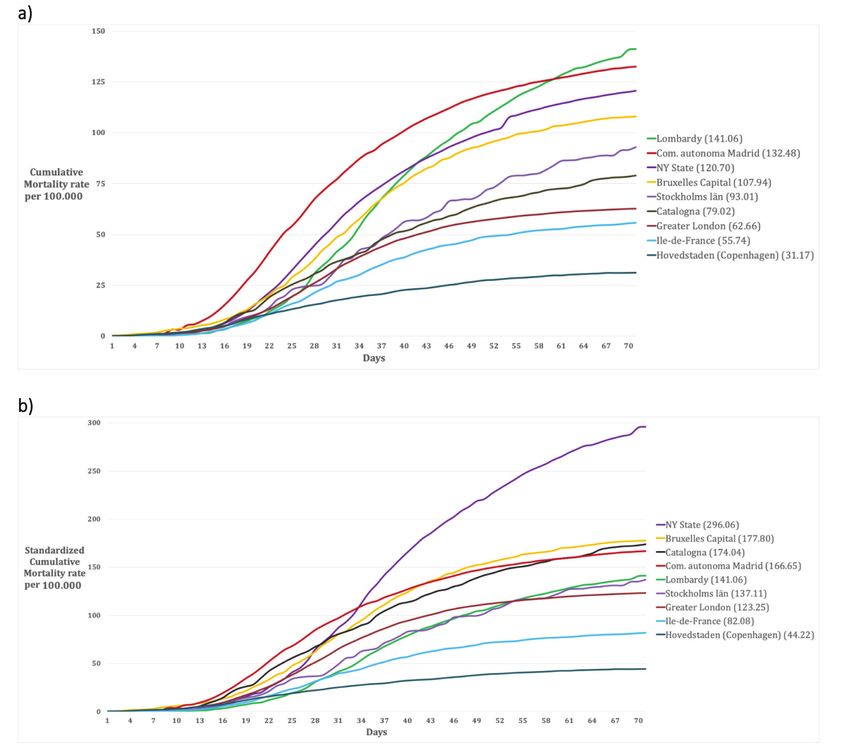
8                                                                                 C. Signorelli, A. Odone, V. Gianfredi, et al.

     In a previous preliminary analysis (4) we com-        culated mortality rates standardized by age using the
pared crude COVID-19 mortality rates 30 days after         indirect method and the age-specific mortality rates of
the onset of the epidemic, exploring different epidemic    Lombardy Region as reference population.
dynamics, health systems’ response and healthcare de-
livery management in different settings. The current
study, developed around the same theoretical frame-        Results
work(12), builds on previous findings and analyzes
nine metropolitan areas, with the aim of further assess-        First, we describe the characteristics of the nine
ing the spread of COVID-19 and its mortality, tak-         metropolitan areas in terms of demographic data, pop-
ing into consideration several characteristics, includ-    ulation age distribution, and nursing homes:
ing age distribution. We also explore and expand on
the impact of implemented containment measures and               NEW YORK STATE – New York State has a
healthcare systems response (12). Specifically, we take    population of 19,378,102 inhabitants and a population
into consideration COVID-19 mortality rates (crude         density of 159 inhabitants/km2 (14). The capital region
and age-standardized) up to 70 days (10 weeks) af-         is New York City with a population of 8,388,748 in-
ter the onset of the epidemic period during which the      habitants and a population density of 10,715 inhabit-
COVID-19 epidemic curve slowed down in all con-            ants/km2 (14). Considering the population age distri-
sidered settings.                                          bution of the region (Table 1), only 7.7% of the whole
                                                           population is older than 70 years (Figure 1). In the
                                                           region there are 450 nursing homes, where 3,405 con-
Methods                                                    firmed death and 2,522 probable death for COVID-19
                                                           occurred until the 30th of May 2020 (representing the
     We considered COVID-19 mortality instead of           20% of the total COVID-19 death recorded in the
notification rates, acknowledging the highest reliabil-    area) (15). For the period 1st February- 30th May 2020,
ity of such indicator. Study settings have been chosen     the excess mortality rate not attributed to COVID-19
considering geographical, societal, and economic char-     is 21.5% (8,077/36,644) higher compared to the same
acteristics, and considering the availability and compa-   period of 2019 (16, 17). Crude and age-standardized
rability of official COVID-19 mortality data.              cumulative mortality rate of the Region are shown in
     For each of the nine regions, we built a profile      Figure 2. Crude cumulative mortality rate of the capi-
which included administrative, demographic, and so-        tal is shown in Table 2, data starting from the begin-
cial characteristics (the latter was estimated in terms    ning of the epidemic (15th March 2020) (18). Crude
of population age distribution and number of nursing       and age-standardized weekly mortality rate are shown
homes). With respect to COVID-19, we analyzed the          in Figure 3.
number of deaths and draw mortality curves, starting
on the day during which the first 3 deaths were re-             BRUXELLES-CAPITAL – The Bruxelles-
ported by surveillance systems in each area. Further-      Capital Region has a population of 1,208,542 inhab-
more, we analyzed mortality rate at the regional and       itants and a population density of 7,489 inhabitants/
metropolitan level to evaluate centripetal trend of the    km2 (19). The central area includes the city of Brux-
epidemic. Finally, we analyzed in detail the case of       elles (181,726 inhabitants, and population density of
Lombardy and with its the metropolitan area of Milan,      5,570 inhabitants/km2) (20). Considering the popu-
the European region hit first and whose mortality rates    lation age distribution of the region (Table 1), only
has been considered to be abnormal (13).                   9.4% of the whole population is older than 70 years
     Due to the wide differences in age distribution       (Figure 1). In the region there are 146 nursing homes,
across study settings (proportion of people older than     where 643 confirmed death for COVID-19 occurred
70 years ranging from 6.9% Catalonia to 17.0% Lom-         until the 7th of June 2020 (representing the 49.2% of
bardy), in addition to crude mortality rates, we cal-      the total COVID-19 death recorded in the region)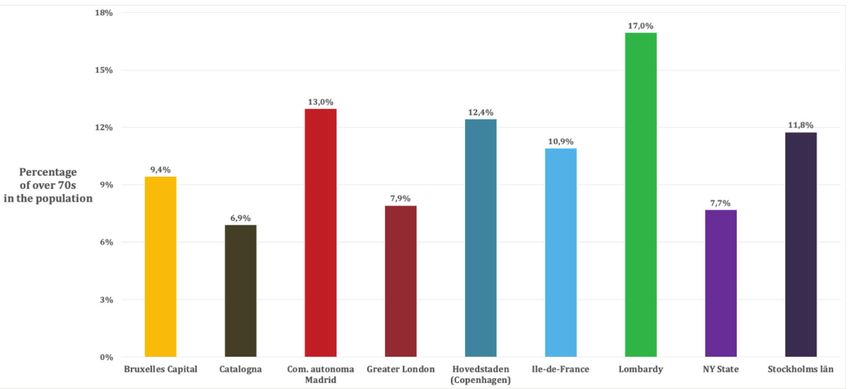
The spread of COVID-19 in nine western metropolitan regions                                                                    9

 Table 1. Population age distribution stratified in four age groups, in the nine Regions

 Age (in      New York Bruxelles          Com.           Catalonia   Ile de   Greater      Stockholms   Hovedtsnden Lombardy
 years)       State                       Madrid                     France   London       län

 0-59         82.8%         82.3%         76.7%          87.7%       79.5%    84.7%        79.0%        77.8%        71.3%

 60-69        8.7%          8.2%          10.3%          5.4%        9.6%     7.3%         9.3%         9.7%         11.8%

 70-79        5.0%          5.4%          7.5%           3.9%        6.5%     4.8%         7.8%         8.4%         9.9%

 80+          3.5%          4.1%          5.5%           3.0%        4.4%     3.1%         4.0%         4.0%         7.1%

Figure 1. Population age distribution older than 70 years, in the nine Regions

(21). For the period 24th February- 24th May 2020, the                  lation density of 829.84 inhabitants/km2 (24, 25). The
excess mortality rate not attributed to COVID-19 is                     capital region is Madrid with 3,266,126 inhabitants
9.2% (134/1,455) higher compared to the same period                     and a population density of 5,265 inhabitants/km2(25).
of 2019 (22). Crude and age-standardized cumulative                     Considering the population age distribution of the re-
mortality rate of the Region are shown in Figure 2.                     gion (Table 1), only 13.0% of the whole population
Crude cumulative mortality rate of the capital region is                is older than 70 years (Figure 1). In the region there
shown in Table 2, data starting from the beginning of                   are 700 nursing homes, where 1,251 confirmed death
the epidemic (11th March 2020) (23). Crude and age-                     and 4,728 probably death for COVID-19 occurred
ad weekly mortality rate are shown in Figure 3.                         (representing the 68.8% of the total COVID-19 death
                                                                        recorded in the region) (26). For the period 1st January-
     COMMUNITY OF MADRID – The Commu-                                   24th May 2020, the excess mortality rate not attributed
nity of Madrid has 6,661,949 inhabitants and a popu-                    to COVID-19 is 42.1% (6,325/15,011) higher com-
10 C. Signorelli, A. Odone, V. Gianfredi, et al.
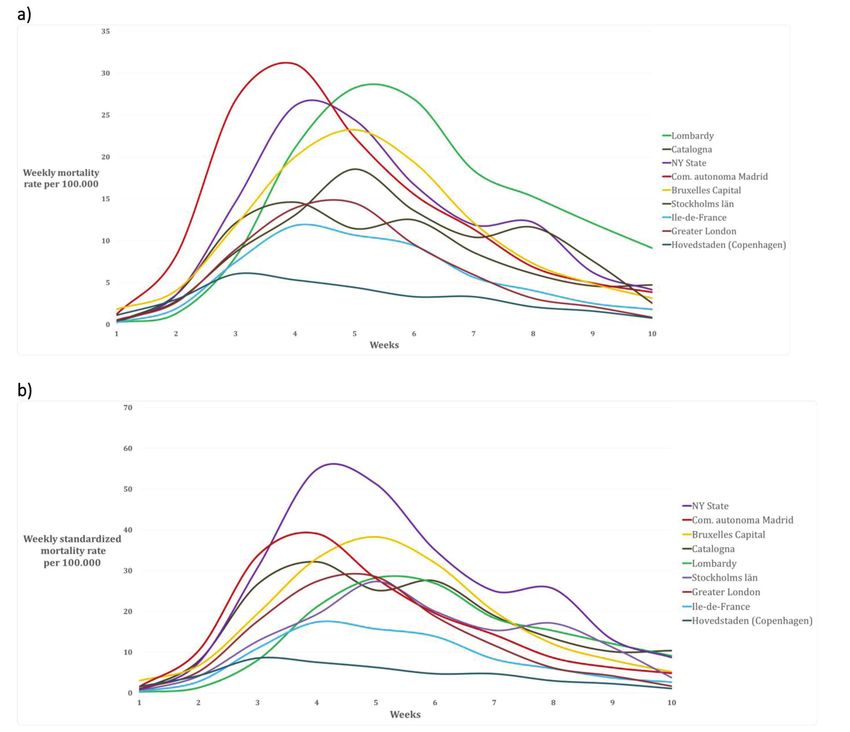
Figure 2. 70 days-Cumulative mortality rate in the nine Regions (a) crude, and (b) age-standardized
pared to the same period of 2019 (27, 28). Crude and only 6.9% of the whole population is older than 70
age-standardized cumulative mortality rate of the Re- years (Figure 1). In the region there are 1,073 nursing
gion are shown in Figure 2. Crude cumulative mortal- homes, where 4,084 confirmed death for COVID-19
ity rate of the capital region is shown in Table 2, data occurred (representing the 73.1% of the total COV-
starting from the beginning of the epidemic (6th March ID-19 death recorded in the region) (26). For the peri-
2020) (29). Crude and age-standardized weekly mor- od 1st January- 24th May 2020, the excess mortality rate
tality rate are shown in Figure 3. not attributed to COVID-19 is 51.5% (5,919/11,494)
higher compared to the same period of 2019(27, 28).
CATALONIA – Catalonia has 7,619,494 in- Crude and age-standardized cumulative mortality rate
habitants and a population density of 235.63 inhab- of the Region are shown in Figure 2. Crude cumulative
itants/km2 (25). The capital region is Barcelona with mortality rate of the capital region is shown in Table
1,636,762 inhabitants and a population density of 2, data starting from the beginning of the epidemic
15,992.21 inhabitants/km2 (25). Considering the (10th March 2020) (29). Crude and age-standardized
population age distribution of the region (Table 1), weekly mortality rate are shown in Figure 3.The spread of COVID-19 in nine western metropolitan regions 11
Table 2. Summary of demographic characteristics of the nine considered areas; proportion of deaths in nursing homes and other
epidemiological characteristics
Area Population Population Beginning of Deaths Crude Definition of COVID-19
x 100,000 density the epidemic in cumulative death
inh./km2 *, week of the nursing mortality rate°
peak homes
(%)§
New York State 8,623 159 15th March; 4th 20 120.7 People who tested positive
week and who did not have a posi-
tive COVID-19
laboratory test, but their
New York city 8,388 10,715 191.3 death certificate lists as the
cause of death “COVID-19”
or an equivalent (18)
Bruxelles- Capital 1,209 7,489 11th March; 5th 49.2 107.9 Both confirmed and
Bruxelles 181 5,570 week n.a. probable deaths (64)
Community of 6,662 829 6th March; 4th 68.8 132.8 Before April, the 17th only
Madrid week people who tested positive in
hospital. After,
Madrid 3,266 5,265 n.a. independent of the place of
death.
Catalonia 7,619 235 10th March; 4th 73.0 79.0 Before April, the 17th only
week people confirmed and
probable cases. After, same as
the rest of Spain.
Barcellona 1,636 15,999 n.a.
Ile-de-France 12,278 1,022 11 March; 4
th th
50.0 55.7 Only hospitalized patients
week who test positive for SARS-
CoV-2 (excluding death
occurred in community or in
Paris 2,148 20,382 76.39 nursing homes) (65)
Greater London 9,304 5,671 8th March; 5th 14.0 62.7 Only hospitalized patients
week who test positive for SARS-
CoV-2 (included post-mor-
Inner London 3,000 9,404 56.6
tem test)(66)
Stockholms län 2,119 325 6th March; 5th 32.0 93.0 Patients who test positive for
week SARS-CoV-2,
independently of the cause of
Stockholms 960 5,129 96.9^
death (67)
Hovedstaden 1,846 718 16th March; 4th n.a. 31.2 Patients who test positive for
week SARS-CoV-2,
independently of the cause of
Hillerød 33 155 n.a.
death (68)
Lombardy 10,088 422 23rd February; 50.0 141.0 Patients who test positive for
5th week SARS-CoV-2,
independently of the cause of
Milan 3,250 2,603 72.8+
death (69)
*Considered as the day during which the first 3 deaths were recorded; °Considered the 30th day since the beginning of the epidemic;
§
based on total COVID-19 deaths; ^ until 15th June 2020; + until 17th April; n.a. not available12 C. Signorelli, A. Odone, V. Gianfredi, et al.
Figure 3. Cumulative weekly mortality rate in the nine Regions (a) crude, and (b) age-standardized
ÎLE-DE-FRANCE (Paris region) – We ana- tal COVID-19 death recorded in the country) (33).
lyzed the region of Île-de-France, with 8 Départe- For the period 11th March- 20th May 2020, the excess
ment, a total population of 12,278,210 inhabitants mortality rate not attributed to COVID-19 is 37.5%
(18% of metropolitan France population) and a popu- (4,102 /10,952) higher compared to the same period
lation density of 1,022.25 inhabitants /km2 (30). The of 2019 (34). Crude and age-standardized cumulative
capital region is Paris, divided into 20 arrondissement, mortality rate of the Region are shown in Figure 2.
with 2,148,271 inhabitants and a population density of Crude cumulative mortality rate of the capital region
20,382 inhabitants /km2 (31). is shown in Table 2, data starting from the beginning
Considering the population age distribution of of the epidemic 11th March 2020) (35). Crude and
the region (Table 1), only 10.9% of the whole popula- age-standardized weekly mortality rate are shown in
tion is older than 70 years (Figure 1). In the region Figure 3.
there are 760 nursing homes (32), where 5,621 con-
firmed death for COVID-19 occurred until 28th May GREATER LONDON – The county of Great-
2020 (representing approximately the 50% of the to- er London has 8,899,375 inhabitants and a popula-The spread of COVID-19 in nine western metropolitan regions 13
tion density of 5,671 inhabitants /km2. Inner Lon- lation density of 718.57 inhabitants /km2. The capi-
don forms the central part of Greater London with tal region is Hillerød with 33,088 inhabitants and a
12 boroughs and the City of London; it has 3 mil- population density of 155.34 inhabitants /km2) (44).
lion inhabitants (36) and a density of population of Considering the population age distribution of the re-
9,404 inhabitants/km2). Considering the population gion (Table 1), only 12.4% of the whole population is
age distribution of the region (Table 1), only 7.9% of older than 70 years (Figure 1). In the region there are
the whole population is older than 70 years (Figure 1). 229 nursing homes (45), data on confirmed deaths oc-
In the region there are 426 nursing homes (37), where curred in nursing home is not available. For the period
803 confirmed death for COVID-19 occurred in the 15th March- 26th May 2020, the excess mortality rate
period 10th April – 16th May 2020 (representing the not attributed to COVID-19 is -1.9% (-206/10,741)
14% of the total COVID-19 death recorded in the re- higher compared to the same period of 2019 (43).
gion) (38). For the period 9th March- 16th May 2020, Crude and age-standardized cumulative mortality rate
the excess mortality rate not attributed to COVID-19 of the Region are shown in Figure 2. Crude cumulative
is 51,5% (5,919/11,494) higher compared to the mean mortality rate of the capital region is shown in Table 2,
value of the previous five years (39). Crude and age- data starting from the beginning of the epidemic (16th
standardized cumulative mortality rate of the Region March 2020). Crude and age-standardized weekly
are shown in Figure 2. Crude cumulative mortality rate mortality rate are shown in Figure 3.
of the capital region is shown in Table 2, data starting
from the beginning of the epidemic (8th March 2020) LOMBARDY (Milan Region) – The Lombardy
(40). Crude and age-standardized weekly mortality Region, with a population of 10,060,574 people and
rate are shown in Figure 3. a population density of 422 inhabitants per km2. The
capital region is the metropolitan area of Milan, which
STOCKHOLMS LÄN – Stockholms län has consists of the city of Milan and other 133 municipali-
2.1 million inhabitants and a density of 325.17 inhab- ties, with a total of 3,250,315 inhabitants and a popu-
itants/km2. The capital region is Stockholm city with lation density of 2,063 inhabitants/km2 (46). Consid-
960 thousand inhabitants and a population density ering the population age distribution of the region
of 5,129.47 inhabitants /km2) (41). Considering the (Table 1), 17% of the whole population is older than
population age distribution of the region (Table 1), 70 years (Figure 1). In the region there are 717 nurs-
only 11.8% of the whole population is older than 70 ing homes (47), where approximately 50% of the total
years (Figure 1). In the region there are 400 nursing COVID-19 death recorded in the region has been oc-
homes (42), where 630 confirmed death for COV- curred (data not published). For the period 23rd Feb-
ID-19 occurred in the period 10th April – 16th May ruary- 2nd May 2020, the excess mortality rate not
2020 (representing the 32% of the total COVID-19 attributed to COVID-19 is 66.5% (27,334/41,083)
death recorded in the region) (42). For the period 9th higher compared to the same period of 2019 (48).
March- 16th May 2020, the excess mortality rate not Crude and age-standardized cumulative mortality rate
attributed to COVID-19 is 13.1% (298/2,275) higher of the Region are shown in Figure 2. Crude cumulative
compared to the same period of 2019 (43). Crude and mortality rate of the capital region is shown in Table
age-standardized cumulative mortality rate of the Re- 2, data starting from the beginning of the epidemic
gion are shown in Figure 2. Crude cumulative mortal- (23rd February 2020) (49). Crude and age-standardized
ity rate of the capital region is shown in Table 2, data weekly mortality rate are shown in Figure 3.
starting from the beginning of the epidemic (6th March
2020). Crude and age-standardized weekly mortality Figure 2 and 3 represent the epidemic spread in
rate are shown in Figure 3. the nine metropolitan regions with the cumulative
daily mortality rate, the standardized mortality rate,
HOVEDTSNDEN (Copenhagen region) – the crude weekly mortality rate and the weekly age-
Hovedtsnden has 1,846,023 inhabitants and a popu- standardized mortality rate. We decided to conclude14 C. Signorelli, A. Odone, V. Gianfredi, et al.
the analytic comparison after 10 weeks (day 70) from rates, which however are almost homogeneous in the 9
the onset of the outbreak (Table 2). Regions except one (New York).
Since the first reports of the COVID-19 pandem- Although the Lombardy case was the first to be
ic, in China (50), data showed a higher hospitalization described by the media, it is of great scientific interest
rate among elderly (older than 65 years) (51), and a as well (56), since even the alleged excess of deaths
sever clinical manifestation among patients with co- compared to the other regions (57), this is not con-
morbidities (52). According to TESSy data, deaths are firmed by our results. Given that the crude mortality
approximately 40% among people aged 65-79 years, rate (number of deaths for COVID-19 / reference
and approximately 50% among people older than 80 population per unit of time) is largely affected by the
years (52). As emerges from this data, COVID-19 se- age distribution of the population; and considering that
rious clinical cases impacted the most on elder popula- COVID-19 has a greater disease burden among the
tions. elderly, it is appropriate to estimate age-standardized
Figure 1 shows how Lombardy is the region with mortality. The standardized age mortality rate allows
the highest proportion of elder populations, with a to increase the level of comparability and expresses the
proportion of over 70-year-olds 70% higher when mortality rate that the population would have if the
compared with the other Regions studied (17% vs. age distribution would be the same as the reference
10%). Considering this important difference in pop- population (standard).
ulation distribution, the age-standardized mortality
rates were calculated. Although Lombardy was the
first European region to be affected by the epidemic Possible bias
(53), the cumulative age-standardized mortality rates
of Lombardy are in the average and lower than the The nine areas analyzed have similar economic
community of Madrid, Catalonia, Brussels-Capital, characteristics, healthcare standards and COVID-19
and New York State. For the latter, the estimated cu- surveillance data collection procedures, which allowed
mulative age-standardized mortality is approximately us to make a reliable data comparison. The choice of
double compared to Lombardy (Figure 2 b). these areas followed administrative borders and the
Considering that high-risk subjects are frequently availability of the disaggregated mortality data.
guests of nursing homes, and also accounting for the Our analysis considered daily COVID-19 mor-
numerous outbreaks reported in these settings across tality rates derived by national surveillance statistics,
European countries (42), we report on COVID-19 which are more reliable than infection notifications
burden in our study settings. The proportion of COV- (laboratory confirmed cases). Indeed, notified cases
ID-19 deaths recorded in the nursing homes is, accord- data are largely lower as compared to true disease
ing to available data, between 14% and 73% of total and infection burden, and highly variable depending
COVID-19 deaths, in almost all the regions analyzed, on different testing strategies and criteria adopted in
but in the two Spanish regions the proportion exceed- different regions (58, 59), although it cannot be ruled
ed 60% (54). However, it is necessary to take into ac- out that a portion of the deaths caused by COVID-19
count that different diagnostic test strategies, as well as went undiagnosed. In Table 2 we reported the defi-
different definitions of COVID-19 deaths, have been nition of COVID-19 death adopted in each consid-
adopted in the various countries, potentially reducing ered region. It should be noted that in surveillance
the identification of cases. Moreover, especially at the systems in Ile de France and Greater London region
beginning of the epidemic, there was a global short- only deaths occurred in hospital settings have been in-
age of reagents – useful for carrying out the molecular cluded. This could explain, at least partially, the lower
test – as well as health personnel (both in laboratory value of the recorded mortality rate in these regions.
and for clinical assistance) (55). These factors must be However, we believe that this possible bias does not
taken into account in the interpretation of the total affect much our comparative estimates. Actually, mor-
and not attributed to COVID-19 excesses mortality tality is more reliable than other types of data. Finally,The spread of COVID-19 in nine western metropolitan regions 15
we explored excess mortality rates, because this meas- these aspects cannot completely explain all the differ-
ure allows to also estimate the indirect impact of the ences, also taking into consideration different epidem-
COVID-19 epidemic. Excess mortality also takes into ic dynamics and clinical evolution.
account deaths potentially occurring due to lack of ac- Lombardy remained the only region in which the
cess to treatment, due to indirect effect of lockdown capital-region (Milan) was not significantly affected
measures, of other non-COVID patients. by the epidemic wave, the city having mortality rates
lower than the rest of the region. We have already ex-
panded on potential explanation of this phenomenon
Conclusions (4). However, it should be noted that COVID-19 mor-
tality rate in Lombardy, which was one of the lowest at
We analyzed the COVID-19 epidemic trend in 30 days since outbreak onset, grew more than in other
nine regions and areas comparable from an economic, regions starting form 5th week onwards, with a slower
social, and healthcare perspective, using reliable indi- drop compared to other areas. A similar trend was re-
cators, such as the cause of death. In all considered are- corded in Stockholms län. New York (both the entire
as the epidemic curve began to decrease around the 4th State and the metropolitan area) largely exceed all the
and 5th week, slowing down at 10 weeks since epidem- other considered regions in terms of COVID-19 mor-
inc onset, with a mortality peak during the 4th week tality. This area is characterized by a younger popula-
in all study settings but in Lombardy, Stockholms län tion, a greater metropolitan population density, pres-
and Bruxelles-Capital during the 5th week. However, ence of many neighborhoods with foreign populations,
in all cases the curves showed the classic model of a medium-low economic level, and a private health
logistic growth (60). This postponement of the peak system. These elements might have played a role in ex-
of deaths could be attributed to the different type of cess mortality from COVID-19.
adopted response approach. For instance, in Lombardy However, these data deserve further investigation,
COVID-19 clinical management was more hospital- considering the different management approaches of
based, and then had a mixed approach (hospital and phase 1 of the epidemic (mainly hospital with contain-
home) (61). This may have influenced the total number ment measures) compared to phase 2 (when efficient
of confirmed deaths, as all hospitalized patients were action at the community level is highly required and
tested for COVID-19. Of note that this region is the when nursing homes outbreaks could have played a
one with the highest number of elder populations. The significant role, particularly among the elderly and
age distribution in the 9 regions shows significant dif- fragile patients).
ferences and, in this context, it appears particularly im- In conclusion, it can be said that the impact of
portant, being the mortality rate for COVID-19 high- the COVID-19 epidemic has been significant in terms
ly variable at different ages (about 100 times higher in of mortality in at least 7 of the 9 metropolitan areas
the ≥80 group compared to the group16 C. Signorelli, A. Odone, V. Gianfredi, et al.
diseases, the possible excess of non-COVID-19 mor- ignorelli C, et al. 2019-novel coronavirus survey: knowl-
S
tality during the epidemic peak due to non-use of edge and attitudes of hospital staff of a large Italian teaching
hospital. Acta Biomed. 2020;91(3-s):29-34.
health services, and the reasons behind lower reported 10. Signorelli C, Fara GM. COVID-19: Hygiene and Public
mortality in some geographical areas need to be fur- Health to the front. Acta Biomed. 2020;91(3-S):7-8.
ther investigated. Having reliable data to inform and 11. Capolongo S, Rebecchi A, Buffoli M, Appolloni L, Si-
support future outbreak response strategies will not gnorelli C, Fara GM, et al. COVID-19 and Cities: from
Urban Health strategies to the pandemic challenge. A
only help reducing mortality but will also support pub-
Decalogue of Public Health opportunities. Acta Biomed.
lic health action at the population level (63). 2020;91(2):13-22.
12. Signorelli C, Odone A, Gianfredi V, Bossi E, Bucci D,
Funding: This paper is a preliminary activity of the EU Project Oradini-Alacreu A, et al. The spread of COVID-19 in six
n. 101003562 “Three Rapid Diagnostic tests (Point-of-Care) for western metropolitan regions: a false myth on the excess of
COVID-19 Coronavirus, improving epidemic preparedness, and mortality in Lombardy and the defense of the city of Milan.
foster public health and socio-economic benefits - CORONADX” Acta Biomed. 2020;91(2):23-30.
(Task 7.1) supported by the European Commission (Horizon 2020, 13. Russo P. Coronavirus, le stime dei ricercatori: “In Italia
H2020-SC1-PHE-CORONAVIRUS-2020). almeno 2800 morti non dichiarati” 2020 [Access date 13
April 2020. Available from: https://www.lastampa.it/to-
Conflict of interest: Each author declares that he or she has no pnews/primo-piano/2020/03/30/news/le-stime-dei-ricer-
commercial associations (e.g. consultancies, stock ownership, equity catori-almeno-2800-morti-non-dichiarati-1.38653880.
interest, patent/licensing arrangement etc.) that might pose a con- 14. United States Census. Explore Census Data 2020 [Access
flict of interest in connection with the submitted article date 13 April 2020. Available from: https://data.census.gov/
cedsci/.
15. Department of Health- New York State. Nursing Home
References
and ACF COVID Related Deaths Statewide 2020 [Ac-
cess date 17 June 2020. Available from: https://www.
1. Wilder-Smith A, Chiew CJ, Lee VJ. Can we contain the health.ny.gov/statistics/diseases/covid-19/fatalities_nurs-
COVID-19 outbreak with the same measures as for SARS? ing_home_acf.pdf.
Lancet Infect Dis. 2020. 16. Centers for Disease Control and Prevention. Excess Deaths
2. Kraemer MUG, Yang CH, Gutierrez B, Wu CH, Klein B, Associated with COVID-19 2020 [Access date 17 June
Pigott DM, et al. The effect of human mobility and control 2020. Available from: https://www.cdc.gov/nchs/nvss/vsrr/
measures on the COVID-19 epidemic in China. Science. covid19/excess_deaths.htm.
2020;in press. 17. Centers for Disease Control and Prevention. CDC COVID
3. Amerio A, Bianchi D, Santi F, Costantini L, Odone A, Data Tracker 2020 [Access date 17 June 2020. Available
Signorelli C, et al. Covid-19 pandemic impact on mental from: https://www.cdc.gov/covid-data-tracker/#cases.
health: a web-based cross-sectional survey on a sample of 18. NYC Health. COVID-19: Data 2020 [Access date 17 June
Italian general practitioners. Acta Biomed. 2020;91(2):83-8. 2020. Available from: https://www1.nyc.gov/site/doh/cov-
4. Signorelli C, Scognamiglio T, Odone A. COVID-19 in Italy: id/covid-19-data.page.
impact of containment measures and prevalence estimates of 19. European Commission. Population: Demographic situ-
infection in the general population. Acta Biomed. 2020;91(3- ation, languages and religions 2019 [Access date 13 April
S):175-9. 2020. Available from: https://eacea.ec.europa.eu/national-
5. Tang B, Wang X, Li Q, Bragazzi NL, Tang S, Xiao Y, et al. policies/eurydice/content/population-demographic-situa-
Estimation of the Transmission Risk of the 2019-nCoV and tion-languages-and-religions-7_en.
Its Implication for Public Health Interventions. J Clin Med. 20. City population. Bruxelles Municipality 2019 [Access date
2020;9(2). 13 April 2020. Available from: https://www.citypopulation.
6. Mayor S. Covid-19: Researchers launch app to track spread de/en/belgium/bruxelles/_/21004__bruxelles/.
of symptoms in the UK. BMJ. 2020;368:m1263. 21. The Brussels Times. Nursing home residents make up nearly
7. Gianfredi V, Odone A, Fiacchini D, Rosselli R, Battista T, half of Belgium’s coronavirus deaths 2020 [Access date 13
Signorelli C. Trust and reputation management, branding, April 2020. Available from: https://www.brusselstimes.
social media management nelle organizzazioni sanitarie: sfide com/all-news/belgium-all-news/105848/nearly-half-of-
e opportunità per la comunità igienistica italiana. J Prev Med belgiums-coronavirus-deaths-are-nursing-home-residents/.
Hyg. 2019;60(3):E108-E9. 22. Statista. Observed and expected weekly death tolls in the
8. Gianfredi V, Grisci C, Nucci D, Parisi V, Moretti M. [Com- Brussels-Capital Region (Belgium) from February to April
munication in health.]. Recenti Prog Med. 2018;109(7):374- 2020 2020 [Access date 15 June 2020. Available from:
83. https://www.statista.com/statistics/1114383/excess-deaths-
9. Moro M, Vigezzi GP, Capraro M, Biancardi A, Nizzero P, in-brussels-by-coronavirus/.The spread of COVID-19 in nine western metropolitan regions 17
23. Sciensano. COVID-19 - Situation épidémiologique 2020 36. World Population Review. London Population 2020 2020
[Access date 15 April 2020. Available from: https://epistat. [Access date 15 April 2020. Available from: https://world-
wiv-isp.be/covid/. populationreview.com/world-cities/london-population/.
24. Portal del Ayuntamiento de Madrid. Portal web del Ayun- 37. United States Census. New York County (Manhattan Bor-
tamiento de Madrid 2019 [Access date 13 April 2020. ough), New York 2020 [Access date 18 June 2020. Available
Available from: https://www.madrid.es/portal/site/muni- from: https://www.census.gov/quickfacts/newyorkcounty-
madrid#. manhattanboroughnewyork.
25. Instituto Nacional de Estadistica. Demografía y población 38. Office for National Statistics. Number of deaths in care
2019 [Access date 13 April 2020. Available from: https:// homes notified to the Care Quality Commission, England.
www.ine.es/. 2020 [Access date 18 June 2020. Available from: https://
26. Ministerio de Sanidad de España. Radiografía del corona- www.ons.gov.uk/peoplepopulationandcommunity/births-
virus en residencias de ancianos: más de 19.500 muertos deathsandmarriages/deaths/datasets/numberofdeathsin-
con Covid-19 o síntomas compatibles 2020 [Access date carehomesnotifiedtothecarequalitycommissionengland.
17 June 2020. Available from: https://www.rtve.es/noti- 39. Office for National Statistics. Deaths registered weekly in
cias/20200614/radiografia-del-coronavirus-residencias- England and Wales, provisional: week ending 22 May 2020.
ancianos-espana/2011609.shtml. 2020 [Access date 18 June 2020. Available from: https://
27. EuroMOMO. EuroMOMO Bulletin, Week 23, 2020 2020 www.ons.gov.uk/peoplepopulationandcommunity/births-
[Access date 17 June 2020. Available from: https://www. deathsandmarriages/deaths/bulletins/deathsregistered-
euromomo.eu/. weeklyinenglandandwalesprovisional/latest.]
28. Istituto Nacional de Estadistica. Estimación del número de 40. NHS England. COVID-19 Daily Deaths 2020 [Access date
defunciones semanales durante el brote de covid-19 2020 15 April 2020. Available from: https://www.england.nhs.
[Access date 17 June 2020. Available from: https://www. uk/statistics/statistical-work-areas/covid-19-daily-deaths/.]
ine.es/experimental/defunciones/experimental_defun- 41. World Population Review. Stockholm Population 2019
ciones.htm#tablas_resultados. 2020 [Access date 15 June 2020. Available from: https://
29. Ministerio de Sanidad de España. Situación de COVID-19 worldpopulationreview.com/world-cities/stockholm-popu-
en España 2020 [Access date 13 June 2020. Available from: lation/.]
https://covid19.isciii.es/. 42. European Centre for Disease Prevention and Control. Sur-
30. Institut National de la statistique et des études éeconom- veillance of COVID-19 at longterm care facilities in the
iques. The National Institute of Statistics and Economic EU/EEA. Stockholm; 2020.
Studies collects, analyses and disseminates information on 43. Socialstyrelsen. Statistik relaterad till covid-19 2020 [Access
the French economy and society 2019 [Access date 13 April date 15 June 2020. Available from: https://www.socialsty-
2020. Available from: https://www.insee.fr/en/accueil. relsen.se/statistik-och-data/statistik/statistik-om-covid-19/
31. Institut National de la statistique et des études éeconom- statistik-relaterad-till-covid-19/.]
iques. The National Institute of Statistics and Economic 44. Statistics Denmark. Population 2019 2020 [Access date 15
Studies collects, analyses and disseminates information on June 2020. Available from: https://www.dst.dk/en/Statistik/
the French economy and society 2019 [Access date 17 June emner/befolkning-og-valg.]
2020. Available from: https://www.insee.fr/en/accueil. 45. D un and Bradstreet Coronavirus Resources. Nurs-
32. Caisse nationale de solidarieté pour l’autonomie. An- ing Homes & Long-Term Care Facilities Companies In
nuaire des EHPAD et maisons de retraite 2020 [Access Hovedstaden, Denmark 2020 [Access date 17 June 2020.
date 18 June 2020. Available from: https://www.pour-les- Available from: https://www.dnb.com/business-directory/
personnes-agees.gouv.fr/annuaire-ehpad-et-maisons-de- company-information.nursing-homes-long-term-care-fa-
retraite?departement=PARIS%20(75)#container-result- cilities.dk.hovedstaden.html?page=5.]
query. 46. Istituto Nazionale di Statistica (ISTAT). Popolazi-
33. Santè Publique France. COVID-19 : point épidémiologique one residente al 1° gennaio 2019 [Access date 13
en Ile-de-France du 11 juin 2020 2020 [Access date 18 June April 2020. Available from: http://dati.istat.it/Index.
2020. Available from: https://www.santepubliquefrance.fr/ aspx?DataSetCode=DCIS_POPRES1.]
regions/ile-de-france/documents/bulletin-regional/2020/ 47. Regione Lombardia-ATS Milano Città Metropolitana.
covid-19-point-epidemiologique-en-ile-de-france-du- RSA Flusso Covid 19. 2020. [Access date 17 June 2020.
11-juin-2020. Available from: https://www.ats-milano.it/portale/Por-
34. Istitut National de la statistique et des ètudes èconomiques. tals/0/emergenza%20coronavirus/Report%2013_05_20_
Info coronavirus 2020 [Access date 18 June 2020. Available Flusso%20Covid%20RSA.pdf ]
from: https://www.insee.fr/fr/statistiques/4487861?sommai 48. Istituto Nazionale di Statistica (ISTAT). Decessi e cause
re=4487854 di morte: cosa produce l’ISTAT 2020 [Access date 18
35. Gouvernement France. COVID-19 en France 2020 [Ac- June 2020. Available from: https://www.istat.it/it/archiv-
cess date 13 April 2020. Available from: https://www.gou- io/240401.]
vernement.fr/info-coronavirus/carte-et-donnees. 49. Dipartimento della Protezione Civile. COVID-19 Italia-18 C. Signorelli, A. Odone, V. Gianfredi, et al.
Monitoraggio della situazione 2020 [Access date 18 June approaches adopted in the Italian regions to care for pa-
2020. Available from: http://www.protezionecivile.gov.it/ tients affected by COVID-19. Heliyon. 2020;in press.
attivita-rischi/rischio-sanitario/emergenze/coronavirus. 62. Banerjee A, Pasea L, Harris S, Gonzalez-Izquierdo A, Tor-
50. Zhu N, Zhang D, Wang W, Li X, Yang B, Song J, et al. ralbo A, Shallcross L, et al. Estimating excess 1-year mortality
A Novel Coronavirus from Patients with Pneumonia associated with the COVID-19 pandemic according to un-
in China, 2019. The New England journal of medicine. derlying conditions and age: a population-based cohort study.
2020;382(8):727-33. Lancet (London, England). 2020;395(10238):1715-25.
51. Li X, Xu S, Yu M, Wang K, Tao Y, Zhou Y, et al. Risk 63. Gianfredi V, Balzarini F, Gola M, Mangano S, Carpagnano
factors for severity and mortality in adult COVID-19 inpa- LF, Colucci ME, et al. Leadership in Public Health: Op-
tients in Wuhan. J Allergy Clin Immunol. 2020. portunities for Young Generations Within Scientific As-
52. European Centre for Disease Prevention and Control. sociations and the Experience of the “Academy of Young
Rapid Risk Assessment: Coronavirus disease 2019 (COV- Leaders”. Front Public Health. 2019;7:378.
ID-19) in the EU/EEA and the UK- ninth update. Stock- 64. Sciensano. COVID19 BE open data codebook. 2020. [Ac-
holm2020. cess date 13 June 2020. Available from: https://epistat.sci-
53. Ministero della Salute. Covid-19 - Situazione in Italia 2020 ensano.be/COVID19BE_codebook.pdf ]
[Access date 13 April 2020. Available from: http://www.sa- 65. Gouvernement France. COVID-19 2020 [Access date 13
lute.gov.it/portale/nuovocoronavirus/dettaglioContenutiN- June 2020. Available from: https://www.gouvernement.fr/
uovoCoronavirus.jsp?area=nuovoCoronavirus&id=5351&li info-coronavirus/carte-et-donnees.]
ngua=italiano&menu=vuoto.] 66. NHS england. COVID-19 Daily Deaths 2020 [Access date
54. Associazione gestione servizi socio-sanitari e cure post in- 13 June 2020. Available from: https://www.england.nhs.uk/
tensive. Documento di chiarificazione presentato da AGeS- statistics/statistical-work-areas/covid-19-daily-deaths/.]
PI Lombardia alla Commissione RSA Lombardia. Milano: 67. Folkhalsomyndig. Totalt antal laboratoriebekräftade 2020
AGeSI Lombardia; 2020. [Access date 13 June 2020. Available from: https://experi-
55. Scott A. Is a reagents shortage delaying European ence.arcgis.com/experience/09f821667ce64bf7be6f9f8745
COVID-19 testing? Chemical and Engineering news. 7ed9aa.]
2020;98(13). 68. Statens Serum Institut. COVID-19 i Danmark. 2020. [Ac-
56. Sechi GM, Migliori M, Dassi G, Pagliosa A, Bonora R, cess date 13 June 2020. Available from: https://www.ssi.dk/
Oradini-Alacreu A, et al. Business Intelligence applied to aktuelt/sygdomsudbrud/coronavirus/covid-19-i-danmark-
Emergency Medical Services in the Lombardy region dur- epidemiologisk-overvaagningsrapport]
ing SARS-CoV-2 epidemic. Acta Biomed. 2020;91(2):39- 69. Istituto Superiore di Sanità. Characteristics of SARS-
44. CoV-2 patients dying in Italy Report based on available
57. Lazzerini M, Putoto G. COVID-19 in Italy: momentous data on April 20th, 2020 [Access date 13 June 2020. Avail-
decisions and many uncertainties. Lancet Glob Health. able from: https://www.epicentro.iss.it/en/coronavirus/
2020. bollettino/Report-COVID-2019_20_april_2020.pdf.]
58. Romanò L, Pariani E, Biganzoli E, Castaldi S. The end of
lockdown what next ? Acta Biomedica. 2020;91(2).
59. Odone A, Delmonte D, Scognamiglio T, Signorelli C. Received: 25 June 2020
COVID-19 deaths in Lombardy, Italy: data in context. The Accepted: 5 July 2020
Lancet Public health. 2020;5(6):e310. Correspondence:
60. Tátrai D, Várallyay Z. COVID-19 epidemic outcome pre- Prof. Carlo Signorelli,
dictions based on logistic fitting and estimation of its reli- Direttore Scuola di Specializzazione in Igiene e Medicina
ability. arXiv preprint. 2020. Preventiva, Università Vita-Salute San Raffaele, Milano
61. Pecoraro F, Luzi D, Clemente F. Analysis of the different E-mail: signorelli.carlo@hsr.itYou can also read