Keep Watch Seagrass Monitoring 2021 Report for GeoCatch - Edith Cowan University Centre for Marine Ecosystems Research
←
→
Page content transcription
If your browser does not render page correctly, please read the page content below
Edith Cowan University
Centre for Marine Ecosystems Research

      Keep Watch Seagrass
      Monitoring 2021
      Report for GeoCatch

       Kathryn McMahon and Natasha Dunham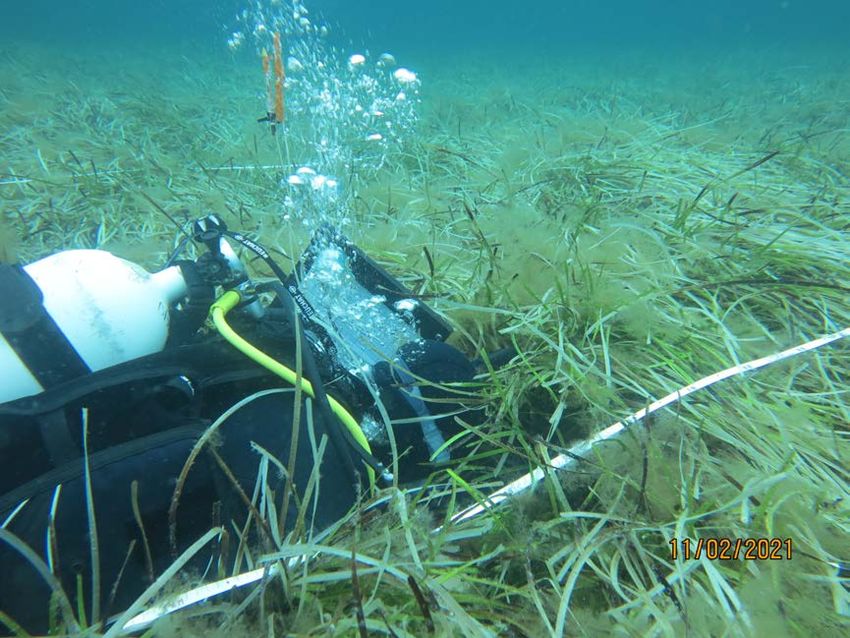
Keep Watch Seagrass Monitoring 2021

No portion of this material may be reproduced or communicated without the permission of GeoCatch
and ECU, unless the reproduction or communication is authorised by law. ECU 2021.

Keep Watch Seagrass Monitoring, 2021. Report to GeoCatch

Kathryn McMahon and Natasha Dunham

Cite as:
McMahon and Dunham (2021). Keep Watch Seagrass Monitoring, 2021. Report to GeoCatch. Centre
for Marine Ecosystems Research, Edith Cowan University 38 pages.

This work was funded by GeoCatch and Water Corporation and supported in-kind by Department of
Biodiversity, Conservation and Attractions.

                                               2
Keep Watch Seagrass Monitoring 2021

Table of Contents
1     EXECUTIVE SUMMARY .......................................................................................................................... 7
    1.1       INTRODUCTION ..................................................................................................................................................... 7
    1.2       KEY FINDINGS 2012-2021 ............................................................................................................................... 7
    1.3       RECOMMENDATIONS ............................................................................................................................................ 8
2     INTRODUCTION ...................................................................................................................................... 9
3     METHODS FOR KEEP WATCH – SEAGRASS HEALTH MONITORING PROGRAM ................. 9
    3.1       SEAGRASS MONITORING ...................................................................................................................................... 9
4     RESULTS ................................................................................................................................................. 14
    4.1       SHOOT DENSITY .................................................................................................................................................. 14
    4.2       TRIGGER ASSESSMENT ....................................................................................................................................... 16
    4.3       EPIPHYTES ........................................................................................................................................................... 17
    4.4       OTHER OBSERVATIONS ...................................................................................................................................... 19
    4.5       NUTRIENT CONTENT .......................................................................................................................................... 20
    4.6       WATER QUALITY ................................................................................................................................................ 26
5     GENERAL CONCLUSIONS ................................................................................................................... 26
    5.1       MODEST DECLINES IN SHOOT DENSITY AT SOME SITES ................................................................................ 26
    5.2       ALGAL EPIPHYTE COVER INCREASES IN 2020 ............................................................................................... 27
    5.3       NITROGEN EXPOSURE IS LOW AND NO OBVIOUS CHANGES IN THE SOURCES ............................................. 28
    5.4       A REFLECTION OF 10 YEARS OF KEEP WATCH SEAGRASSES MONITORING IN GEOGRAPHE BAY........... 29
6     REFERENCES ......................................................................................................................................... 30
APPENDIX 1: RANDOMLY GENERATED QUADRAT POSITIONS FROM 2021 SURVEY. .................. 31
APPENDIX 2: RAW AND SUMMARY STATISTICS FOR SHOOT DENSITY DATA FOR THE SEVEN
KEEP WATCH SEAGRASS MONITORING SITES IN 2021. SEEDLING COUNTS, AND THE PERSON
WHO COUNTED EACH QUADRAT IS ALSO INCLUDED. .......................................................................... 32
APPENDIX 3: LEAF MORPHOLOGY DATA FOR 2021 ............................................................................. 33
APPENDIX 4: TRENDS OVER TIME IN SEAGRASS SHOOT DENSITY. ................................................. 34
APPENDIX 5: NUTRIENT DATA FOR 2020 AND 2021 INCLUDING THE ORIGINAL AND MODIFIED
CALIBRATED VALUES FOR 2020 AS WELL AS THE CALIBRATED VALUES FOR 2021. .................. 36
APPENDIX 6: COUNT COMPARISONS BETWEEN DIVERS AT EACH SITE. ........................................ 37

                                                                                      3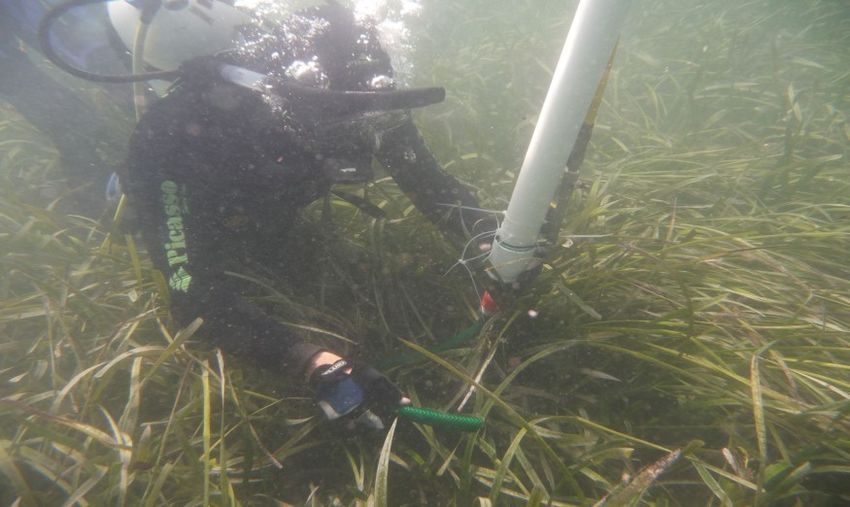
Keep Watch Seagrass Monitoring 2021

4
Keep Watch Seagrass Monitoring 2021

           Keep Watch Seagrass Monitoring
                           Annual Report 2021

           Investigator: Kathryn McMahon and Natasha Dunham

A project funded by GeoCatch and Water Corporation with in-kind support from the
             Department of Biodiversity, Conservation and Attractions.

                                  June 2021

                                       5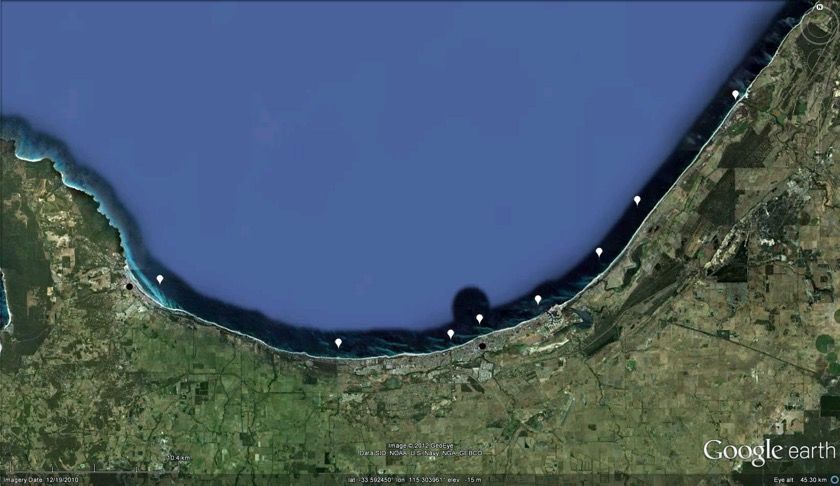
Keep Watch Seagrass Monitoring 2021

6
1 Executive Summary
1.1 Introduction
This report summarises ten years of data (Feb 2012 - Feb 2021) from the Keep Watch
Seagrass Monitoring Program in Geographe Bay. The program was developed in
collaboration with GeoCatch, Edith Cowan University (ECU), Department of Water
and Environmental Regulation, Department of Biodiversity, Conservation and
Attractions, and the South West Catchment Council. Since 2016 annual seagrass
monitoring has been carried out by ECU with in-kind support from the Department of
Biodiversity, Conservation and Attractions and funding from the Water Corporation.

The Keep Watch seagrass monitoring program was initiated due to concerns for the
health of seagrass meadows in Geographe Bay from predicted increases in catchment
nutrients. The aim of the program is to monitor near shore seagrass meadows annually
to detect any change in seagrass health. Seagrass shoot density of the dominant
seagrass species Posidonia sinuosa is monitored at seven sites across Geographe Bay
as an indicator of seagrass health. Observations of algal epiphyte cover and seagrass
leaf nutrient content and nitrogen isotope signals are also measured to help interpret
any changes.

Three management triggers have been established for Geographe Bay to detect
changes in shoot density outside normal annual variation. Comparison of shoot
densities with temperate seagrass meadows in other areas in Western Australia are
also used as a comparison to assess inter-annual and site variations.

1.2 Key findings 2012-2021
Key finding 1
Over 10 years the Keep Watch program has identified no major concerns regarding
seagrass health. There have been fluctuations in seagrass shoot density with no
significant trends of decline, and no management triggers breached. This year, most
sites did have a small to modest decline but for all but one site, this was in the range
observed over the ten years. These shoot densities in Geographe Bay are above or in
the upper range of other temperate Posidonia sinuosa seagrass meadows in Western
Australia, highighting the value of this ecosystem.

Key finding 2
Epiphyte cover has fluctuated over time, generally sites in the centre of the bay have
the highest epiphyte cover. The last two years have had the highest cover observed
with three sites recording high cover. This is a concern as persistent high cover can
negatively impact seagrass condition and most sites did experience small declines this
year. The most common types of algae present are microalgae, which is not often
associated with nutrient enrichment in seagrass ecosystems, although they do respond
to increases in nutrient. As no significant seagrass declines were observed, this is not
a major concern at this time, unless the algal cover persists or continues to increase
into next year.

                                                                                           7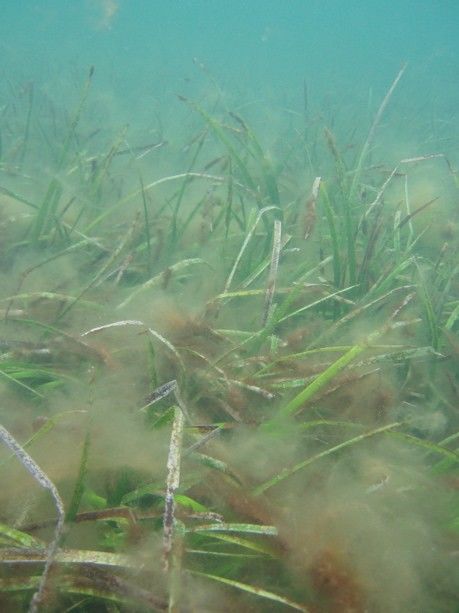
Key finding 3
Nutrient content of seagrasses in Geographe Bay is relatively low and there was a
slight drop compared to last year. The high algal cover persisted which could also be
stimulated by nutrients, supporting the value of actions to reduce nutrient loads in the
catchment. However, higher exposure to nutrients was not documented. Nutrient
concentration varied slightly across years and sites, and the main difference is two
times higher nitrogen content at Capel compared to all other sites, indicating higher
loads of nutrients reaching seagrasses at Capel.

Key finding 4
The main sources of nitrogen for seagrass at most sites is likely to be from fixation of
atmospheric nitrogen or agricultural fertilisers. A higher nitrogen isotope signal at
Capel suggests that nitrogen derived from animal wastes, septic tanks or from natural
vegetation is also a main source. There is no evidence that nitrogen derived from
treated sewerage is a major source of nitrogen for Geographe Bay seagrasses.

Key finding 5
Since the beginning of the Keep Watch program it has been recommended to
undertake seagrass extent mapping every 5 years to link with the annual seagrass
monitoring. This now has been arranged and will be undertaken in collaboration with
DBCA and DWER in 2021.

1.3 Recommendations
These recommendations are based on the last ten years of Keep Watch monitoring
and consider GeoCatch’s needs into the future.

Recommendation 1
Continue monitoring seagrass health based on the Keep Watch Monitoring protocol
including the quality control in the field and laboratory. Posidonia sinuosa meadows
should be monitored at seven sites, and nutrient monitoring of A. antarctica at three
sites. There is a need due to low A. antarctica abundance at Busselton Jetty to start
collecting this at Vasse Diversion next year. Considering the threat of nutrient
enrichment is on-going in the Geographe Bay catchment, monitoring of seagrass
health provides an early warning indicator of impacts in Geographe Bay. This
program is the only approach in place at present assessing potential impacts in the
marine environment, linking the land to the sea.

Recommendation 2
Continue the collaborative arrangement with ECU, Department of Biodiversity,
Conservation and Attractions, GeoCatch and the Water Corporation to coordinate,
fund and undertake seagrass monitoring. This is a very effective and beneficial
arrangement.

Recommendation 3
The funding for this program has ceased and there will be ten years of data. Long-
term information on the health of our ecosystems is highly valuable, enabling
managers to assess the effects of management actions as well as local (e.g. anchoring)
and global scale (e.g. temperature increases from climate change) pressures. However,

                                                                                           8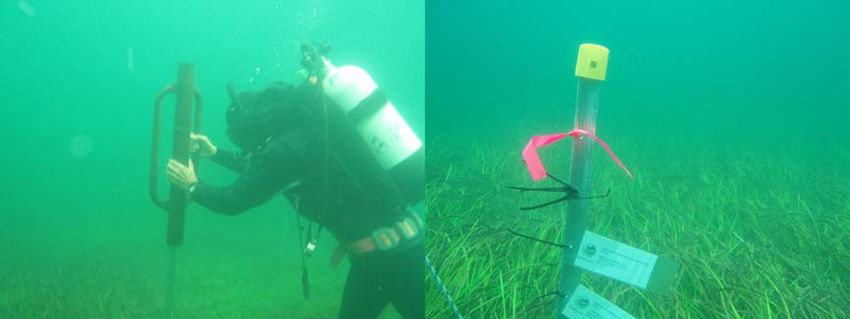
this needs to be balanced with other constraints (e.g. funds, time, logistics) and
priorities. Therefore, a reassessment of the program is warranted with the key
stakeholders to identify the needs and priorities of this program and develop a plan for
the future, beyond the current funding.

Recommendation 4
It has been 13 years since seagrass extent mapping was undertaken in Geographe Bay.
This is important and complimentary information for this program and it has been
recommended to undertake it on a five yearly basis (McMahon 2012). Clearly this has
not occurred and should be considered as a priority and included in discussions
regarding the plan for this program into the future.

2 Introduction
This document is produced for GeoCatch by Kathryn McMahon and Natasha Dunham
from Edith Cowan University. It reports on the Keep Watch seagrass monitoring
survey that was undertaken in February 2021 and compares to data from the 2012-
2020 surveys. The objective for the Keep Watch program is to undertake long-term,
cost-effective seagrass monitoring for Geographe Bay to monitor the effects of
water quality, particularly catchment nutrients on seagrass distribution and health.

This year the program was funded through collaborative sponsorship from the Water
Corporation and in-kind support from the Department of Biodiversity, Conservation
and Attractions (DBCA). The aim of this program is to assess seagrass health by
examining changes over time. There are three triggers that have been developed to
assess change (see 3.1.3 for summary of triggers). This report includes data on two
seagrass species (Posidonia sinuosa and Amphibolis antactica) but the program
mostly focuses on P. sinuosa shoot density and leaf tissue nutrients (C, N, P and N
isotopes) from seven sites with leaf tissue nutrient data for A. antarctica seagrass from
three sites. All raw data is included in the appendix to this report, and has been
submitted to GeoCatch as a digital file.

3 Methods for Keep Watch – Seagrass health
  monitoring program
3.1 Seagrass monitoring
3.1.1 Field program
The “Keep Watch” annual seagrass monitoring program is based on the methods
recommended by McMahon (2012) and agreed to by GeoCatch. Eight seagrass sites
were monitored, seven for P. sinuosa health (Dunsborough to Forrest Beach) and four
for A. antarctica nutrient content (Table 1, Figure 1). These were chosen to cover the
spatial range of P. sinuosa meadows in Geographe Bay, and areas associated with a
variety of catchments with different known surface water nutrient inputs. They range
from 4-5 m depth. All sites, except for Capel have P. sinuosa meadows. Sampling
occurred from 8th to the 11th February 2021. At Capel (8) there are high relief rocky
reefs surrounded by bare sand. On the reef there are patches of A. antarctica seagrass

                                                                                         9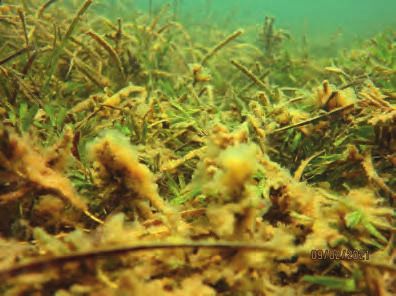
that were collected for nutrient analysis in 2m depth. A. antarctica has been collected
at Busselton Jetty (4) and Forrest Beach (7) sites as a comparison to Capel (8) for 9
years (2013-2020). This year Amphibolis samples were also collected at Vasse
Diversion Drain (3). This was undertaken because the abundance of A. antarctica at
Busselton Jetty (4) was low and it is not recommended to continue sampling this
species at this site into the future. In 2017 there was dieback of A. antarctica
observed at Busselton Jetty and no recovery into these patches has been observed.
Therefore Vasse Diversion Drain which has large patches of A. antarctica is an
appropriate survey site into the future for this species. Collecting at both sites this
year enables comparison between these two sites. The data for these samples are
included in the Appendix 5.
Table 1: Details for eight Keep Watch sites, seven in Posidonia sinuosa meadows (1-7) and one in
rocky reef with Amphibolis antarctica patches (8) in Geographe Bay. Coordinates are decimal degrees
based on the WGS84 grid system. The replicate number was reduced this year due to removal of
some data due to quality control issues.
Site Name & # Coordinates Depth (m) Date Species Rep
assessed
1. Dunsborough S 33.61654°, E 115.12865° 4 11/2/2021 Ps 25
2. Buayanup S 33.65233°, E 115.24840° 4 11/2/2021 Ps 23
3. Vasse Diversion Drain S 33.64746°, E 115.32379° 4.5 10/2/2021 Ps, Aa 21
4. Busselton Jetty S 33.63896°, E 115.34315° 4.5 10/2/2021 Ps, Aa 23
5. Port Geographe S 33.62846°, E 115.38240° 4.5 09/2/2021 Ps 20
6. Vasse-Wonnerup S 33.60188°, E 115.42345° 5 10/2/2021 Ps 22
7. Forrest Beach S 33.57295°, E 115.44908° 5 09/2/2021 Ps, Aa 20
8. Capel S 33.51394°, E 115.51508° 2 08/2/2021 Aa
8. Capel
7. Forrest Beach
1. Dunsborough 6. Vasse-Wonnerup Estuary
4. Busselton
Jetty 5. Port Geographe
2. Buayanup
3. Vasse Diversion Drain
Dunsborough
Busselton
Figure 1: Map of Geographe Bay, showing the location of the 8 seagrass sampling sites (1.
Dunsborough, 2. Buayanup, 3. Vasse Diversion Drain, 4. Busselton Jetty, 5. Port Geographe, 6. Vasse-
Wonnerup Estuary, 7. Forrest Beach and 8. Capel).
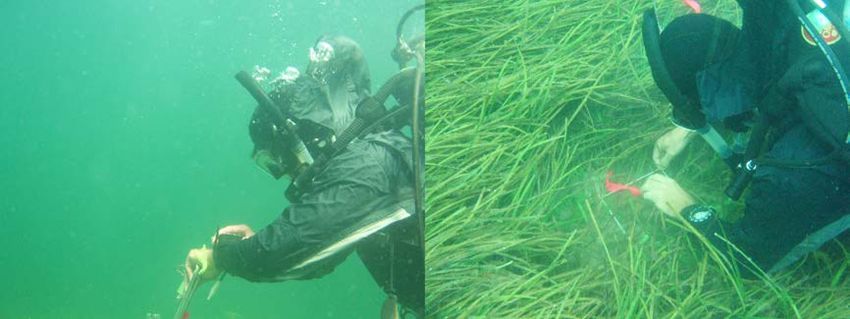
Each seagrass site was located at least 30 m from the edge of the meadow and the
center of the 50 m diameter site marked with a permanent star picket with a plastic
cap (Figure 2). A site label was attached to the star picket. The exact locations were
10determined with a differential GPS (using the WSG 84 grid system), on the water
surface, directly above the permanent marker.
Figure 2: Left: Banging in permanent marker with pole driver. Right: Star picket with cap and plastic
coated site label, indicating center of 50 m diameter Keep Watch seagrass site.
At each site P. sinuosa shoot density was counted in 30 0.2 x 0.2 m quadrats. Only
shoots that originated in the quadrat were counted. Seedlings of P. sinuosa were also
counted; these were identified by the small size of the leaves and the seed that was
still attached to the seedling. As it is predicted that there can be high mortality of
seedlings, these counts were not included in the shoot density assessment. The
position of each quadrat was located randomly using a transect tape swum out on a
pre-determined bearing using a compass and the quadrat placed at the pre-determined
distance along the transect (Figure 3, See Appendix 1 for the bearing and distance
along each transect that the quadrats were positioned). If there was a patch of a
different species of seagrass such as Amphibolis antarctica or A. griffithii, or a blow-
out without seagrass, then the quadrat was moved to the next closest point along the
transect in the P. sinuosa meadow. The quadrats were stabilised by securing to the
sediment with tent pegs, to ensure they did not move during counting.
Figure 3: Left: Determining bearing of transect with compass. Right: Counting P. sinuosa shoots in a
quadrat.
A quality assurance check was carried with all divers before official counts began.
Each counter counted a quadrat twice, and this was done with three different quadrats.
This was repeated until there was less than a 5% error with counting, i.e. a maximum
difference of 1-3 shoots. Then official counting began. Despite quality checks being
11carried out, this year after the second day when data was entered it was noted that one
diver had much lower shoot counts than all other divers (Appendix. A second quality
check was carried out and this diver was not within the 5% error margin. Therefore it
was decided to remove this diver’s data from the annual counts due to uncertainty
with the accuracy. This resulted in the replicates reducing from 30 per site to 20-25
(Table 1).
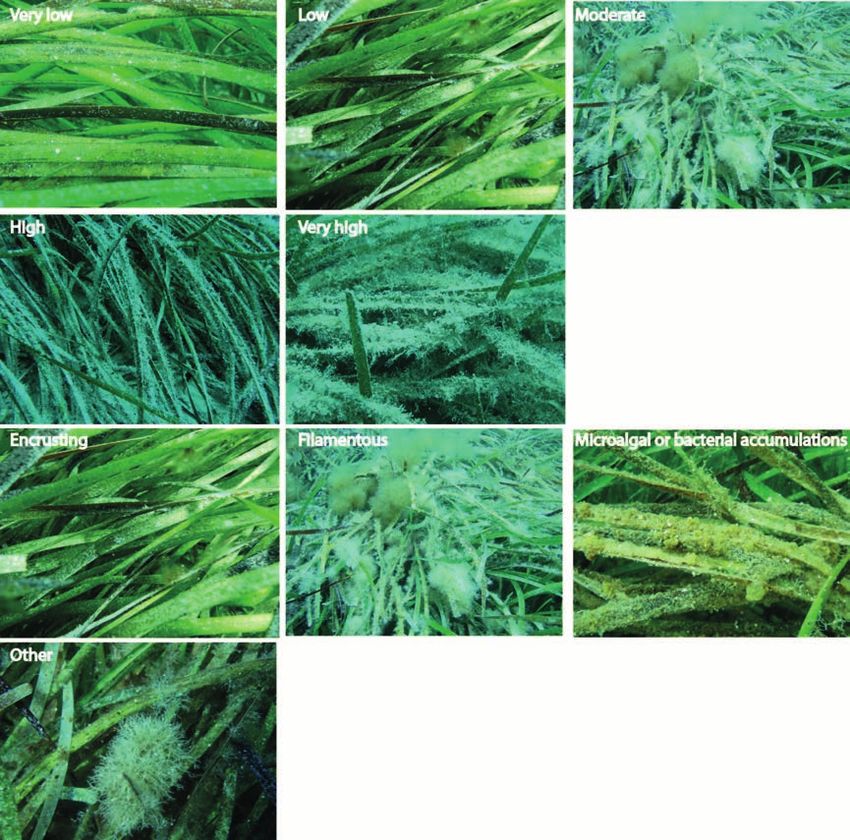
In addition, a photograph of the seagrass meadow and a video in a circle around the
star-picket, 5 m distance away from the star-picket was also taken at each site. As
well as the cover of algal epiphytes recorded as Very Low, Low, Moderate, High,
Very High (See photo-guide for visual representation of these classifications, Figure
4), and the dominant or co-dominant type of algal epiphytes at each site were
recorded from observations of the seagrass leaves, based on the following categories:
Filamentous algae; Encrusting algae; Microalgal accumulations; and Other epiphytic
algae (any type of algae that is not as above such as erect, branched, foliose, leathery
or jointed calcareous). A photograph of the dominant epiphytic algae was also taken.
Figure 4: Classification of epiphytic algal cover and type.
12Finally, the following points were noted: if other seagrass species were present at the site; if there were any bare patches of sand within the meadow, and if there was rhizome in the sand, indicating a loss of shoots from the area. Movement of sand bars through the seagrass meadow is common in this area, so it is likely that these will be noted; and any signs of anchor damage in the meadow. Also three samples of P. sinuosa seagrass shoots were collected for TN, TP and TC as well as nitrogen stable isotope analysis after the counting was completed. Each sample was collected randomly in the meadow, just outside the 50 m diameter of the site and consisted of 5 shoots. These were placed in separate plastic bags and frozen until processed. Three samples of A. antarctica stems and leaves were collected at Capel, Forrest Beach, Busselton Jetty and Vasse Diversion sites for the same type of nutrient analysis. At each site the Secchi disk depth (m) and temperature were recorded from the boat. In addition temperature loggers in-kind from ECU were installed at the seven Posidonia sites to collect local temperature data. These will be switched out every six months. Field work was carried out by Kathryn McMahon (KM) and Ankje Frouws (AF) from ECU with Eden Baxter (EB), Ben French (BF) and Caprice Hyde (CH) from Department of Biodiversity, Conservation and Attractions. Samples were processed and data analysed by Natasha Dunham. The boat and tank fills were provided by Department of Biodiversity, Conservation and Attractions. The monitoring program was funded through sponsorship by Water Corporation. 3.1.2 Laboratory processing In the laboratory the three seagrass shoot samples were measured for total length and width, just above the sheath. Then all algal epiphytes were removed by gently scraping, and the leaves placed in the oven at 60°C for 24 hours or until dry, then ground into a fine powder with a Ball Mill grinder. This material was then analysed for total C, N and δ15N (external error of analysis 1 standard deviation) at ECU using a continuous flow Thermo Scientific™ EA IsoLink™ IRMS system consisting of a Flash IRMS Elemental Analyzer, Delta V Advantage IRMS and Conflow IV Univeral Interface. Total phosphorus (
3.1.3 Trigger assessment
To assess change over time, and to keep watch on the health of the seagrass, three
triggers proposed by McMahon (2012) and agreed upon by GeoCatch were used. If
these thresholds are triggered it indicates a potential issue with seagrass health at a
particular site that warrants further investigation. These trigger values are for shoot
density. All other information collected i.e. seagrass nutrient concentration, water
quality and algal cover are complimentary information to help interpret any changes
observed in the seagrass shoot density. The trigger value will be triggered as follows:

Trigger 1:
If there is a > 50% reduction in shoot density at a particular site compared to the
previous year (Need 2 years of data to assess this, always compare the current year with
the previous year).

Trigger 2:
If there is > 20% reduction in shoot density at a particular site compared to the previous
year, two years in a row (Need 3 years of data to assess this).

Trigger 3:
If there is a significant trend of a reduction in shoot density at a particular site over all
time periods, as determined by trend analysis (Makesens Mann-Kendall trend statistic,
need at least 5 years of data to assess this).

4 Results
4.1 Shoot density
Shoot density varied from a site average of 932-1692 shoots m-2 across the seven sites
(Figure 5). As has been consistent over the life of the program, Dunsborough and
Buayanup had the highest shoot density and Vasse Diversion the lowest. The
remaining sites ranged between 1037-1211 shoots m-2. All raw data is in Appendix 2.

Compared to last year where three sites decreased in shoot density by up to -19% and
the remaining sites had slight increases (between 8 - 17%), this year most sites
declined: Busselton Jetty and Port Geographe (-8%), Vasse Wonnerup (-14%), Vasse
Diversion (-23%) and Forrest Beach (-29%). However, two sites increased slightly:
Buayanup (6%) and Dunsborough (11%) (Table 2). The sites with the greatest
declines (Vasse Diversion, Forrest Beach) had been on a trajectory of increasing shoot
density up until this year (Figure 5, Appendix 4). Since the first year of monitoring
there has been net 17% increase in shoot density at Vasse Diversion but a -13%
decline at Forrest Beach. Busselton Jetty (23%), Port Geographe (35%) and Vasse
Wonnerup (20%) continue to show the greatest net increases since the start of the
program. Interestingly the variations over time continue to be site specific, with little
consistency among sites (Appendix 4).

Compared to other seagrass meadows in the state, all monitoring sites in Geographe
Bay are well above the minimum average site shoot density. Dunsborough and

                                                                                            14
Buanyanup are also above the maximum average site shoot density (1 220 m2) and the
remaining sites in Geogrpahe Bay are just below the maximum, except for Vasse
Diversion which is 300 shoot m-2 below the maximum (Figure 5, Data Courtesy of
DBCA from equivalent monitoring programs in the the Shoalwater Bay and Jurien
Bay Marine Parks).
P. sinuosa average shoot length ranged from a minimum of 35 cm at Dunsborough to
a maximum of 93 cm at Vasse Wonnerup and a range in width of 5.4-6.5 mm
(Appendix 3).
Table 2: Change assessment based on Trigger 1 and 2. There is a concern with seagrass health when
there is a 50% decline in shoot density from one year to the next (Trigger 1) or when there is more
than a 20% decline two years in a row. A negative number indicates a decline in shoot density and
orange shading is a decline of more than 20%.
% change in shoot density
Site Name & # 12-13 13-14 14-15 15-16 16-17 17-18 18-19 19-20 20-21 12-21
1. Dunsborough 3 -18 7 9 -3 -10 5 8 11 14
2. Buayanup 11 -24 20 -7 2 -5 15 -11 6 8
3. Vasse Diversion 6 -8 0 -15 19 12 8 17 -23 17
4. Busselton Jetty 0 22 -4 1 -1 -5 23 -6 -8 23
5. Port Geographe 17 -7 12 -6 -23 41 28 -19 -8 35
6. Vasse-Wonnerup 19 13 -4 -3 4 -5 13 -3 -14 20
7. Forrest Beach 16 -23 2 5 -3 8 0 11 -29 -13
15Figure 5: Shoot density (average m-2 ± se) at the seven Keep Watch seagrass monitoring sites with P.
sinuosa meadows in January or February 2012-2021. Black lines indicate the minimum and maximum
site averages from the reference sites at 3-5 m in Shoalwater Bay and Jurien Bay Marine Parks from
2012-2020 (data courtesy of DBCA, 2021).
4.2 Trigger assessment
4.2.1 Trigger 1
As a decline of 50% was not detected at any of the seven sites, this threshold was not
triggered (Table 2, % change 2020-2021).
4.2.2 Trigger 2
As there were no declines of 20% or more over two consecutive years this threshold
was not triggered (Table 2, % change 2019-2020 & 2020-2021). Although it would be
recommended to assess both Forrest Beach and Vasse Diversion Drain in 2022 for
Trigger 2 as they are sites that could breach this trigger next year due to the 29% and
23% decline respectively in 2021. Over the entire monitoring program (2012-2021)
declines of 20% or more have only occurred in three years but not consecutively,
2013-14 (two sites), 2016-17 (one site) and 2020-21 (two sites). This has generally
occurred only once at these sites, with the exception of Forrest Beach where it has
occurred twice, this year and in 2013-14.
164.2.3 Trigger 3
No sites showed a significant linear trend over the ten years, nither increasing or
decreasing in shoot density (Table 3). When the plots of individual sites are examined
(Appendix 4), linear increases in shoot density are obvious at a few sites but only over
a subset of the years. For example, Dunsborough has a linear increase in shoot density
from 2018 to 2021, Vasse Diversion from 2016 to 2020 and Port Geographe from
2017-2019 followed by a steady decline since (Appendix 4). Forrest Beach has a
steady increase in shoot density from 2014 to 2020 with this year's average density
decreasing sharply to densities below the original recording in 2012 (Appendix 4).
Table 3: Mann-Kendall Trend statistic to assess if there has been a significant decline over time in
shoot density from 2012-2021.
Site Name & # Significance Overall slope R2
(pTable 4: Algal cover at the Keep Watch seagrass monitoring sites, 2012-2021. Algal cover categories
were Very low, Low, Moderate, High and Very High. Algal types were F=filamentous, E= encrusting,
M=microalgal aggregations and O=other. If the category is capitalised it means it is dominant,
lowercase indicates present but not dominant.
Site Algal cover
-12 -13 -14 -15 -16 -17 -18 -19 -20 -21
1. Dunsborough M L M M L L M M M L
2. Buayanup M L M M H H M VL H H
3. Vasse Diversion Drain L M H H H H H L H H
4. Busselton Jetty L L H H M M M L H H
5. Port Geographe L VL L L M M M L M M
6. Vasse-Wonnerup L VL L M L L L VL L M
7. Forrest Beach L VL L L L VL L VL L L
Algal Type
-12 -13 -14 -15 -16 -17 -18 -19 -20 -21
1. Dunsborough O,f,m F,O O O,m O O,e,m O,m O,m O,m O
2. Buayanup M,o E,O M,o M,o M,o M,e,o M,o O,m M,o,e M,o
3. Vasse Diversion Drain M,o E,O M,o M,o M,o M,o M,o O,m M,o,e,f M
4. Busselton Jetty M,o O M M,f O,e,m M,o,e O,M O,m O,m,e,f M
5. Port Geographe E, o E,M M,e M,f O, f M,o,e O,M M M,o M,o
6. Vasse-Wonnerup E, o, m E,O M,f O E,o,m E,m O,M O O,e M
7. Forrest Beach E, M,o F,E M,f O,e E,o E,o O,e O E,m,o O
18Site 1: Dunsborough Site 2: Buayanup Site 3: Vasse Diversion
Site 4: Busselton Jetty Site 5: Port Geographe Site 6: Vasse Wonnerup
Site 7: Forrest Beach
Figure 6: Pictures of seagrass meadow and the dominant algal epiphytes at each P. sinuosa site. (1.
Dunsborough, 2. Buayanup, 3. Vasse Diversion Drain, 4. Busselton Jetty, 5. Port Geographe, 6.
Vasse-Wonnerup Estuary, 7. Forrest Beach)
4.4 Other observations
A. antarctica was observed at all sites except Buayanup and Vasse Wonnerup,
although it was had very low abundance at Busselton Jetty. A. griffithii was also
growing at Forrest Beach and Capel. Seedlings were observed at most sites this year,
Dunsborough, Buayanup, Busselton Jetty, Vasse Wonnerup and Forrest Beach. No
anchor damage was observed at any site and blowouts remain at the Dunsborough
site, most likely from water movement. Bare or sparse patches were noted at
19Buayanup, Busselton Jetty and Port Geographe indicating historical and some small
scale recent shoot loss. The bare patches at Port Geographe are still present, and the
patches of dieback that were observed at Busselton Jetty three years ago appear
smaller indicating recovery into the patches by Posidonia, but they are still
discernable.
Most sites had accumulations of wrack either under the canopy (Dunsborough, Port
Geographe, Forrest Beach), on top of the seagrass canopy (Buayanup, Vasse
Diversion) or in sand patches on the edge of the meadows (Vasse Diversion,
Dunsborough). The white tips on the long leaves at Dunsborough remain, most likely
from sun damage due to the shallow and very clear water at this site (Figure 7).
Figure 7: White tips of leaves obvious at Dunsborough around the diver counting the shoot density.
The weather during this sampling was overcast, rough and colder than normal which
is indicated in the clarity of some of the images (Figure 6).
4.5 Nutrient content
The nutrient data for 2020 and 2021 was calibrated based on the analytical checks
carried out this year after switching analytical laboratories. Therefore the values
reported from 2020 in this report, are slightly less than those reported in the 2020
annual report (Appendix 5). The nitrogen content of P. sinuosa leaves ranged from
0.4-0.7 % N dry weight (DW), very similar to the range observed in 2019 and a
slightly lower maximum than 2020 (Figure 8). For all sites except Busselton Jetty
there was a slight decrease in concentration compared to last year (Figure 8). The
nitrogen content of A. antarctica leaves was higher, ranging from 0.7-1.3% N DW,
with the highest concentration at Capel (1.4-1.8x higher than the other sites). There
20continued to be a slight increase in nitrogen content Busselton Jetty and Forrest Beach
compared to 2019 and 2020 (Figure 9). There was a decrease at Capel from 1.7 % N
DW in 2020 to 1.3 % N DW, similar to concentrations observed in 2017 and 2018.
The phosphorus content of P. sinuosa leaves in 2021 ranged from 0.16-0.22% P DW
(Figure 8). Three sites, Bussleton Jetty, Vasse Wonnerup and Forrest Beach increased
slightly compared to last year (~0.03 % DW) and at some sites there was a high
variability between samples. For A. antarctica leaves, the phosphorus content ranged
from 0.15-0.19% DW and on average there was a slight increase from last year
(Figure 9). Busselton Jetty has a slightly higher phosphorus content and Capel is
clearly similar to Forrest Beach. All raw data is in Appendix 5.
The A. antarctica samples collected fromVasse Diversion for the first time this year
was 0.9 ± 0.03% N DW and 0.14 ± 0.03% P DW. This is similar to Busselton Jetty
for %N but slightly less for %P.
The nitrogen and phosphorus concentrations continue to be in the range that has been
observed in Geographe Bay in the past and these levels are not considered high (Table
5).
Table 5: Comparison of shoot tissue nutrient concentrations and δ15N values of P. sinuosa and A.
antarctica leaves in Geographe Bay. Data are expressed as averages of all sites from the study with
the range of observations in brackets, min-max.
Date Study P. sinuosa A.
collected antarctica
TN TP δ15N TN TP δ15N
(% DW) (% DW) (% DW) (% DW)
1994/95 (McMahon & Walker 0.8 Jan 0.13 - - - -
Apr, Jan 2008) 1.032 Apr
Geographe Bay
1994 (McMahon 1994) 1.26 0.18 3.30 0.95 0.10 2.52
Apr, Jul, Geographe Bay (0.06-1.66) (0.9-0.28) (2.61-5.24) (0.79-1.14) (0.07-0.14) (0.8-4.18)
Sep
2008 (Oldham et al. 2010) 1.43 - 3.66 0.97 - 4.51
Aug Geographe Bay (1.30-1.56) (3.30-4.36) (0.9-1.16) (4.01-4.8)
Autumn (Paling & McComb 1.8 - - 0.6 - -
2000)
Shoalwater Bay
Summer (Collier et al. 2008) 1.2-1.4 - -
2003 Cockburn Sound
Autumn (Hyndes et al. 2012) - - 4
2008 Warnbro Sound
21Figure 8: Nitrogen and phosphorus content (% DW) of P. sinuosa leaves (Dunsborough-Forrest Beach)
at the Keep Watch Posidonia seagrass monitoring sites in 2012-2021.
22Figure 9: Nitrogen and phosphorus content (% dw) of A. antarctica leaves (average ± se) at the Keep
Watch Amphibolis seagrass monitoring sites in 2013-2021.
Nitrogen isotope signals can indicate the main sources of nitrogen seagrasses are
accessing. Nitrogen derived from the fixation of atmospheric nitrogen or agricultural
fertilisers has a signature close to 0‰. Nitrogen derived from native bushland has a
signal between 2-5 ‰, whereas nitrogen derived from animal waste or septic tanks is
usually in the order of 5-6 ‰ and nitrogen from treated sewerage is usually around 9
‰ (Jones & Saxby 2003). In Geographe Bay, nitrogen isotope signals measured in
seagrass leaves indicate that the meadows are accessing different sources of nitrogen,
and these sources vary among sites.
23The δ15N of P. sinuosa leaves ranged from 0.38 to 1.9 ‰. δ15N signals are lower than
last year at Dunsborough, Buayanup, Vasse Diversion and Port Geographe and
increased slightly at Busselton Jetty, Vasse Wonnerup and Forrest Beach but
remained within the range observed over the last nine years (Figure 10). The nitrogen
isotope signals in the seagrass leaves indicate that this year seagrasses are mostly
receiving a mix of sources, but the main sources could be either from fixation of
atmospheric nitrogen or agricultural fertilisers, as the signal is close to 0‰ with other
sources contributing a small amount. There is no evidence that nitrogen derived from
treated sewerage is the main source for seagrasses, if this was the case, we would
expect the signal to be much higher, around 9 ‰.
The δ15N signal of Amphibolis leaves ranged from 1.4-2.8‰, increasing slightly at
Forrest Beach and Busselton Jetty but decreasing at Capel compared to last year
(Figure 10). Once again the highest values were observed at Capel indicating a
different source of nitrogen at this site. The δ15N signal of Amphibolis leaves at Vasse
Diversion site was 1.0 ± 0.8‰, slightly lower than the Busselton Jetty site. All raw
data is in Appendix 5.
24Figure 10: δ15N of P. sinuosa leaves (Site 1-7) and A. antarctica leaves (Site 4, 7 & 8 average ± se) at
the Keep Watch seagrass monitoring sites in 2012-2021. Note that only Capel was measured in 2012,
and is not included in these graphs.
254.6 Water quality
Water temperature at the Keep Watch seagrass sites ranged from 20-21.4°C, lower
than previous years. Water clarity was similar to 2020 observations at Port
Geographe, Vasse-Wonnerup and Forrest Beach where the Secchi disk was observed
on the bottom but at all other sites the Secchi disk was not visible on the bottom and
ranged from 3.1-3.4 m. All other sites water clarity was lower (Table 6).
Table 6: Water quality measures at the Keep Watch seagrass monitoring sites from 2012-2021,
*=Secchi disk depth on bottom.
Site Secchi disk depth (m)
2012 2013 2014 2015 2016 2017 2018 2019 2020 2021
1. Dunsborough 4.2* 3 3 3.2* 3* 3.5* 2.7 2.7 4.0* 3.3
2. Buayanup 3.5 2.5 3* 3.2* 3.5* 2.5* 3* 2.8 3.5* 3.2
3. Vasse Diversion 4 3.25 3.5* 3.6* 3.5* 5* 3.3 3 3.5* 3.4
Drain
4. Busselton Jetty 4.2 2.5 3.5 3.6* 3.5* 2.5* 4* 2.9 3.5* 3.1
5. Port Geographe 3.75 2.5 4 4.1* 3.5 4.5* 3.5* 3.2 3.0* 4.5*
6. Vasse-Wonnerup 4 2 4.5 4.6* 4.5* 4* 4.5* 4 4.5* 5.4*
7. Forrest Beach 5* 2 4 4.2* 4.5* 4* 3.5 3.8 4.5* 5*
Temperature (°C)
2012 2013 2014 2015 2016 2017 2018 2019 2020 2021
1. Dunsborough 22 22.5 23.1 23.3 22.9 22.5 21.2 20.6 23.5 20.0
2. Buayanup 22.8 22.6 23.5 25.2 23.7 22.8 21.7 21.7 24.4 20.1
3. Vasse Diversion 23.4 23.8 23.5 24.5 23.9 22 22.1 21.7 24.7 20.9
Drain
4. Busselton Jetty 23.4 27.3 23.3 26.3 22.6 22.5 22.6 22.8 23.6 20.9
5. Port Geographe 23.4 25.5 23.3 24.3 23 22.5 22.3 22.8 23.7 20.9
6. Vasse-Wonnerup 23.1 28.4 22.2 26.1 22.3 22.3 21.9 21.6 23.6 21.2
7. Forrest Beach 22.5 23.5 22.1 25.1 23.3 22.5 21.5 21.7 24.0 21.4
5 General conclusions
5.1 Modest declines in shoot density at some sites
No management criteria were triggered in 2021 for all three triggers. Two sites, the
most westerly ones near Dunborough increased slightly in shoot density, however the
remaining five sites declined, with two, Vasse Diversion and Forrest Beach declining
more than 20% activating the first part of Trigger 1. In 2022, this will need to be
assessed to ascertain whether another 20% decline has occurred which would result in
a breach of Trigger 1. The other sites that declined were between Vasse Diversion and
Forrest Beach, but here the declines were lower, < 15%. Although most sites declined,
apart from Forrest Beach, the fluctuations are within the ranges observed over the last
ten years. It is recommended to continue monitoring to keep track on the condition of
the meadows.
Since the start of the monitoring program there have been fluctuations in shoot
density, but none that have breached any triggers. The timing of minimum shoot
density has varied between sites. For example 2012 for Busselton Jetty and Vasse
26Wonnerup, 2014 for Dunsborough and Buayanup and this year for Forrest Beach
(Figure 11). This indicates that regional-scale processes are unlikely driving the
minimum densities. However, due to more consistent timing of maximum shoot
densities, 2018 and 2019 at most sites, regional-scale processes may be influencing
maximum abundance (Figure 11). Intermediate shoot densities for all sites tended to
occur between 2015 and 2018.
In the context of these small to modest fluctuations the shoot density of Posidonia in
Geographe Bay, is higher or close to the maximum densities observed compared to
other locations in south-west WA where similar monitoring programs by Department
of Biodiversity, Conservation and Attractions. Based on this set of information, there
continues to be no major concerns for seagrass health in Geographe Bay. The
recommendation is to continue monitoring and reassess changes next year.
Site 2012 2013 2014 2015 2016 2017 2018 2019 2020 2021
1. Dunsborough 62 64 52 56 61 59 53 56 61 68
2. Buayanup 59 66 50 60 57 58 55 63 56 60
3. Vasse Diversion Drain 34 37 34 34 29 34 38 41 48 37
4. Busselton Jetty 38 38 46 44 45 45 43 52 49 45
5. Port Geographe 39 46 42 47 45 35 49 62 50 46
6. Vasse-Wonnerup 38 45 51 49 48 50 47 53 51 44
7. Forrest Beach 53 61 47 48 50 49 53 52 59 42
Figure 11: Heatmap of changes in average shoot density of P. sinuosa over time, 2012-2021, at
each Keep Watch seagrass monitoring sites. The colouring of the heatmap is allocated on a site by
site basis to show the times of low and high shoot density in a site.
5.2 Algal epiphyte cover increases in 2020
Epiphytes are important components of seagrass ecosystems, contributing to primary
production, food and habitat for fauna. The algal epiphyte cover remains at the high
levels that were recorded in 2020, with three sites recording a high cover category
(Figure 12). The amount of epiphyte cover on seagrasses is promoted by nutrients, but
unlike 2020, there is no evidence that seagrasses have had higher exposure to nitrogen
based on the seagrass leaf nitrogen content. Previously higher epiphyte cover was
associated with greater loads of nutrients entering Geographe Bay and intermediate
surface water temperatures (McMahon and Dunham 2019). As higher algae cover
over extended periods of time can lead to stress on seagrasses, it is a concern that this
high cover is persisting. However, there is not a direct correlation between the amount
of epiphyte cover and seagrass decline across all sites in Geographe Bay. Vasse
Diversion drain did have high algal cover this and last year and saw a 23% decline
this year in shoot density, whereas Forrest Beach with a 29% decline in shoot density
this year had low epiphyte cover for the last two years. This re-iterates that the drivers
of low shoot density are linked to local rather than regionl-scale processes and the
drivers may vary between sites. Vasse Diversion drain is more protected than Forrest
Beach and algal cover is more likely to build up over time, whereas at Forrest Beach
due to the higher wave energy (Oldham et al 2010) there may be more loss of shoots
due to physical disturbance.
The dominant algal types observed in Geographe Bay this year and over the ten years
of the program, microalgal accumulations are not those commonly associated with
nutrient enrichment. However, Master’s student Connor Campbell investigated
27whether nutrient inputs from the drains discharging into Geographe Bay near seagrass
meadows may influence the type of microalgal accummulations on seagrass leaves.
He found that that there was no consistent pattern in the abundance and composition
of microalgal communities with distance away from drains over small spatial scales
(100’s m’s), but the microalgal community on seagrasses varied between the different
drainage systems. The microalgal community near drains with the highest nutrient
loads, in this case Vasse Diversion Drain, had the highest biomass and a higher
abundance of taxa typically found within nutrient rich or polluted environments
(Campbell 2020). This finding provides evidence that the microalgal communities can
increase with greater exposure to nutrients and further supports the concern of
persistent higher microalgal epiphyte cover on seagrass meadows in Geographe Bay.
The areas with higher cover are also in the most protected parts of Geographe Bay
(Oldham et al 2010), and as idenitifed above, could interact to enhance the
accumulation of these microalgal communities. The relationship between seagrass
density, algal cover, nutrient loads and other factors that influence the condition of the
seagrass ecosystems such as temperature and wave energy is something to investigate
further as part of the review and reassessment of this program.
2012 2013 2014 2015 2016 2017 2018 2019 2020 2021
1. Dunsborough 3 2 3 3 2 2 3 3 3 2
2. Buayanup 3 2 3 3 4 4 3 1 4 4
3. Vasse Diversion Drain 2 3 4 4 4 4 4 2 4 4
4. Busselton Jetty 2 2 4 4 3 3 3 2 4 4
5. Port Geographe 2 1 2 2 3 3 3 2 3 3
6. Vasse-Wonnerup 2 1 2 3 2 2 2 1 2 3
7. Forrest Beach 2 1 2 2 2 1 2 1 2 2
Figure 12: Heatmap of changes in average shoot density of P. sinuosa over time, 2012-2021, at
each Keep Watch seagrass monitoring sites. The colouring of the heatmap is allocated on a site by
site basis to show the times of low and high shoot density in a site.
5.3 Nitrogen exposure is low and no obvious changes in the sources
The concentration of nitrogen in seagrass leaves tissue has declined slightly this year
in contrast to the slight increase last year, and for phosphorus there has been a slight
increase. But, overall the nutrient concentrations are very low and do not indicate
exposure to excess nutrients. The only site that over the last ten years has consistently
stood out from the other sites is Capel, with higher nitrogen content and nitrogen
isotope values indicating that these meadows are receiving more and a different
source of nitrogen compared to other sites. The main potential nitrogen sources based
on the higher nitrogen isotope signal (2.8 ‰) indicate nitrogen derived from animal
wastes or septic tanks or sources from natural vegetation. Despite the higher nitrogen
content at Capel the lower phosphorus levels were maintained, indicating that there
continues to be less exposure to phosphorus compared to earlier years.
Although the work by Campbell (2020) shows that the microalgal abundance on
seagrass leaves is greater in seagrass meadows near drains that discharge higher loads
of nutrients and the nutrient levels in the leaves are also higher, this pattern is not
realised in the Keep Watch Program over the ten years of data. If this was the case,
then you would expect higher algal cover where the nitrogen concentrations in
seagrass shoots are higher. Even when this assessment is restricted to the central sites
28where the majority of the drains are located (Vasse-Diversion to Port Geographe),
there is no relationship between seagrass nutrient content and algal cover.
2012 2013 2014 2015 2016 2017 2018 2019 2020 2021
1. Dunsborough 0.68 0.51 0.95 0.43 0.46 0.45 0.64 0.59 0.59 0.41
2. Buayanup 0.92 0.45 1.06 0.55 0.70 0.59 0.60 0.67 0.82 0.70
3. Vasse Diversion Drain 0.58 0.39 0.95 0.47 0.73 0.65 0.54 0.63 0.72 0.56
4. Busselton Jetty 0.64 0.44 0.81 0.50 0.55 0.42 0.42 0.44 0.49 0.50
5. Port Geographe 0.74 0.60 1.12 0.49 0.92 0.65 0.72 0.69 1.05 0.63
6. Vasse-Wonnerup 0.60 0.39 0.93 0.43 0.52 0.51 0.47 0.38 0.63 0.44
7. Forrest Beach 0.64 0.47 0.92 0.39 0.51 0.43 0.66 0.53 0.71 0.66
Figure 12: Heatmap of changes in P. sinuosa average shoot nitrogen content over time, 2012-2021,
at each Keep Watch seagrass monitoring site.
5.4 A reflection of 10 years of Keep Watch seagrasses monitoring in
Geographe Bay
Now there is 10 continuous years of annual seagrass monitoring data for the dominant
seagrass, Posidonia sinuosa in Geographe Bay in relation to the threat of nutrient
enrichment. This is a significant achievement as long-term information on the health
of our ecosystems are highly valuable, enabling managers to assess the effects of
management actions as well as local (e.g. anchoring, catchment management) and
global scale (e.g. temperature increases from climate change) pressures. In this
context, the data collected is valuable for linking the extensive catchment
management activities to reduce nutrient loads reaching the waterways of the
Geographe catchment and it’s coastal waters and assessing the condition and trends of
the valued seagrass meadows, a key assest of the Ngari Capes Marine Park. The
temperature data collected by DBCA and the recent installation of temperature
loggers at each site will enable interrogation of warming and heatwaves at a site
specific scale into the future. This is highly relevant due to the significant impacts that
have occurred to temperate seagrasses in Shark Bay linked to heat wave events
(Strydom et al 2020). Declines in shoot density have also been observed in Perth
waters and Jurien Bay and the hypothesis that this is associated with warming (Fraset
et al 2019, DBCA unpublished data). In collaboration with relevant stakeholders
(Water Corporation, DWER, DBCA, Fisheries, GeoCatch) a reassessment of the
program is warranted to ensure the program is meeting the priorities of stakeholders,
identify any further information needs and develop a plan for the future, beyond the
current funding.
At this point in time, the Keep Watch seagrass monitoring program does not have a
contract in place to continue the monitoring into the future in its current form.
However, there is support for it continue from ECU, GeoCatch, Water Corp and
DBCA. Both DBCA and WaterCorp have a vested interest to continue this program to
meet their reporting needs. The collaborative field partnership with DBCA enables the
Keep Watch monitoring sites to be included in DBCA monitoring program as well as
reporting for GeoCatch’s needs. In addition, there is a broader program with DBCA
also monitoring at deeper locations in the bay at ~ 10 m and 20 m, following a similar
protocol. Also WaterCorp and GeoCatch carry out water quality monitoring in
Geographe Bay linked with their programs. The re-assessment of the program
suggested above should consider these programs to maximise the synergies and
outcomes.
296 References
Campbell, C (2020). Assessing biofilm and epiphytes on seagrass leaves as bioindicators of
environmental change. Masters Thesis Edith Cowan University 102 pp.
Collier C, Lavery P, Ralph P, Masini R (2008) Physiological characteristics of the seagrass
Posidonia sinuosa along a depth-related gradient of light availability. Marine Ecology
Progress Series 353:65–79
Fraser, Martin, Kendrick, Strydom (2019). The 2019 survey of selected seagrass meadows in
Cockburn Sound, Owen Anchorage and Warnbro Sound. Unpublished report for
DWER on behalf of Cockburn Sound Management Council.
Hyndes G, Lavery P, Doropoulos C (2012) Dual processes for cross-boundary subsidies:
incorporation of nutrients from reef-derived kelp into a seagrass ecosystem. Marine
Ecology Progress Series 445:97–107
Jones A, Saxby T (2003) Assessing nutrient sources. http://ian.umces.edu
McMahon K (1994) Seasonal and spatial changes in chemical and biological conditions in
nearshore Geographe Bay. Honours thesis, University of Western Australia, Perth
McMahon K (2012) Proposed methodology for a seagrass health-monitoring program in
Geographe Bay. Report to GeoCatch. Edith Cowan University, Joondalup
McMahon K, Walker D (2008) Fate of seasonal, terrestrial nutrient inputs to a shallow
seagrass dominated embayment. Estuarine Coastal and Shelf Science 46:15-25
Oldham C, Lavery P, McMahon K, Pattiaratchi C, Chiffings TW (2010) Report to Dept. of
Transport and Shire of Busselton. Seagrass Wrack Dynamics in Geographe Bay,
Western Australia.
Paling E, McComb A (2000) Autumn biomass, below-ground productivity, rhizome growth at
bed edge and nitrogen content in seagrasses from Western Australia. Aquatic
Botany 67:207–219
Strydom, Murray, Wilson, Huntley, Rule, Heithaus, ... & Zdunic (2020). Too hot to handle:
Unprecedented seagrass death driven by marine heatwave in a World Heritage
Area. Global change biology, 26(6), 3525-3538
van Niel K, Holmes K, Radford B (2009) Seagrass Mapping Geographe Bay 2004-2007.
University of Western Australia
30Appendix 1: Randomly generated quadrat positions from 2021 survey.
Quadrat # Bearing Distance
1 20 6
2 20 14
3 20 18
4 20 20
5 20 23
6 20 25
7 80 3
8 80 5
9 80 7
10 80 9
11 80 16
12 80 20
13 120 4
14 120 7
15 120 9
16 120 11
17 120 13
18 120 21
19 180 5
20 180 8
21 180 13
22 180 15
23 180 17
24 180 19
25 260 5
26 260 11
27 260 14
28 260 20
29 260 22
30 260 24
31Appendix 2: Raw and summary statistics for shoot density data for the seven Keep Watch Seagrass Monitoring Sites in 2021. Seedling
counts, and the person who counted each quadrat is also included.
1. Dunsborough 2. Buayanup 3. Vasse Diversion 4. Busselton Jetty 5. Port Geographe 6. Vasse-Wonnerup 7. Forrest Beach
Quadrat Shoots - CH Seedlings Counter Shoots - CH Seedlings Counter Shoots - CH Seedlings Counter Shoots - CH Seedlings Counter Shoots - CH Seedlings Counter Shoots - CH Seedlings Counter Shoots - CH Seedlings Counter
1 64 4 AF 78 2 AF 54 1 AF 43 1 AF 65 0 AF 30 2 AF 61 0 AF
2 79 1 AF 87 1 AF 45 1 AF 44 1 AF 26 0 AF 34 1 AF 6 2 AF
3 42 2 AF 50 1 AF 40 0 AF 70 2 AF 33 0 AF 41 2 AF 30 1 AF
4 59 2 AF 77 1 AF 27 0 AF 41 1 AF 56 0 AF 38 0 AF 30 2 AF
5 82 0 AF 65 0 AF 30 1 AF 53 0 AF 89 0 AF 38 0 AF 27 1 AF
6 68 3 AF 63 2 AF 4 0 AF 32 0 AF 56 0 AF 51 1 AF 19 0 AF
7 35 1 KM - 0 CH - 0 CH - 0 CH 7 0 KM - 0 CH - 0 CH
8 - - CH - 0 CH - 0 CH - 0 CH - 0 CH - 0 CH - 0 CH
9 - - CH - 0 CH - 0 CH - 0 CH - 0 CH - 0 CH - 0 CH
10 - - CH - 0 CH - 0 CH - 0 CH - 0 CH - 0 CH - 0 CH
11 - - CH - 0 CH - 0 CH - 0 CH - 0 CH - 0 CH - 0 CH
12 - - CH - 0 CH - 0 CH - 0 CH - 0 CH - 0 CH - 0 CH
13 58 2 KM 37 2 KM 26 0 KM 45 1 KM 12 0 KM 45 0 KM 55 3 KM
14 48 3 KM 61 0 KM 39 0 KM 54 1 KM 70 0 KM 43 0 KM 14 0 KM
15 66 2 KM 73 0 KM 31 0 KM 50 1 KM 79 0 KM 51 1 KM 64 2 KM
16 57 2 KM 74 0 KM 20 0 KM 69 0 KM 40 0 KM 42 0 KM 56 2 KM
17 64 0 EB 29 0 EB 30 0 KM 54 0 EB 60 0 KM 53 0 KM 60 2 KM
18 41 0 EB 53 0 EB 24 0 EB 38 0 EB 39 0 KM 53 0 EB 45 1 KM
19 65 0 EB 37 0 EB 52 0 EB 36 0 EB - 0 CH 46 0 EB - 0 CH
20 83 0 EB 27 0 EB 25 0 EB 29 0 EB - 0 CH 47 0 EB - 0 CH
21 84 0 EB 18 0 EB 24 0 EB 55 0 EB 6 1 KM 68 0 EB - 0 CH
22 55 0 EB 28 0 EB 64 0 EB 39 0 EB - - - - 0 CH 38 0 BF
23 51 0 EB 41 0 EB 38 0 EB - 0 CH 30 0 BF 54 0 EB 37 0 BF
24 46 0 EB 99 0 EB 25 0 EB 53 0 EB 55 0 BF - 0 CH 39 0 BF
25 82 0 BF - 0 CH - 0 CH 58 0 BF - 0 CH 39 0 BF 36 0 BF
26 58 0 BF 65 0 BF - 0 CH 36 0 BF - 0 CH 38 0 BF 48 0 BF
27 126 0 BF 85 0 BF - 0 CH 20 0 BF 70 0 BF 59 0 BF 58 0 BF
28 101 0 BF 65 0 BF 75 0 BF 36 0 BF 40 0 BF 28 0 BF 29 0 BF
29 103 0 BF 74 0 BF 56 0 BF 58 0 BF 30 0 BF 19 0 BF 78 0 BF
30 75 0 BF 87 0 BF 54 0 BF 31 0 BF 65 0 BF 54 0 BF - 0 CH
Average 67.7 0.9 59.7 0.3 37.3 0.1 45.4 0.3 46.4 0.0 44.1 0.2 41.5 0.5
Median 64.0 0.0 65.0 0.0 31.0 0.0 44.0 0.0 47.5 0.0 44.0 0.0 38.5 0.0
SE 4.28 0.25 4.72 0.12 3.71 0.06 2.65 0.10 5.32 0.03 2.37 0.10 4.14 0.16
Stdev 21.41 22.63 16.99 12.69 23.80 11.12 18.50
CV 0.32 0.38 0.46 0.28 0.51 0.25 0.45
32Appendix 3: Leaf morphology data for 2021
2021 2021 2021 2021 2021 2021 2021 2021 2021 2021 2021 2021 2021 2021 2021
S1 S1 S2 S2 S3 S3 S4 S4 S5 S5 S6 S6 S7 S7
Dun. Dun. Buayanup Buayanup Vasse Div. Vasse Div. Buss Jetty Buss Jetty Port Geo Port Geo Vasse Won Vasse Won Forrest B Forrest B
Shoot Shoot Shoot Shoot Shoot Shoot Shoot Shoot Shoot Shoot Shoot Shoot Shoot Shoot
Length (cm) Width (mm) Length (cm) Width (mm) Length (cm) Width (mm) Length (cm) Width (mm) Length (cm) Width (mm) Length (cm) Width (mm) Length (cm) Width (mm)
Rep
1 39.3 6.5 36.5 6.5 57.6 6 47.2 6 52.5 6.5 92.2 6.5 68.2 7
2 37.3 6.5 39 5 36.5 5.5 63.9 6 56.6 5.5 101 7 58.2 6
3 30.8 6 31.3 5 57.4 6 40.2 6.5 42.8 5.5 90.2 6 55.8 6
4 28.7 6 49.3 6 40.7 6.5 36 6.5 51.4 6.5 52.8 6 67.7 5.5
5 35.5 7 35.8 6 49 5.5 54.9 5.5 48.8 5.5 95 6 60.2 5.5
6 41.8 6 28.4 4.5 46.2 6 55.6 5.5 23.9 6 110.1 7 51.4 6.5
7 31.2 5.5 39.9 4 48.8 6 55.3 5 23.6 5 55.7 7 32.2 6.5
8 26.4 5.5 44.6 5 94.1 6 53.2 6.5 74 6 98.2 6.5 38.5 6
9 28.5 5.5 41.1 5.5 76 6 61.3 6 38.5 6 97 7 23 6
10 36.1 5 41.9 5.5 59.1 6 51.5 6 40.3 4.5 110.2 6.5 47.6 6
11 39.9 6 48.4 6.5 53.9 7.5 44.2 6.5 28.8 6 98.1 7 53.9 7
12 33 6 66.9 5.5 42.5 6.5 49.6 5.5 45.8 6 120.5 7 48.2 6
13 45.2 6 43.4 5.5 79.6 6.5 76.8 6.5 21.4 5 101 6.5 38.2 6
14 32.9 6 50.3 5 76 6.5 54.3 6.5 46.5 7 89 6 56.5 6
15 36 7 45.5 6 50.9 7.5 83.3 6 48.5 6 79.4 6.5 40.6 6
Average 34.84 6.03 42.82 5.43 57.89 6.27 55.15 6.03 42.89 5.80 92.69 6.57 49.35 6.13
SE 1.37 0.14 2.37 0.18 4.25 0.15 3.24 0.12 3.67 0.17 4.76 0.11 3.32 0.11
33Appendix 4: Trends over time in seagrass shoot density.
3435
Appendix 5: Nutrient data for 2020 and 2021 including the original and
modified calibrated values for 2020 as well as the calibrated values for 2021.
                                          2020         2020        2020         2020        2020         2021        2021        2021
                                   Original     Modified    Original     Modified    Original     Modified    Modified    Original
               Site     Species    δ15N         δ15N        N (%DW)      N (% DW) P (% DW) δ15N               N [wt %]    P (% DW)
     Dunsborough       Posidonia           2.09        1.66         1.03        0.53         0.21        0.94        0.47         0.16
     Dunsborough       Posidonia           1.63        1.17         1.33        0.85         0.19        0.31        0.37         0.19
     Dunsborough       Posidonia           1.00        0.49         0.90        0.39         0.18       -0.10        0.39         0.15
         Buayanup      Posidonia           1.90        1.46         1.30        0.82         0.16        1.18        0.71         0.16
         Buayanup      Posidonia           2.22        1.80         1.34        0.86         0.13        1.06        0.70         0.18
         Buayanup      Posidonia           2.03        1.59         1.28        0.80         0.14        1.36        0.68         0.13
   Vasse-Diversion     Posidonia           1.38        0.90         1.19        0.70         0.23        0.70        0.51         0.16
   Vasse-Diversion     Posidonia           1.65        1.19         1.26        0.77         0.17        1.28        0.52         0.21
   Vasse-Diversion     Posidonia           1.66        1.20         1.19        0.70         0.11        0.00        0.65         0.16
    Busselton Jetty    Posidonia           1.09        0.59         1.08        0.58         0.24        0.79        0.44         0.20
    Busselton Jetty    Posidonia           1.38        0.90         0.91        0.40         0.10        1.57        0.59         0.20
    Busselton Jetty    Posidonia           1.27        0.78         0.99        0.49         0.12        1.50        0.48         0.17
   Port Geographe      Posidonia           2.31        1.90         1.60        1.14         0.19        1.85        0.59         0.15
   Port Geographe      Posidonia           2.55        2.15         1.38        0.90         0.12        2.13        0.74         0.19
   Port Geographe      Posidonia           2.70        2.31         1.59        1.12         0.23        1.70        0.55         0.17
  Vasse-Wonnerup       Posidonia           1.76        1.31         1.22        0.73         0.19        1.33        0.38         0.19
  Vasse-Wonnerup       Posidonia           1.60        1.13         1.11        0.61         0.19        1.24        0.49         0.25
  Vasse-Wonnerup       Posidonia           1.39        0.91         1.05        0.55         0.20        1.58        0.47         0.22
     Forrest Beach     Posidonia           2.01        1.57         1.08        0.58         0.12        1.65        0.66         0.21
     Forrest Beach     Posidonia           1.98        1.54         1.37        0.89         0.16        1.00        0.60         0.14
     Forrest Beach     Posidonia           1.86        1.41         1.15        0.66         0.17        2.21        0.71         0.19
    Busselton Jetty   Amphibolis           1.39        0.91         1.19        0.70         0.10        1.35        1.01         0.19
    Busselton Jetty   Amphibolis           1.74        1.28         1.45        0.98         0.15        1.03        0.93         0.20
    Busselton Jetty   Amphibolis           1.43        0.95         1.39        0.91         0.12        1.95        0.90         0.19
     Forrest Beach    Amphibolis           2.90        2.53         1.17        0.68         0.12        1.10        0.66         0.15
     Forrest Beach    Amphibolis           1.38        0.90         1.12        0.63         0.12        1.91        0.72         0.15
     Forrest Beach    Amphibolis           1.86        1.41         1.12        0.63         0.11        2.22        0.81         0.15
             Capel    Amphibolis           3.52        3.19         2.48        2.07         0.15        2.73        1.03         0.16
             Capel    Amphibolis           3.75        3.44         1.83        1.38         0.10        3.20        1.66         0.16
             Capel    Amphibolis           3.66        3.34         2.30        1.88         0.11        2.56        1.22         0.13
   Vasse-Diversion    Amphibolis                                                                         0.58        0.92         0.13
   Vasse-Diversion    Amphibolis                                                                         1.26        0.90         0.13
   Vasse-Diversion    Amphibolis                                                                         1.12        0.83         0.10

                                                                                                                                  36
Appendix 6: Count comparisons between divers at each site.
Buayanup Busselton Jetty Dunsborough Forrest Beach
Port Geographe Vasse Diversion Vasse Wonnerup
Shoot count in 0.20 x 0.20 quadrat
120
100
80
60
40
20
0
AF BF CH EB KM
Divers
37You can also read