Time-Series Techniques for Prediction Sales in Cashback Websites - iKSP
←
→
Page content transcription
If your browser does not render page correctly, please read the page content below
a

                         iKSP Journal of Computer Science and Engineering
                                          http://iksp.org/journals/index.php/ijcse/index
                                                         © iKSP Publisher

    Time-Series Techniques for Prediction Sales in Cashback Websites
Jackson Harry*1,1 Muhammad Munwar Iqbal1, Salaser Babu1
1
 Department of Computer Science, University of Engineering and Technology, Taxila
_______________________________________________________________________________________________

Abstract - Forecasting sales using time-series data has been an area of active research. In recent years, a significant
amount of research effort went into forecasting sales in e-commerce platforms. The mechanisms of cashback are the
main attractions for both advertisers and publishers. This B2C transaction enables the cashback website’s publishers to
earn a commission, and from that, they offer a percentage back to the consumers/end users in the form of cashback (aka
rewards). This paper proposes a model that leverages an existing time-series technique seasonal persistence for
forecasting sales in cashback websites. This paper contribution is to select different time-series models like Arima,
XGBoost, Fbprophet, and applied them on three popular European-based cashback websites Cashback Korting, Nucash,
iPay, to forecast their sales. The results confirm that XGBoost performs comparatively better than the other selected
models as it produces reasonably low error rates (e.g., the Mean absolute percentage error (MAPE) rate in XGBoost
remains between 7 to 14). The evaluation results demonstrate that our proposed model produces reasonably low error
rates (e.g., the MAPE rate of our model is under 1) and also requires less expertise and dimensions of data to forecast
sales, which may further help in making effective business decisions and offer exciting propositions to drive the business
forward.

Keywords: Cashback, business intelligence, data mining, forecastinghistorical data, websites
_______________________________________________________________________________________________

INTRODUCTION
Data Science draws knowledge from several other disciplines as it’s an interdisciplinary field. This field uses sources
like scientific methods, processes & algorithms to fetch data in various forms. Besides having its connection with the
roots of Data Mining, this new concept is often used interchangeably with earlier concepts i.e. business analytics,
business intelligence, statistics & predictive modeling. When it comes to forecast businesses based on the past
performances and data collection, Data Science helps a lot by providing such techniques to gain insight and drive
business planning efficiently. The proposed research will also utilize & exploit the best possible techniques of Data
Science to predict the sales associated with cash back business. For this, we will study the existing forecasting models,
by keeping our directions focused on cash back site’s standard flow. We will be using the machine’s learning approaches
like time-series forecasting to predict future’s sale taking into account popular parameters like trends, seasonal changes,
cash back percentage & past transactions.

The Need for Forecasting
Good forecasts are vital in many areas of scientific, industrial, commercial and economic activity (Chatfield 2000).
Nowadays every brand, company, product, government, local authorities, websites, processes generating & collecting a
lot of data. The data was mostly unmanaged data. This data in turn is used for making money, saving lives, conducting
decision making and forecasting future aspects. According to Smart Insight (Allen 2017) in each minute of 2017 there
were more than 29 million whatsapp messages sent, 3.3 million face book posts added, more than 3.8 million queries
searched on Google, and more than 500 hours of new YouTube videos were uploaded. Imagine, the amount of data being

1
*Corresponding author:
 Email: jackson@codenterprise.com (J. Harry), Email: munwar.iq@uettaxila.edu.pk (M.M. Iqbal),
 Email: slaser.babu@gmail.com (M. Babu)
 iKSP Journal of Computer Science and Engineering (2021) 1(1): 49-63
iKSP Journal of Computer Science and Engineering (2021) 1(1): 49-63
posted daily, monthly and annually? This significant amount of data will increase even higher in rate over the years.
Looking forward to such a situation, this has already increased the need to build the effective solutions for collection,
managing and analyzing the data. Bigger IT industries i.e Facebook, Google and IBM has already started investing time
& money to build and enhance the forecasting model like Facebook prophet as cited by Taylor and Letham (2017), IBM
SPSS Forecasting (IBM 2012) and Google keyword planner forecasting as forecasting plays a vital role in decision
making. Nowadays, data collection has become easy, since fields like IoT, social networks are available which are
capable of storing TB of data/second. The real issue which industry is facing right now is to convert this data into
something valuable after processing. Hence, proposing forecasting and AI models to find patterns, trends & seasonal
changes is the next thing to get started. The proposed research will be exploiting the use of forecasting in cash
back/affiliate business.

What is Cash back?
So the question which comes first in our mind is: what is a cash back site? Before proceeding further, let's discuss a term
called “Affiliate marketing/Link”. Affiliate marketing consists of four key roles- the merchant, the network, the publisher
aka affiliate, the customer. It's a kind of performance-based-marketing where business rewards one or multiple affiliates
for each customer/sale brought by the publisher using their own marketing efforts. According to one research (Consulting
Feb 03, 2016) Affiliate Marketing accounts for 7.5% of total digital spend among retailers. Same study revealed that US
based Affiliate Marketing Spending would reach 6.82 billion by 2020. Now cash back site is a reward based site, which
pays its members a defined percentage of amounts, after the customer has successfully bought goods or services via its
affiliate link. In turns, cash back site receive commissions from the retailer. The reward can be of several types to
maintain the customer’s loyalty. According to Altinkemer and Ozcelik (2007) Loyalty is a crucial part of today’s business
because retaining a customer is generally less expensive than attracting a new one. These rewards are a clever way for
companies to attract new customers and to retain those they have already cultivated. This is the sole strategy which has
increased the size of cashback sites, both in terms of users and business considerably over the last decade (María et al.
2016). Big names of cashback industries are Quidco, Topcashback, Lyoness, Swagbucks and Orangebuddies. All the
cashback websites work on the principle of Affiliate Marketing. They bring in customers for the e-com giants and in
turn get commissioned. The cash back websites use a major part of the commission they get as cash back and the
remaining portion as their profit. Cash back is the process of making the relationship between Core Customer and
organization stable & healthy.

Why Forecasting is vital for Cash back
Cash back processes and techniques are not only being used in the E-commerce sector, but also banking sector and due
to the enormity of such techniques and its global impact forecasting of such solutions is necessary like any other field to
find out the latest trends, advertiser, best percentage and impact of seasonal changes. Although several forecasting
models are available for standard E-commerce (B2C), those don’t cover the parameters & set of variables which are
necessary while forecasting sales in cash back business. In the proposed study, we will mainly put our focus on
parameters like transactional history, competitor cash back and retailer’s cash back percentage. We will also focus on
generalizing our model so that it can be able to run on any cash back based businesses.

Problem Statement
In time series past data used to predict future sales. In particular, use cash back percentage, competitor’s data, past
transactions, trends and seasonal changes to forecast sale per retailer. Further demonstrate how forecasting models help
in making decisions and improve business. Problem is to find accurate patterns & algorithms for effective sale forecasting
of Cash back business. This problem can be solved by time series forecasting models and techniques.

LITERATURE REVIEW
Literature on the topic of cash back is vast and has been used by several researchers in the past decade. Researches
focused on best optimizing the cash back rates have also been conducted and the results were shared by(Agrawal et al.
2010). In order to determine the optimal rates, they have used historical data i.e. sales, previous cash and price
information to determine optimal rates. Further in this field, research conducted by (Ho et al. 2012) revealed that under
which conditions a merchant can take advantage or benefit from its opponent existing in the same cashback market.
There has also been a lot of research conducted on the sale and demand forecasting along with price optimizations, but
those were specific to the normal ecommerce model. People like (Ferreira et al. 2015) used machine learning algorithms
to forecast such attributes, during their research they took one example of the online retailer shop and provided a generic
algorithm for other retailers on how they can set the price for the new product to get more sales. (Jain et al. 2015) also
                                                            50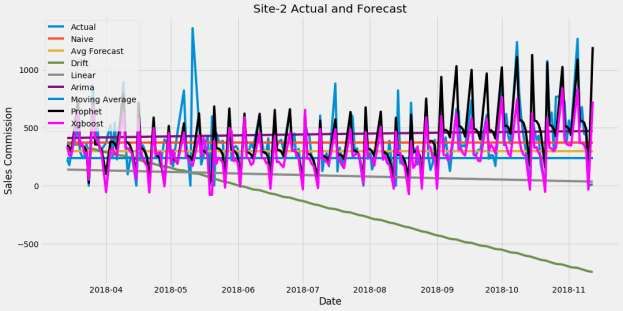
iKSP Journal of Computer Science and Engineering (2021) 1(1): 49-63
developed and proposed a new predictor titled XGBoost predictor. The Extreme Gradient Boosting algorithm was meant
to predict those sales which are likely to happen in the near future. According to their findings, they said their algorithm
predicted well as compared to traditional approaches i.e. linear regressions. XGBoost also keeps the previous data like
public holidays, season, accessibility, location and promotion to predict effectively. It is also concluded in several
literature that it’s difficult to forecast those products which were never sold, since no history is available which one can
use as the starting point for prediction. This was and is the rising issue where the historical data is not present for the
successful planning of the online inventory. Several literature were developed to address this issue, one of the solutions
proposed by (Jha et al. 2015) is to find the similarity between the products, because there is a possibility that the new
product has never been sold at all , and no history is found against that particular item. So by grouping similar items and
then doing forecasting so that historical data can be combined used to forecast the products having similar attributes. To
get the similarity, authors used the semantic approach, which compares items’ description, titles, colors and brands.
Literature also covers forecasting using neural networks, for example (Bakir et al. 2018) used LSTM (Long Short-Term
Memory) neural network to forecast phone prices in European markets. It is also stated by (Gao et al. 2014) that the
traditional approaches like neural networks have weakened in terms of speed, so they proposed an algorithm ELM
(extreme learning machine ) which covers both speed and accuracy while forecasting the sales on a large scale.
Literature belonging to forecasting also covers time series which is a very active research topic now a day, time series is
actually defined as the sequence of numerical data points in successive order. Whereas forecasting in time series is to
predict the future values based on previously observed values. Now literature includes a lot of methods and models
proposed in time to conduct prediction in time series data. Now there is extensive literature also exists on which models
is best fit and in which situation or condition i.e (Khandelwal et al. 2015; Ul Haq et al., 2020; Bhatti, Z. et al., 2018)
used Hybrid ARIMA (Autoregressive Integrated Moving Average) and ANN (Artificial Neural Network) models based
on DWT (Discrete Wavelet Transform) decomposition to improve the precision in time series forecasting. There was
also working done where authors used two different models and each level to improve the prediction, for example
(Suhartono et al. 2015) introduces two level ARIMAX and regression models for forecasting in time series data. At the
end they concluded their two level model predicted well as compared to ARIMA and Neural Networks model. Literature
also covers the findings made on aggregate sales. By forecasting the aggregate sales in a particular region may benefit
investors to predict the movement in the stock market. Aye et al., (2015) forecast the aggregate seasonal sales in South
Africa with the help of 26 forecasting models covering both linear and nonlinear. This study contributed a lot in literature
by observing 509 observations of monthly sales data from 1970 to 2012.
Fashion industry is also one of the biggest industries nowadays and with the great number of competitors and business
strategies out there, forecasting plays an important role in this particular industry to efficiently manage the supply chain
process. A reasonable amount of literature is available already, Erhard and Bug (2016) tried to cover all the obstacles
the fashion industry is facing while forecasting along with the limitations in the previous methods/models used by the
researchers. Similarly, forecasting is done in food industry as well as revealed by Arunraj and Ahrens (2015)
Since ecommerce is an umbrella field and cash back business is one of its type, a lot of work had already been done in e
commerce especially B2B type to forecast in order to improve the sales and manage inventory effectively. But
unfortunately due to different parameters involved in cash back business i.e. social network impact between the
customers as mentioned by (Ballestar et al. 2016) so this research supposed to follow the standard procedures to forecast
but by keeping the cash back related parameters in mind. The reason why the literature is less in this field are the
challenges like less historical data is available as compared to normal ecommerce sites, lesser correlation, continuous
price changes, affiliate network changes and commission changes (Abro et al., 2020). We hope our research will play a
vital role to develop the literature associated with the cash back forecasting.

METHODOLOGY

                                           Figure 1: Steps in our Methodology

Detailed steps involved in the methodology we followed is shown in the above Figure1. We divided our methodology
into two steps.
    1. Initial data ready for prediction
    2. Forecasting and findings
                                                        51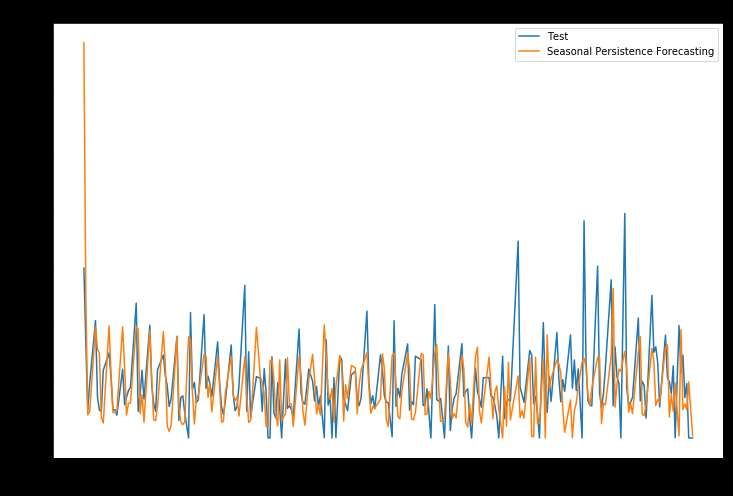
iKSP Journal of Computer Science and Engineering (2021) 1(1): 49-63
For forecasting in any domain, it is mandatory to set up the data first to reach the highest possible level of prediction.
Since if the data is not configured or filtered in a well-mannered way, the end result would be difficult to analyze and
may not reveal the valuable outcomes.
As far as first step is concerned, prior to setting up the data, we used historical data of the sale’s commission from well
reputed three European based cash back sites. In our research work, we referred to those as site-1, site-2 and site-3. The
historical data was providing an insight of daily sales commissions between the periods starting from Jan, 2016 to Dec,
2018. As far as tools for the analysis are concerned, we used Python environment and Jupyter Notebook.
We then applied the cleansing process, where we filtered and removed the unwanted/missing data to achieve meaningful
results, such as we removed the unwanted information like compensations, loyalty rewards, signups reward, promotions
and campaigns related data. Since, the data provided by the sites had a lot of other information which was not required
during the experiment along with some missing information, so we filtered it from our base collection of the data. Out
of 100% data we collected we used 70% of the data as training data and 30% of the data as testing data. After processing
and applying prediction models we compared our findings with the remaining 30% of the data we collected to ensure
that our forecasting went well. It is also necessary to convert the collected data to a stationary data. In order to check for
stationarity in data we ran a Dickey Fuller test on our collected data to ensure that data is stationary and prediction ready.
We got the p value < 0.05, against all three samples' site; hence the data was stamped as stationary. This whole process
of data collection, data filtration, removal of unwanted data, categorizing into training and testing data, and lastly
conversion into stationary data is a prerequisite of conducting actual prediction on the top of data. At the end, we got the
data having daily sales commissions only to whom we were ready to process for the forecasting and analysis purposes.
As shown in Figure 1.1, we got the week day sales information; we observed from all sites that sales were high on
Monday in the past 3 years, while the Saturdays have few sales compared to other week days. The reason might be the
campaigns launching on Monday since the past 3 years. Similarly Figure 1.2 and 1.3 showing the week day sales
information against site-2 and site-3 respectively. The pattern seems to be similar as far as all sample sites are concerned.

                                      Figure 1.1: Three-year week day sale for site-1

                                                             52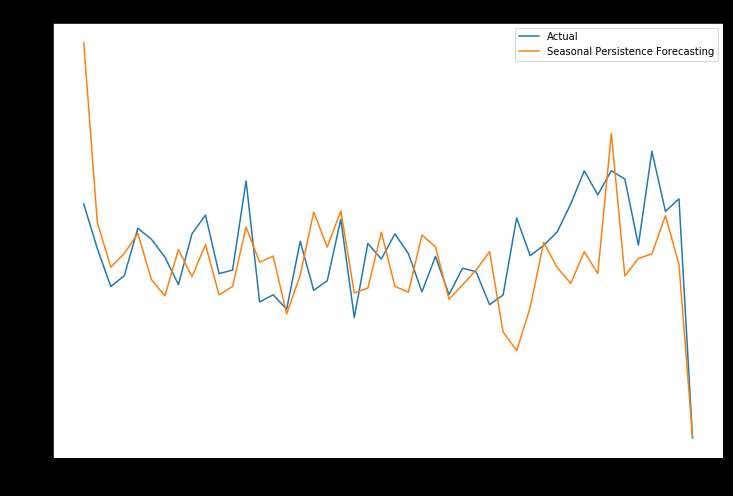
iKSP Journal of Computer Science and Engineering (2021) 1(1): 49-63

                                 Figure 1.2: Three-year week day sale for site-2

                                 Figure 1.3: Three-year week day sale for site-3

We further checked the Month Days Sales against each sample site. The term “Month Days Sales” means the sales
conducted on a particular date of the month on each year against each site.

                                                       53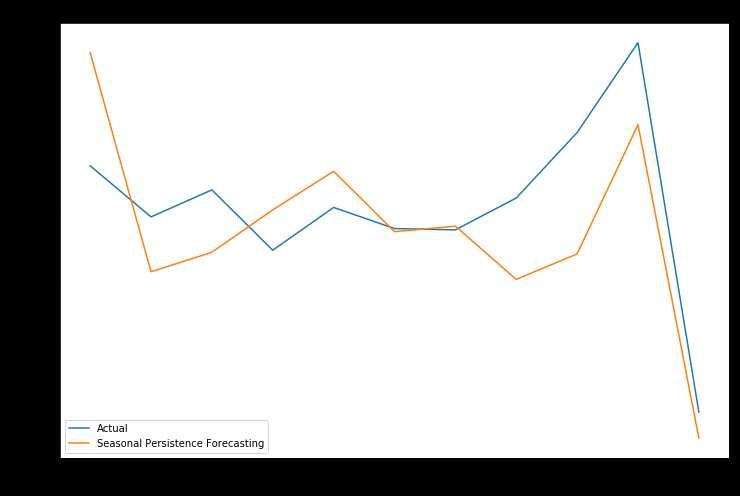
iKSP Journal of Computer Science and Engineering (2021) 1(1): 49-63

                                    Figure 2.1: Three-year month-day sale for site-1

From Figure 2.1, we observed the sales were high on the first few days of each month. The reason could be people
getting their salaries in the first week of each month. Similar pattern can be observed in case of Figure 2.2 and 2.3, the
sales were less in the middle and last week of each month. Another reason could be the strategy of the owners to run a
campaign on the first few days of each month.

                                    Figure 2.2: Three-year month-day sale for site-2

                                                           54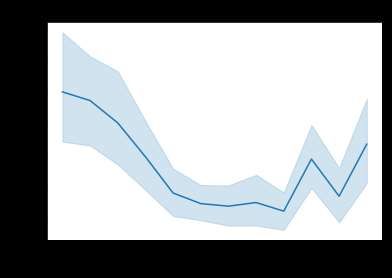
iKSP Journal of Computer Science and Engineering (2021) 1(1): 49-63

                                   Figure 2.3: Three-year month-day sale for site-3

We then tried to observe the monthly sale pattern from each of the sites and after analysis it was found that sales were
high from Nov-Dec as shown in Figure 3.1. Also it was observed that starting of each year has good sales, while the
middle of the year has fewer sales compared to other months.

                                   Figure 3.1: Three-year each month sale for site-1

The reason might be the Christmas holidays in December till the New Year. Further events i.e. Black Friday used to
appear in November. The same pattern was observed against site-2 and site-3 in Figure 3.2 and 3.3.

                                                          55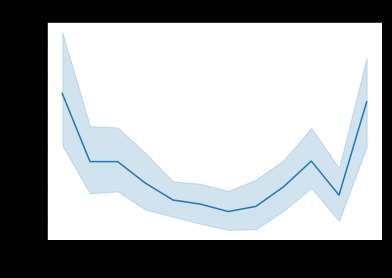
iKSP Journal of Computer Science and Engineering (2021) 1(1): 49-63

                                   Figure 3.2: Three-year each month sale for site-2

                                   Figure 3.3: Three-year each month sale for site-3

Due to the complex nature and structure of cash back sites, there have been more challenges available for predictors to
predict the sales. Literature also has few examples where forecasting was conducted against a cash back business. One
reason might be that there are challenges involved in it, which makes forecasting quite tough as compared to standard
ecommerce- online web shop based forecasting. Unlike standard e-commerce, that covers attributes like pricing,
inventory, sales, discounts, and known competitors etc are all under controlled environment to make predictions, cash
back prediction requires a lot of historical data including challenges like frequent changes in the amount of networks,
commission tiers, product pricing, less promo information, competitors data and less information to find correlation
among data.
                                                          56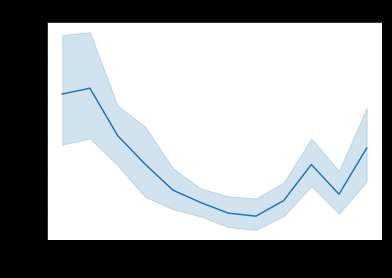
iKSP Journal of Computer Science and Engineering (2021) 1(1): 49-63
Considering these challenges and to overcome those, we have to find a general pattern which can work well for cash
back sites forecasting. In this study we mainly focused on what could be the possible generic patterns out there that can
work well for sales commission forecasting when we have limited historical data with minimum data correlation.
During our experiment we used well sophisticated time series models and traced their performance. The models we used
while analyzing were Naive, Moving average, Average forecast, Drift forecast, linear regression, Arima, Fb Prophet,
Xgboost and Seasonal persistence techniques.
To check the selected model's accuracy against all three sample sites, we used the popular Metrics i.e. RMSE, MAE and
MAPE. We used RMSE (root-mean-square error) to find out the difference between the testing data and values observed
after prediction. The formula for the calculation is shown in Figure 4.1.

                               Figure 4.1: Formula to calculate Root Mean Square Error

We then used MAE (Mean Absolute Error) shown in Figure 4.2 to calculate the average magnitude of the errors while
prediction.

                                 Figure 4.2: Formula to calculate Mean Absolute Error

We then used MAPE (Mean absolute percentage error) to calculate the percentage accuracy of the models used for
prediction. The formula to calculate the MAPE is shown in Figure 4.3

                           Figure 4.3: Formula to calculate Mean absolute percentage error

The resultant we got after applying all those metrics against each model we used is shown in the table 1.1

                                 Table 1.1: Prediction model’s accuracy found per site

                     Model                  Sites         RMSE         MAE             MAPE
                     Naive                  site-1        340.79       264.83          34.90
                                            site-2        244.81       182.06          31.57
                                            site-3        287.28       258.54          30.86
                     Avg Forecast           site-1        331.68       229.79          27.46
                                            site-2        253.99       178.69          25.34
                                            site-3        193.93       128.80          12.99
                     Drift Forecast         site-1        577.01       431.39          14.33
                                            site-2        704.57       571.94          24.84
                                            site-3        247.40       191.13          13.67
                     LinearRegression       site-1        352.56       228.20          21.73
                                            site-2        374.85       296.61          8.10

                                                           57
iKSP Journal of Computer Science and Engineering (2021) 1(1): 49-63
site-3 254.05 192.22 6.56
Arima site-1 332.24 246.14 31.70
site-2 254.99 204.10 37.81
site-3 191.21 151.11 20.76
Moving Avg site-1 338.04 224.56 24.79
site-2 276.22 195.98 20.28
site-3 207.96 141.11 11.00
Fb Prophet site-1 233.36 150.96 13.93
site-2 198.42 136.17 22.17
site-3 140.23 91.53 10.04
Xgboost site-1 250.60 158.22 12.54
site-2 200.60 136.35 7.65
site-3 149.21 94.42 7.08
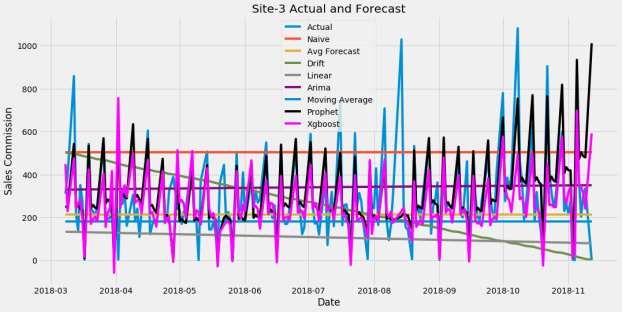
As shown from Figure 5.1, Xgboost and FBprophet performed very well as compared to the other models we tested,
since they were able to capture patterns closer to the actual forecasting. XGboost performed well in feature extraction
while FBprophet captured seasonality. But there is still more room for improvement for both models, so by adding
parameters like holidays, campaign/promo data, weekly and monthly seasonality we may improve score a little bit more
because residual data seems to have less correlation left, so this means that there is either no or little room for
improvements.
Figure 5.1: Actual Vs Forecast sale data for site-1
Figure 5.2 & Figure 5.3 displaying the case of site-2 and site-3 respectively, we can again observe that the
aforementioned two models are performing well and capturing the forecasting closer to the original sale data.
58iKSP Journal of Computer Science and Engineering (2021) 1(1): 49-63
Figure 5.2: Actual Vs Forecast sale data for site-2
Figure 5.3: Actual Vs Forecast sale data for site-3
Proceeding in the experiment further, we tried another technique besides the previous models we used, that technique
called “seasonal persistence”. Seasonal persistence assumes that the observations will stay the same as of the previous
year observation. By adding different sets of seasonal components, one can predict the next sales using this naive
approach.
The results we got after applying the seasonal persistence were even closer then what we got against XGboost and
FBProphet. We checked this new technique was performing well in all types of sales i.e. daily sales, weekly sales and
monthly sales as shown in Figure 6.1, Figure 6.2 and Figure 6.3. Although seasonal persistence is used for benchmarking
purposes, here we noticed that it performed very well when we had less dimensions and less correlations were available.
We still have much correlation left in residual so we can improve the model even more. So by checking Ljung-box test
we found there is still a lot of correlation among residuals, although the model provided good accuracy, but still hold the
fact that it can be improved even more.
59iKSP Journal of Computer Science and Engineering (2021) 1(1): 49-63
Figure 6.1: Actual Vs Forecast sale data using seasonal persistence technique for site-1
Figure 6.2: Actual Vs Forecast sale data using seasonal persistence technique for site-2
60iKSP Journal of Computer Science and Engineering (2021) 1(1): 49-63
Figure 6.3: Actual Vs Forecast sale data using seasonal persistence technique for site-3
While closely inspecting residuals we find out that model under cast on Monday and overcast on Weekends. If we fine
tune weekday sales, the model will perform even better. Few suggestions are
1. Adding yearly growth rate factor - biased value
2. Checking the previous year same week day
We further noticed that December to March sales were high and this approach already captured this.
Figure 7.1: Actual Vs Forecast Week Day Sale data using seasonal persistence technique
Based on these facts we can improve model score, which already captures sales patterns nicely compared to other
approaches. Also since results from the Ljung-Box test revealed that residual p value was < 0. 05 So this tells us seasonal
persistence still has much room for improvements, as quite a correlation is left as shown in the Figure 7.2 & 7.3 below.
61iKSP Journal of Computer Science and Engineering (2021) 1(1): 49-63
Figure 7.2: Partial Autocorrelation
Figure 7.3: Autocorrelation
These patterns we found in all sites and scores of seasonal persistence models are RMSPE under 0.10 and MAPE under
1. Other sophisticated models don't have much room for improvement as well.
Problem is we have less historical data, we don’t have other parameters like Promotion records, Stores Types, Categories
sales, Competitor data also affiliate data change frequently, new stores, commission tiers and competitors add frequently
so it is difficult to correlate with these stats and fine tune more sophisticated models. In our experiment we found when
we have less data to correlate, data change frequently and many attributes which can affect sales simple seasonal
persistence forecast work better. Also, we found before moving to more complex model we should test with simple
benchmark models sometime it perform better than complex models.
Usually cashback site owners don’t have a huge budget to invest on forecasting models. Through our research it will
benefit medium and small level cashback site owners. With this simple technique they can apply good effective models
which can increase overall revenue; they are able to set cash back ratios more freely as they will know what they will
earn in the future.
CONCLUSIONS
This paper contribution is to choose different time-series models like Arima, XGBoost, Fbprophet, and applied them on
three popular European-based cashback websites. The results confirm that XGBoost performs comparatively better than
the other selected models as it produces reasonably low error rates (e.g., the Mean absolute percentage error (MAPE)
rate in XGBoost remains between 7 to 14). After going through all of these, we concluded that one of the simplest yet
effective approaches called “seasonal persistence” stood first among the rest of the models and provided great results
while forecasting (e.g., the MAPE rate of our model is under 1) and also requires less expertise and dimensions of data
62iKSP Journal of Computer Science and Engineering (2021) 1(1): 49-63
to forecast sales, which may further help in making effective business decisions and offer exciting opportunities to boost
the business forward. We also proved that it is better to use a seasonal persistence approach as a first-cut model before
investing on other models, since its simple, effective and low budget technique to predict sales.
Future Work
It is our prediction that the future of the proposed study will be even more interesting since the existing fields like
machine learning, neural networks and deep learning models will provide more room for improvement in the work
associated with the sales forecasting for cash back. As far as our study is concerned, there is still need to know how we
can improve seasonal persistence models for cash back domains as it requires fewer budgets and affects to implement.
Future work also covers the highlighting of other cash back forecasting problem industries/researchers facing ,so that
more improvements can be made in earlier stages to boost and welcome more candidates to work on this particular
domain having better options than before to improve precision.
REFERENCES
Abro, S., Shaikh, S., Abro, R. A., Soomro, S. F., & Malik, H. M. (2020). Aspect Based Sentimental Analysis of Hotel
Reviews: A Comparative Study. Sukkur IBA Journal of Computing and Mathematical Sciences, 4(1), 11-20.
Agrawal, R., et al. (2010). OPTIMIZING CASHBACK RATES. MICROSOFT CORPORATION,
Allen, R. (2017). What happens online in 60 seconds? Smart Insight.
Altinkemer, K., et al. (2007). Cash-back rewards versus equity-based electronic loyalty programs in e-commerce.
Information Systems and e-Business Management.
Arunraj, N. S., et al. (2015). A hybrid seasonal autoregressive integrated moving average and quantile regression for
daily food sales forecasting. International Journal of Production Economic.
Aye, G. C., et al. (2015). Forecasting Aggregate Retail Sales: The Case of South Africa. International Journal of
Production Economics.
Bakir, H., et al. (2018). E-Commerce Price Forecasting Using LSTM Neural Networks. International Journal of Machine
Learning and Computing, Vol. 8, No. 2, 8.
Ballestar, M. T., et al. (2016). Social Networks on Cashback Websites. Psychology and Marketing (PSYCHOL
MARKET).
Chatfield, C. (2000). Time-Series Forecasting 1st Edition. Chapman and Hall/CRC; 1 edition.
Consulting, F. (Feb 03, 2016). Rakuten – Networks help drive affiliate marketing into the mainstream.
Erhard, J., et al. (2016). Application of Predictive Analytics to Sales Forecasting in Fashion Business.
https://publikationen.reutlingen-university.de/.
Ferreira, K. J., et al. (2015). Analytics for an Online Retailer: Demand Forecasting and Price Optimization.
Manufacturing & Service Operations Management Vol. 18, No. 1, 18, 1-175.
Gao, M., et al. (2014). A Novel Forecasting Method for Large-Scale Sales Prediction Using Extreme Learning Machine.
Seventh International Joint Conference on Computational Sciences and Optimization.
Ho, Y.-C. C., et al. (2012). Online Cashback Pricing: A New Affiliate Strategy for E-Business. Thirty Third International
Conference on Information Systems.
IBM. (2012). IBM SPSS Forecasting.
Jain, A., et al. (2015). Sales Forecasting for Retail Chains. conference proceedings.
Jha, A., et al. (2015). Clustering to Forecast Sparse Time-Series Data. IEEE 31st International Conference on Data
Engineering.
Khandelwal, I., et al. (2015). Time Series Forecasting using Hybrid ARIMA and ANN Models based on DWT
Decomposition. International Conference on Intelligent Computing, Communication & Convergence (ICCC-
2014).
María, et al. (2016). Consumer behavior on cashback websites: Network strategies. Journal of Business Research, 69(6).
Suhartono, et al. (2015). Two levels ARIMAX and regression models for forecasting time series data with calendar
variation effects. AIP Conference Proceedings, 1691.
Taylor, S. J., et al. (2017). Prophet: forecasting at scale. The American Statistician 72(1):37-45.
Ul Haq, M. A., Malik, H. A., Akram, F., & Al Mutawa, E. K. (2020, December). Monetary Benefits of Solar Energy for
Smart Cities Development. In 2020 International Conference on Innovation and Intelligence for Informatics,
Computing and Technologies (3ICT) (pp. 1-5). IEEE.
Bhatti, Z. (2018). Multimedia Based Learning and Virtual Tour For Performing Hajj. Journal of Information &
Communication Technology (JICT), 12(1), 6.
63You can also read