Telecommunications
 Sector Report 2020
←
→
Page content transcription
If your browser does not render page correctly, please read the page content below

Telecommunications Sector Report 2020
TRBR Telecommunications Sector Report 2020

Executive Summary
The digitalization of telecommunications/ICT content and services has stimulated the increase in choices,
innovation, and competition for both the operators and the consumers. Businesses as usual is no longer the
case for telecommunication providers as the industry is seen to be on a crossroad and the
telecommunication providers in the Vanuatu are experiencing a new landscape of both competitive
challenges and also opportunities.

For the past few years, the revenue stream from essential services like voice and short message service (SMS)
has been declining heavily due to severe competition with the use of the over-the-top (OTT) services and
voice over IP (VOIP) which resulted in an increase of mobile data traffic. This increase is being driven by
strong uptake in smartphone subscriptions and the demand for data- intensive applications, and this change
in demand has forced the telecommunication providers to refocus their strategy towards network and
service convergence that caters for both voice, SMS and data in one single network and at the same time in
harmony with the global trend which has become the new normal.

The Telecommunications, Radiocommunications and Broadcasting Regulator (TRBR) has released this, its
fourth Telecommunication Sector Report, highlighting the trends, status and development of
telecommunications in Vanuatu for the year ending 2019, as a result of continuously monitoring the changes
taking place in the Vanuatu Market. This report builds on the developments that have occurred since 2018
and is aimed at providing primary information for TRBR’s stakeholders, Government, aid donors, the
business community, and the people of Vanuatu.

For this year’s Report, TRBR had added another 3 indicators to its list of key market indicators namely: Fibre
to Home internet, Satellite broadband Internet and Outbound International Roaming. All these indicators
that are obtained via the TRBR data collection framework, continue to be an effective regulatory monitoring
tool that establishes and keeps an eye on market trends, and the overall performance of the telecom sector
in Vanuatu.

While digital transformation is stimulating innovation and competition, telecommunication service providers
continue to offer customers with variety of services at competitive prices to both retain customers and
increase their consumer base. The impact is seen to encourage growth in the long run. However, in 2019
there has been a dip in total market revenue by 9%, resulting in a total revenue of less than VUV5 billion.
The major driver for the fall in revenue has been the decline in voice and SMS revenue in the market,
reflecting a global downward trend in these services. The reduction in average mobile call bundling price and
the reduction in the wholesale bandwidth price have also contributed. Other factors contributing to this
trend include the decline in international outbound call traffic and the review of international call rates by
operators, the decline of fixed telephony revenue, introduction of mobile prepaid All in One services (See
below and further in the Report).

Although total market revenue has slipped this year, the overall market outlook remains positive as mobile
data and fixed internet services revenue is gaining momentum signaling growth in these market segments.
With the changing landscape of business in the telecommunication sector, the uptake of mobile services has
boosted growth of mobile subscribers by 5% recording over 260,000 subscribers in 2019. This growth has
stimulated an increase in penetration rate to 92% in 2019. Although the sector has experienced this
significant growth, mobile call revenue and traffic has gone down by 16% and 45% respectively in 2019.

                                                                                                  1|Page
TRBR Telecommunications Sector Report 2020
Furthermore, while the average standard retail price of mobile calls has increased to VUV29 per minute in
2019, prepaid average call bundling price has seen to drop by 24% to a lower price of VUV2.17 in 2019. On
the other hand, average postpaid mobile call bundling price also dropped by 23% recording a new low price
of VUV8.86 per minute in the same year.
While digitalization continues to stimulate internet access and capacity usage for both fixed and mobile
broadband networks, the high demand for data bundles with improved speed in the market has boosted
international bandwidth acquired from Interchanged limited (ICL) resulting in an increase by 177%; hitting a
new peak of 7.4 Gbps in 2019. Another important contributor to this huge surge in bandwidth is due to a
41% reduction of wholesale bandwidth pricing made by ICL.
The reduction in the wholesale bandwidth price allowed operators to provide affordable bandwidth prices
to their customers and the increased in the international bandwidth continues to stimulate the uptake of
mobile data services as well. Further, with the increasing usage of online content applications such as Netflix,
YouTube, Facebook and other social media platforms, as well as OTT services, 3G and 4G technologies has
continued to boost mobile data traffic recording over 3,800TB of data usage in 2019. This constitutes an
annual growth of mobile data traffic by 79% from the previous year.
Moreover, with the increase in mobile data traffic, average prepaid data bundling price has dropped from
VUV0.52/MB in 2018 to a lower price of VUV0.34/MB in 2019, while average postpaid data bundling price
also dipped from VUV0.76/MB in 2018 to record another lower price of VUV0.37/MB for the same year.
For fixed internet subscriptions, the Fiber-to-Home (FTH) subscriptions has grown by 8% recording over 1400
subscribers in 2019 while fixed wireless also recorded an increased in subscriptions by 57% registering over
6,000 subscribers in the same year. In addition, Satellite subscriptions also went up by 12% recording over
200 subscribers in 2019. The uptake of fixed internet subscriptions has continued to grow and is being
stimulated by attractive packages and bundles offered in the market with improved speeds that boosted
fixed internet revenue by 71% in 2019.
Furthermore, SMS volume has dropped by 16%, recording only 83 million SMS’s in 2019. , With the fall in
SMS volume, correspondingly, SMS revenue also went down by 31% earning only VUV77 million in the same
year. The average advertised SMS price remained at VUV11 per SMS, but the average prepaid SMS bundling
price has dropped to VUV0.72 per SMS. The average postpaid SMS bundling price also went down to only
VUV0.93 per SMS in 2019.
Fixed Telephony continued to decline with subscriptions dropping by 8% resulting in a lower number of
subscribers, of below 3,800, being registered in 2019. As a result, fixed telephone revenue also went down
by 5% in the 2019 year. This trend can only be expected to continue in the coming years as demand for
mobile data services continue to dominate the market. Such a situation aligns with world-wide trends.
International outbound calls have experienced a decline in traffic by 22% resulting in a further drop in the
international outbound call revenue by 18% in 2019. This trend is expected to continue as voice services
can be expected to be substituted for OTT services.
In contrast, though international inbound roaming minutes has dropped by 4% in 2019, revenue earned for
this service has increased by 14% recording over VUV76 million in the same year. These figures are
fluctuating each year depending on the number of visitors into the country. International outbound roaming
on the other hand has experienced a decline in both call traffic and revenue by 7% and 34% respectively in
2019.
2|PageTRBR Telecommunications Sector Report 2020
Table of Content
1. Introduction .......................................................................................................................................... 5
2. Data Source Disclaimers ....................................................................................................................... 6
3. Key Trends in the Telecommunications Sector ................................................................................... 8
4. Gross Telecommunications Revenue ................................................................................................. 10
5. Mobile Phone Services ....................................................................................................................... 11
5.1. Mobile Subscriptions .................................................................................................................. 11
5.2. Mobile Call Revenue Vs Call Traffic............................................................................................. 12
5.3. Average National Mobile Call Pricing.......................................................................................... 13
5.4. Average Mobile Revenue per Subscriber.................................................................................... 14
6. Internet Services................................................................................................................................. 15
6.1. International Bandwidth. ............................................................................................................ 15
6.2. Mobile Broadband Services ........................................................................................................ 16
6.3. Fixed Internet Services ................................................................................................................ 18
6.4. Fixed Internet Subscriptions ....................................................................................................... 18
6.5. Fixed Internet Revenue ............................................................................................................... 19
6.6. Average Fixed Internet Revenue per Subscriber ........................................................................ 20
7. Short Message Service (SMS) ............................................................................................................. 21
7.1. SMS Traffic & Revenue................................................................................................................ 21
7.2. Average SMS Pricing ................................................................................................................... 22
7.3. On-net and Off-net SMS.............................................................................................................. 22
8. Fixed Telephony Services ................................................................................................................... 23
8.1. Fixed Telephony Subscription ..................................................................................................... 23
8.2. Fixed Line Telephone Revenue ................................................................................................... 24
9. International Calls .............................................................................................................................. 25
9.1. International Outbound Call Traffic ............................................................................................ 25
9.2. International Call Roaming ......................................................................................................... 26
10. CONCLUSION ...................................................................................................................................... 29
3|PageTRBR Telecommunications Sector Report 2020
Table of Figures
Figure 1 Illustrating Trend on Revenue Collected........................................................................................ 10
Figure 2: Vanuatu Mobile Subscribers & Penetration ................................................................................. 11
Figure 3 Mobile Call Revenue Vs Mobile Call Traffic ................................................................................... 12
Figure 4: Average Mobile Call Pricing .......................................................................................................... 13
Figure 5: Mobile Call ARPU Vs Mobile Data ARPU ....................................................................................... 14
Figure: 6 International Bandwidth ............................................................................................................... 15
Figure 7: Showing growth of Mobile Data Traffic ........................................................................................ 16
Figure 8 Showing Mobile Data Revenue Vs Mobile Voice Revenue ............................................................ 17
Figure 9: Showing Mobile Data Average Pricing .......................................................................................... 18
Figure 10: Showing Total Internet Revenue ................................................................................................ 19
Figure 11: Showing Trend of Fixed internet Revenue per Subscriber ......................................................... 20
Figure 12: Showing Trend of Traditional SMS Revenue & Volume .............................................................. 21
Figure 13: Showing Average SMS Pricing .................................................................................................... 22
Figure 14: Showing Fixed Line Telephone Subscription............................................................................... 23
Figure 15: Showing Fixed Line Telephone Revenue .................................................................................... 24
Figure 16: Showing International Outbound Call Revenue & Traffic ........................................................... 25
Figure 17: Showing International Outbound Roaming Call Traffic & Revenue ............................................ 26
Figure 18: Showing Trend of International Inbound Minutes & Revenue ................................................... 27
Figure 19: Statistics from Vanuatu National Statistics Office (VNSO) .......................................................... 28
4|PageTRBR Telecommunications Sector Report 2020
1. Introduction
This 2020 Telecommunications Sector Report was developed by the Telecommunications,
Radiocommunications and Broadcasting Regulator (TRBR), building on from the third report it released in
2019. This annual Sector Report covers the period beginning January 2019 to December 2019.
It updates the status and evolution of the telecommunications market in Vanuatu. The Report also provides
analysis on current trends in the telecommunications market in Vanuatu from a regulatory perspective as
well as key events and developments in 2019.
The collection, analysis and dissemination of accurate and timely market information is critical for a wide
range of stakeholders as well as the TRBR, and it plays a vital role in assisting the designing of effective,
proportionate and efficient market regulations to foster and, importantly, maintain a competitive
telecommunications sector. The TRBR collects statistics bi-annually for that purpose and continues to
improve its collection of a range of detailed data and statistics from telecommunication service providers.
These statistics are also used for awareness and an understanding of the trends in the Vanuatu
telecommunications markets, as well as enabling transparent and aggregated information to be available to
the Vanuatu Government, the telecommunication industry, and the general public. The data, and this Sector
Report, is also extremely useful for international and regional comparison and transparency.
The TRBR would like to acknowledge all the telecom service providers for honoring their commitments in
submitting the required data to enable statistical analysis for this Report to be developed. TRBR welcomes
their support and cooperation and looks forward to their continuous cooperation going forward.
This Report is also available in electronic format on the TRBR’s website (https://www.trbr.vu/en/public-
register/reports/telecommunications-sector-report)
We welcome any comments or feedback on any aspect of this Report. For further information about this
2020 Sector Report, please contact the TRBR via the contract details provided below:
PO Box 3547 TRBR Phone: +678 27621
Ocean Walk Building Email: enquiries@trbr.vu
Lini Highway http://www.trbr.vu
Port Vila, Vanuatu
5|PageTRBR Telecommunications Sector Report 2020
2. Data Source Disclaimers
Under Section 8 (Information Gathering) of the Telecommunications, Radio-communications, and
Broadcasting Regulations Act N0. 30 of 2009, as amended by Amendment No. 22 of 2018, the TRBR has
specific powers to request the provision of relevant information by telecommunications service providers.
The data in this Sector Report originates from a variety of sources. However, the analysis presented is
predominantly based on data collected in TRBR’s bi-annual collection of market statistics from the industry
under TRBR’s Order No. 1 of 2015 (Order 1) and information that is collected, ad-hoc, under the powers
contained in the Telecommunications Licenses, Exceptions Licenses or the TRBR Act.
The data collected under Order 1 covers the previous six months period, from 1st January to 30th June and
1st July to 31st December, respectively. Where this Report, or the prior Report, indicates a value for a period
prior to 1st January 2015, that information has typically been provided to TRBR under prior reporting
frameworks, or through an ad-hoc request for information by TRBR under Section 8(1) of the Act. TRBR is
unable to confirm or deny the accuracy or consistency of data for the period of this Report.
For information collected under Order 1 of 2015 where the data is a measure of volume, such as revenues
and minutes, the information is related to the volume utilized or accrued during a specific monthly period.
Where the information describes a variable that is a snapshot in time, such as subscriber numbers, then it is
related to the number of subscribers counted on the last day of the calendar month. For example, in relation
to the number of mobile subscriptions, this number represents the number of users that have initiated a
chargeable event during the preceding 90-day period.
In instances where data is related to a measure of volume (e.g. a volume of usage such as total SMS sent,
call minutes made, or revenues earned and so on), this data is presented as a quarterly or annual value and
TRBR has, at times, sought to combine specific values to provide more workable and useful insight on longer
term trends. On occasions where a variable is a snapshot in time, such as for subscriber numbers, then TRBR
has provided the value at the end of the last month of the same quarter. For example, at 31st December for
any annual subscriber values presented or the 31st March for the value for the first quarter of the year (i.e.
Q1).
The Act, however, provides restrictions on the use and disclosure of information collected by TRBR under
Section 8(7) which states:
“Information furnished or documents provided under this section must not be disclosed by the Regulator
except:
(a) with the written permission of the person from whom the same was obtained; or
(b) in the course of proceedings under Part 9; or
(c) was required by a court order; or
(d) where, in the opinion of the Regulator, the information comprises, or will be reproduced in, aggregated
data so that it does not identify any particular service provider; or
(e) where such disclosure is required by this Act or any other law.”
6|PageTRBR Telecommunications Sector Report 2020
TRBR is currently under no obligation under the Act to report on specific statistical indicators or to produce
this Telecommunications Sector Report. It is only compelled to release an Annual Report. Therefore, the
TRBR is currently restricted to only disclosing information with prior approval from the provider of that
information, or where the information provided is in aggregated form.
In some instances, TRBR has chosen not to report on specific indicators so as not to compromise its
adherence to Section 8(7) (d) and to avoid the disclosure of the specific service provider to which it relates.
The data used may be revised by the respondents or the TRBR when it appears inaccurate, an error has been
made or was an estimate. Consequently, some prior year figures used previously in other publications have
been revised. We also note that not all respondents were able to provide sufficient information in order for
TRBR to appropriately compare or segregate or report on specific indicators. In such instances, TRBR has
sought to combine or estimate specific indicators or values in order to display the relevant information. In
the case of estimated values, TRBR has indicated and/or attempted to provide a further rationale, if
appropriate, where such estimations have been made.
In light of such challenges, TRBR does not make any warranties that the information in this Report is free
from inaccuracies, errors or omissions, is exhaustive, is of merchantable quality and fit for a particular
purpose and is not liable for any inaccuracy, error or omission in the information contained in this document.
7|PageTRBR Telecommunications Sector Report 2020
3. Key Trends in the Telecommunications Sector
Key observation trends that TRBR has been able to capture for the year ending in 2019, are shown below:
1. Gross market revenue dipped by 9% 2. Mobile subscription increased by 5%
5.50 280
Revenue
(Billions
Scription
5.00 260
VUV)
Mobile
('000)
4.50 240
4.00 220
2017 2018 2019 2017 2018 2019
3. Mobile voice revenue declined by 16% 4. Mobile penetration increased to 92%
1,700
Revenue
(Million
1,200 82% 89% 92%
VUV)
2017 2018 2019
700
2017 2018 2019
5. Fixed telephony declined by 8% 6. Fixed telephony revenue fallen by 5%
4,600 300
Subscriptions
Revenue
(Millions
280
VUV)
No. of
4,100 260
240
3,600 220
2017 2018 2019 2017 2018 2019
7. Mobile data traffic (MB) rose by 79% 8. Mobile data revenue increased by 35%
6,000 2,000
(Millions VUV)
(Millions MB)
Data Traffic
1,500
Revenue
4,000
1,000
2,000
500
0 0
2017 2018 2019 2017 2018 2019
8|PageTRBR Telecommunications Sector Report 2020
9. International bandwidth rose by 185% 10. Fixed internet subscription risen by 67%
8,000 8000
Fixed Internet
Capacity Mbps
6,000
Scription
4,000 5000
2,000
0 2000
2017 2018 2019 2017 2018 2019
11. Fixed internet revenue increased by 71% 12. SMS volume dipped by 16%
1,500 110
(Millions VUV)
SMS Volume
100
(Millions)
1,000
Revenue
90
500
80
0 70
2017 2018 2019 2017 2018 2019
13. SMS revenue declined by 31% 14. International outbound call revenue dipped by 34%
130 160
Revenue (Million
110
140
(Millions)
Revenue
VUV)
90
120
70
50 100
2017 2018 2019 2017 2018 2019
15. International inbound roaming revenue risen by 14%
80.00
Revenue (Millions
60.00
40.00
VUV)
20.00
0.00
2017 2018 2019
9|PageTRBR Telecommunications Sector Report 2020
4. Gross Telecommunications Revenue
HISTORICAL TELECOMMUNICATIONS REVENUE
6.00
Billions VUV
5.00
4.00
3.00
2.00
1.00
0.00
2009 2010 2011 2012 2013 2014 2015 2016 2017 2018 2019
2 per. Mov. Avg. (Annual Revenue)
Figure 1 Illustrating Trend on Revenue Collected
Total market gross revenue has slipped by 9% to reach a lower point of less than VUV5 billion in 2019. The
slight decline reflects the global impact of the downward trend of voice and SMS revenue in the market.
While both mobile operators are continuously increasing value of their bundling services, the market has
experienced a huge downturn in voice and SMS traffic which drove the gross revenue trend downwards. This
is due to the fact that users are now paying for these bundled services at a much lower rate than the standard
pay as you go (PAYG) rates, which tend to impact voice and SMS revenue for the service providers. Other
factors contributing to this trend include the decline in international outbound call traffic and the review of
international call rates by operators, the decline of fixed telephony revenue, introduction of mobile prepaid
All in One service.
Though the impact is visible, the market outlook remains positive as mobile data and fixed internet services
revenues are growing significantly, indicating positive trends for the future with the current conditions.
10 | P a g eTRBR Telecommunications Sector Report 2020
5. Mobile Phone Services
Mobile phone services have shown prodigious potential to stimulate sustainable development in Vanuatu,
acting as a tool to bridge the socio-economic and information and communications gaps and assist in
empowering individuals. Building on the basic connectivity that is now available, mobile services have
continued to empower people by connecting those who are geographically or socially isolated to a wider
society, thus allowing them to access vital information and services from a range of sources, including the
Government and the internet. Although some remote areas still require improvement, the increase in
availability and accessibility of mobile networks and technologies has been a major benefit for a broad-range
of Ni-Vanuatu people.
5.1. Mobile Subscriptions
MOBILE SERVICES
100%
250,000
90%
Mobile Subscription ('000)
200,000 80%
% Mobile Pentecost
70%
150,000
60%
100,000 50%
40%
50,000
30%
0 20%
2009 2010 2011 2012 2013 2014 2015 2016 2017 2018 2019
Linear (Mobile Subcription) Linear (Mobile Penetration)
Figure 2: Vanuatu Mobile Subscribers & Penetration
Mobile cellular subscription in Vanuatu continued to show prominent growth in 2019. The trend in Figure 2
illustrates an annual increase in mobile subscriptions by 5% from 2018 to record more than 260,000
subscribers in 2019. The growth has been facilitated by the on-going investments and commitments from
both mobile operators to extend and upgrade their networks and capacity to meet the growing demand for
the mobile services and connectivity throughout Vanuatu. The continued deployment of new towers and
upgrades of existing ones to accommodate 3G, 3G+ and 4G/LTE technology around Vanuatu has also
contributed significantly to this growth.
Furthermore, with the increase in mobile subscriptions and improvement of mobile coverage, mobile
penetration as shown in Figure 2 above has grown to a 92% penetration rate in 2019. While this penetration
calculation does not eliminate the effect of dual SIM mobile handsets, another important factor contributing
11 | P a g eTRBR Telecommunications Sector Report 2020
to the growth in mobile subscriptions and high mobile penetration rate is due to the increase in multiple
device ownership.
5.2. Mobile Call Revenue Vs Call Traffic
TOTAL MOBILE CALL REVENUE VS CALL TRAFFIC
2,000 700
Million Minutes
1,800
Millions VUV
600
1,600
1,400 500
1,200 400
1,000
800 300
600 200
400
100
200
0 0
2014 2015 2016 2017 2018 2019
Mobile Call Revenue Mobile Call Traffic
Figure 3 Mobile Call Revenue Vs Mobile Call Traffic
Mobile call revenue continued its downward trend to record its lowest revenue reaching slightly above
VUV820 million in 2019. This represents a decline of 16% between 2018 and 2019 from a total revenue of
around VUV980 million in 2018. Figure 3 illustrates a first sudden drop of mobile call traffic by 45%, recording
only less than 334 million minutes in 2019. This is due to the on-going uptake of OTT services as a substitute
for mobile call services.
The downward trend of mobile call revenue has also been experienced due to the competition involving
both the two major telecommunication operators in Vanuatu. The intense and effective competition has
compelled the operators to introduce bundled services at low rates in the market. Though the impact of
these low packages is visible in the mobile market, OTT services is also having a significant impact on the
declining mobile call revenue.
12 | P a g eTRBR Telecommunications Sector Report 2020
5.3. Average National Mobile Call Pricing
AVERAGE MOBILE CALL PRICING
VUV 16.00
VUV 14.00
Average Price (VUV)
VUV 12.00
VUV 10.00
VUV 8.00
VUV 6.00
VUV 4.00
VUV 2.00
VUV 0.00
2014 2015 2016 2017 2018 2019
Aerage Prepaid Price Average Postpaid Price
Combine Weighted Average Price Linear (Combine Weighted Average Price)
Figure 4: Average Mobile Call Pricing
Figure 4 illustrates that average prepaid calls has fallen from 2018 by 24% recording a lower price of VUV2.17
per minutes in 2019. Furthermore, postpaid price has also gone down from 2018 by 23% hitting its lowest
point of VUV8.86 per minute in 2019. In contrast, the combined weighted average price per minute has
increased from 2018 by 52% hitting VUV2.46 per minute in 2019. The price increase has occurred due to the
sudden drop in the total mobile call minutes from 2018 by 45% recording a total minute of less than 300
million minutes in 2019. TRBR accepted the rationale for the increase and continues to actively monitor any
price increase.
13 | P a g eTRBR Telecommunications Sector Report 2020
5.4. Average Mobile Revenue per Subscriber
AVERAGE MOBILE CALL VS DATA REVENUE PER USER
12,000
Average Reveue (vu)
10,000
8,000
6,000
4,000
2,000
0
2014 2015 2016 2017 2018 2019
Mobile Call ARPU Mobile Data ARPU
Figure 5: Mobile Call ARPU Vs Mobile Data ARPU
When considering Average Revenue per user (ARPU), Figure 5 illustrates that the average mobile call
revenue per user has continued to decline, recording a lower revenue point of below VUV3,200 per user in
2019. In contrast, average mobile data revenue per user has further increased by 9% to over VUV6,000 per
user in 2019.
14 | P a g eTRBR Telecommunications Sector Report 2020
6. Internet Services
The original and primary means of access has been dominated by dial-up services for many years, but recent
technological innovations and rapidly decreasing prices of broadband internet has stimulated a growth in
demand and supply for internet services.
TRBR continues to assess and address the challenges of accessibility and affordability, and currently Wantok,
Pacific Link Limited (PLL), Spim and Telsat continue to provide fixed internet in both urban areas while Digicel
and TVL/Vodafone continue to serve both urban and rural areas through provision of mobile internet
services.
6.1. International Bandwidth.
The international bandwidth made available to the local market is driven by a growing demand for the
provision of higher internet capacity as demand for data by the mobile broadband users continues to grow.
The provision of access by the ICL underwater cable provides attribution of higher transmission speed of
large data with very little latency, and this has boosted demand from local operators and consumers
stimulating explosion of data volumes currently offered in the Telecom sector.
TOTAL INTERNATIONAL BANDWIDTH SOLD
8,000
7,000
Capacity (Mbps)
6,000
5,000
4,000
3,000
2,000
1,000
0
2014 2015 2016 2017 2018 2019
Figure: 6 International Bandwidth
International bandwidth market has experienced a rapid growth as market demand continues to rise. Figure
6 illustrates that the international bandwidth made available to the local market has almost tripled, with the
capacity sold having soared by 185% hitting its highest peak of nearly 8Gbps by the end of 2019.
15 | P a g eTRBR Telecommunications Sector Report 2020
6.2. Mobile Broadband Services
The Vanuatu telecom sector continues to experience significant digital transformation as mobile network
carriers commit significant investments into upgrading their networks to provide mobile internet and data
transmission throughout the islands of Vanuatu.
6.2.1. Mobile Data Traffic
Digitalization and virtualization trends are playing a very important role in the explosive growth of mobile
data traffic as the market continues to experience a rapid increase in demand for mobile broadband services.
As illustrated in Figure 8, total mobile data traffic has sharply increased by 79% hitting a peak of over 3,800TB
in 2019.
There are several important factors contributing to this enormous use of data, one of which is the increasing
use of smartphones. With affordable smartphones available on the market, combined with the now range
of affordable mobile data plans, this has resulted in a continuous increase in mobile data traffic.
TOTAL MOBILE DATA DOWNLOAD TRAFFIC
4,000
Data Traffic (Millions MB)
3,500
3,000
2,500
2,000
1,500
1,000
500
0
2014 2015 2016 2017 2018 2019
Figure 7: Showing growth of Mobile Data Traffic
Furthermore, the on-going investment and deployment of 3G, 3G+ and 4G/LTE network infrastructure
around Vanuatu is also facilitating and enabling the growth of mobile data traffic, as mobile broadband
coverage continues to extend around Vanuatu, thus stimulating the growth of mobile data subscribers.
This growth outlook can be expected to remain positive, with mobile data traffic anticipated to significantly
increase in the next few years as demand and supply for mobile data services can be expected to persist.
16 | P a g eTRBR Telecommunications Sector Report 2020
6.2.2. Mobile Data Revenue Vs Mobile Voice Revenue
The increase in available connectivity and accessibility continues to boost the usage of mobile technologies,
which in turn provides access to a range of services, including vital life-enhancing services from the
Government and private sector. While mobile calls have been a dominant revenue stream for the Telecom
operators for many years, the opportunity to generate revenues from mobile data has overtaken mobile call
revenue in 2018 and, since then, mobile data revenue continues to grow reaching an annual revenue of over
VUV1.5 billion in 2019. This represents an annual growth rate of 35% in 2018.
MOBILE DATA REVENUE VS MOBILE VOICE REVENUE
450
Revenue (Millions VUV)
400
350
300
250
200
150
100
50
0
Q1 Q2 Q3 Q4 Q1 Q2 Q3 Q4
2018 2019
Mobile Data Revenue Mobile Call Revenue
Figure 8 Showing Mobile Data Revenue Vs Mobile Voice Revenue
Comparing both revenue streams over each quarter of 2018-2019, Figure 9 illustrates that mobile data
revenue continued its upward trend over the quarters, peaking to over VUV407 million in Q4 of 2019. On
the other hand, mobile call revenue has continued to decline over these quarters recording its lowest
revenue of below VUV211 million in Q4 of 2019. An important factor contributing to these trends is the use
of mobile data services in lieu of mobile voice, and the fact that users are substituting call services for OTT
services as their primary means of communication.
6.2.3. Average Price of Mobile Data
An effective and competitive environment in Vanuatu has encouraged and necessitated service providers to
develop innovative strategies, solutions and ways of attracting users to consolidate their data customer base,
and this includes offering competitive mobile data packages bundled with high volumes of voice and SMS
which tends to reduce the average mobile data price per Mb.
17 | P a g eTRBR Telecommunications Sector Report 2020
MOBILE DATA AVERAGE PRICING
4.00
3.50
3.00
Price (VUV)
2.50
2.00
1.50
1.00
0.50
0.00
March June Oct Dec March June Oct Dec
2018 2019
Prepaid Postpaid
Figure 9: Showing Mobile Data Average Pricing
Figure 10 illustrates the average mobile data price trend for both Prepaid and Postpaid over the quarters of
2018-2019. The figure illustrates that the average prepaid mobile pricing has fallen by 35% from Q4 of 2018
to record a lowest average price of VUV0.34/MB in Q4 of 2019. Furthermore, the average postpaid pricing
has also declined from 2018 by 31% to reach a low average price of VUV0.37/MB in Q4 of 2019. The
fluctuation in average prices, especially for the postpaid prices, was due to continuous increase of values of
existing packages and offers by service providers that has led to stimulating an explosion of data traffic since
quarter 3 of 2018. Consequently, this has encouraged growth of revenue while at the time lowering the
average prices.
6.3. Fixed Internet Services
The current technological advancements in the fixed internet market has been a result of increasing reliance
on the internet as a necessity – not just a convenience – for businesses and leisure. Growing data usage by
businesses and consumers, and the rise in web accessibility is a driving factor for the growth of the fixed
internet market in addition to the ever-increasing use of mobile internet.
6.4. Fixed Internet Subscriptions
The now growing trend of digitalization of services has resulted in the development of, and shift towards,
high speed internet. This in turn, allows customers to enjoy a broader range of services at (now) relatively
lower costs that enables providers to offer better quality of service and a wider range of services. This trend
and uptake have stimulated the total annual fixed internet subscriptions to grow from 2018 by 67% hitting
over 7,800 subscribers in 2019.
With this growth, statistics shows that Fiber to Home (FTH) subscriptions went up by 8% with a huge jump
in revenue earned by the service providers by 107% in 2019. The fixed wireless market also recorded an
18 | P a g eTRBR Telecommunications Sector Report 2020
increase in subscription by 57% recording over VUV590 million in 2019 while satellite subscription continued
to experience a moderate growth of 12% recording just over VUV15 million revenue in the same year.
6.5. Fixed Internet Revenue
The on-going upgrade of fixed internet infrastructure with improved speeds and capacity to provide voice
calls, internet access, video streaming and conferencing and data usage for other purposes continues to
stimulate demand for higher speed internet services, as small and large enterprises, homes, education
institutions and offices continue to rely on this service for conducting their business, transactions, and
provision and dissemination of information via their internet connections.
TOTAL FIXED INTERNET REVENUE
1,200
Revenue (Millions VUV)
1,000
800
600
400
200
0
2014 2015 2016 2017 2018 2019
Figure 10: Showing Total Internet Revenue
Because the market is experiencing an upsurge in demand of fixed internet services, Figure 11 shows that
the total annual fixed internet revenue has also grown from 2018 recording its peak of over VUV900 million
in 2019. With the growth rate of 71% in 2019, fixed internet revenue is projected to increase significantly in
the next few years as demand for home internet is expected to increase as well as business use.
19 | P a g eTRBR Telecommunications Sector Report 2020
6.6. Average Fixed Internet Revenue per Subscriber
AVERAGE REVENUE PER SUBSCRIBER
140
120
Revenue VUV ('000)
100
80
60
40
20
0
2014 2015 2016 2017 2018 2019
Figure 11: Showing Trend of Fixed internet Revenue per Subscriber
Fixed internet revenues per subscriber has risen by 2% as subscriptions increased by 67% in 2019. This was
driven by the increasing demand for high-speed internet as all types of users continue to subscribe to faster
and larger internet packages. The increase in the use of fixed internet data has resulted in and been an
encouragement to users to allocate more money to internet services. Thus, boosting revenue per subscriber
as illustrated in Figure 12.
20 | P a g eTRBR Telecommunications Sector Report 2020
7. Short Message Service (SMS)
Service providers continue to face challenges of compensating their revenue because of the on-going decline
in the revenue streams from SMS. This has occurred because of the use of instant messaging platforms
becoming more common for users as compared to traditional SMS.
7.1. SMS Traffic & Revenue
With the uptake of mobile technologies and shift of consumption behaviors, instant messaging is an
emerging revenue stream that operators are looking at to offset the downfall of traditional SMS revenue
with new business models.
SMS VOLUME VS SMS REVENUE
250
200
Millions
150
100
50
0
2014 2015 2016 2017 2018 2019
SMS Revenue SMS Volume
Figure 12: Showing Trend of Traditional SMS Revenue & Volume
This increase in the availability and consumer desire for OTT instant messaging services has led to a further
decline in SMS volume by 16% recording a total of below 83 million SMS exchanged in 2019. SMS revenue
on the other hand also went down by 31% earning only less than VUV77 million in the same year. The
features of these instant messaging services, such multiple user messaging and instant file sharing
capabilities at lower costs, has provided an efficient and convenient way of communication. This has
encouraged consumers to prioritize instant messaging over SMS resulting in the decline in SMS revenues.
Though SMS revenue is expected to continue its fall, operators keep creating innovative ways such as
competitive SMS bundling and value-added services using SMS to levy revenue from this service and mitigate
the risk of further reducing revenues from SMS.
The trend of traditional SMS revenue versus SMS volume is shown in Figure 12.
21 | P a g eTRBR Telecommunications Sector Report 2020
7.2. Average SMS Pricing
While Digicel’s advertised PAYG price per SMS remained at VUV10 for on-net and VUV12 off-net, Vodafone
continued to charge VUV11 per SMS for both on-net and off-net in 2019. The level of competition in the
market has enabled both mobile operators to become more innovative in creating and offering promotions
and bundling packages which tend to drive SMS average prices down.
AVERAGE SMS PRICING
10.00
8.89
9.00
8.00
7.00 6.5
Price (VUV)
6.00
5.00
4.00
3.00
2.00 1.13
0.88 0.72 0.93
1.00
0.00
Prepaid Price Postpaid Price Combine Weighted Price
2018 2019
Figure 13: Showing Average SMS Pricing
As illustrated in Figure 13, average SMS prepaid price has plummeted by 18% to reach a lower unit price of
VUV0.72 per SMS in 2019. Average postpaid price, on the other hand, has also dipped by 27% to VUV6.50
per SMS in the same year. With the significant fall in both average prepaid and postpaid SMS prices, average
combined weighted SMS price has also dropped to its lowest point of VUV0.93 per SMS in 2019. This
represents an annual decline of 18% from an average price of VUV1.13 in 2018.
The downward trend reflects the impact of the on-going consumers’ substitution for OTT services which
tend to divert revenue to mobile data. This has resulted in the significant decline in SMS revenue causing
average SMS price to fall as well.
7.3. On-net and Off-net SMS
The SMS market continued to experience its downward trend. Data collected by TRBR shows that on-net
SMS volume has dropped by 14% to below 81 million SMS in 2019 and earning of only VUV53 million in
revenue. In a similar way, off-net SMS volume has also declined to record only 2.8 million SMS in 2019 and
its revenue went down by 29% to hit a lower point of below VUV24 million in the same year. The major
contributing factor to this decline was the huge growth in mobile data usage which stimulated the use of
instant messaging services at the detriment of SMS services.
22 | P a g eTRBR Telecommunications Sector Report 2020
8. Fixed Telephony Services
Fixed line-telephone network remains as the backbone communications for many corporate businesses,
Government Institutions, and individuals in Vanuatu. Although the global voice trend is declining, service
providers continue to upgrade, innovate, and invest in new technologies to provide consumers with more
reliable services over fixed network.
8.1. Fixed Telephony Subscription
With digital transformation, service providers continue to migrate their landline customers from copper to
VOIP over fibre and wireless broadband network and, further, bundling it with broadband services.
FIXED LINE TELEPHONE SUBSCRIPTION
6
5
Subscribers (000)
4
3
2
1
0
2014 2015 2016 2017 2018 2019
Figure 14: Showing Fixed Line Telephone Subscription
Regardless of how innovative the service providers may be, Figure 14 illustrates that fixed-line telephone
market continued to experience a significant decline in total number of active analogue fixed lines and voice-
over-IP (VoIP) subscriptions. Statistics collected shows that total subscriptions went down by 8% hitting its
lowest point of below 3,800 subscribers in 2019. This trend can be expected to continue descending in the
future as mobile services continue to experience rapid uptake in popularity and usage.
23 | P a g eTRBR Telecommunications Sector Report 2020
8.2. Fixed Line Telephone Revenue
The total fixed call minutes has increased by 31% recording over 12 million call minutes in 2019 but, in
contrast, Figure 15 shows that fixed line telephone has experienced steady decline in its total revenue.
FIXED LINE TELEPHONE REVENUE
340
Revenue (Millions VUV)
320
300
280
260
240
220
200
180
2014 2015 2016 2017 2018 2019
Figure 15: Showing Fixed Line Telephone Revenue
Monitoring data acquired by TRBR showed that revenue has dropped to its lowest point of below VUV244
million in 2019. This represent an annual decline rate of 5% from a total revenue of VUV256 million in 2018.
This downward trend can be expected to continue in the future.
24 | P a g eTRBR Telecommunications Sector Report 2020
9. International Calls
Over the past 4 years, the international voice communications market has been experiencing substantial
decline in both call minutes and revenue. This, however, reflects a permanent structural shift because of the
mass adoption of new OTT communications or VoIP services that are reforming the international
communications market.
9.1. International Outbound Call Traffic
As the international voice market experiences downturn, international outbound calls are moving in a same
direction. Data presented in Figure 16 shows that total international outbound call traffic has dropped by
22% recording only less than 1.9 million minutes in 2019.
INTERNATIONAL OUTBOUND CALL REVENUE VS TRAFFIC
300 5,000
Minutes ('000)
Revenue (Million VUV)
4,500
250 4,000
200 3,500
3,000
150 2,500
2,000
100 1,500
50 1,000
500
0 0
2014 2015 2016 2017 2018 2019
Outbound Call Revenue Outbound Calll Traffic
Figure 16: Showing International Outbound Call Revenue & Traffic
Total international outbound call revenue also went down by 18%, earning revenues of less than VUV107
million in the same year. This trend can be expected to continue as the impact of increasing use of alternative
services, such as OTT, is expected to continue to grow in influence and adoption.
25 | P a g eTRBR Telecommunications Sector Report 2020
9.2. International Call Roaming
International mobile roaming is one of a wider range of communications service which extends the coverage
of the home operator’s voice and SMS services by allowing mobile users to continue using their home
operator phone number on another operator’s network in that country.
Over the past 2 years, the international call roaming communications market experienced significant
changes. The average price per minute has dropped dramatically by 11% in 2019 while international call
roaming volume has increased by 39% hitting over 6 million minutes in 2019 and overall international voice
roaming revenue has increased by 24% recording over VUV114 million in 2019.
9.2.1. International Outbound Roaming
INTERNATIONAL OUTBOUND ROAMING
1,400 14,000
Revenue VUV (000)
Call Minutes (000)
1,200 12,000
1,000 10,000
800 8,000
600 6,000
400 4,000
200 2,000
0 0
Q3 Q4 Q1 Q2 Q3 Q4
2018 2019
Linear (Traffic ) Linear (Revenue)
Figure 17: Showing International Outbound Roaming Call Traffic & Revenue
While total outbound roamers have increased by 2% recording over 3,000 roamers in 2019, Figure 17 shows
that the market has experienced a significant decline in the uptake of outbound roaming services throughout
the year 2018 and 2019. Data presented shows that the total roaming minutes has fluctuated and fell
throughout the quarters recording less than 950 thousand call minutes in Q4 of 2019. This fall represents a
decline of 7% from a total minute of over 1 million minutes in Q4 of 2018. In contrast, revenue is also
fluctuating while going down the same trend earning less than VUV8.5 in Q4 of 2019. This again represents
a declining rate of 34% from over 12 million worth of revenue recorded in Q4 of 2018.
Though both indicators seem to be fluctuating, the uptake of this service depends entirely on the number of
the local customers who are willing and able to afford this service while travelling overseas.
9.2.2. International Inbound Roaming
26 | P a g eTRBR Telecommunications Sector Report 2020
The international inbound roaming market has experienced a dip in the total number of roamers with less
than 34,000 inbound roamers in 2019. This was a decline of 8% from a total of 37,000 inbound roamers
recorded in 2018.
INTERNATIONAL INBOUND ROAMING
700 30,000
600 25,000
Call Minutes (000)
Revenue VUV (000)
500
20,000
400
15,000
300
10,000
200
100 5,000
0 0
Q1 Q2 Q3 Q4 Q1 Q2 Q3 Q4
2018 2019
Linear (International Inbound Traffic) Linear (International Inbound Revenue)
Figure 18: Showing Trend of International Inbound Minutes & Revenue
With the decline in the total number of inbound roamers, total inbound roaming traffic has been fluctuating
throughout the quarters of 2019, rising from its lowest point of 470,000 minutes in Q1 2019 hitting its peak
of over 600,000 minutes in Q3 of 2019 which then fell to below 550,000 minutes in the following quarters.
In contrast, revenue has also experienced a same pattern throughout the quarters recording a peak revenue
of over VUV22 million in Q3 of 2019 and fell to below VUV20 million the following quarter.
Though both international inbound roaming traffic and revenue has been fluctuating, Figure 19 shows that
traffic trend has remained relatively steady throughout the quarters of 2018 and 2019 recording an annual
decline of 4% in 2019 while the revenue trend was experiencing a steady rise with an annual growth rate of
14 % earning over VUV76 million in 2019.
27 | P a g eTRBR Telecommunications Sector Report 2020
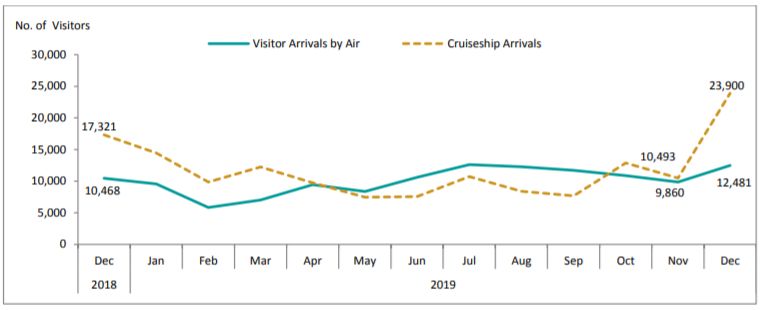
Figure 19: Statistics from Vanuatu National Statistics Office (VNSO)
Statistics collected by the Vanuatu National Statistics Office (known as VNSO) shows that the total numbers
of visitors have increased by 31% in 2019, however, total number of international roamers through data
collected by TRBR has declined.
28 | P a g eTRBR Telecommunications Sector Report 2020
10. CONCLUSION
For the Vanuatu telecommunication sector, technological advancements and digitalization has continued to
facilitate and stimulate the uptake of telecommunications services for both residential and corporate
customers. At same time, with continued and increasing market competition, consumers are being
empowered through the on-going provision of a wider variety of services together with an improved value
of packages offered. Given telecommunications/ICT services continue to be a vital and essential component
of the backbone of Vanuatu’s economy, digitalization and virtualization are important developments that
facilitate and create new opportunities for growth across all other sectors.
The on-going upgrades of mobile networks to 3G, 3G+ and 4G/LTE technologies, together with the increasing
adoption of mobile smart phones devices, foster the uptake of mobile data services. This uptake has led to
the increase in the number of mobile subscriptions, thus boosting a rapid increase in the mobile data traffic.
This has also stimulated growth in mobile data revenue for operators. Mobile data revenue has now become
the dominant revenue stream for the mobile operators in Vanuatu.
Vanuatu has had significant achievements in terms of connectivity, but there is a massive need and drive for
full accessibility throughout the archipelago. While the telecom sector has experienced a boom in data
traffic, stimulated through online content such as, YouTube, Netflix and other platforms, there is still a lack
of services such as quality healthcare, education and availability of banking services to the masses of Ni-Vans
in the remote areas of Vanuatu. This has been a major challenge for inclusive socio-economic growth of this
nation and can practically only be addressed through relevant Government ICT related and other policies,
building on the Government’s Universal access Policy (under TRBR’s stewardship).
The provision of internet and telephone services have become essential for so many sectors of the economy
now and their reliance on these services to develop and deliver their own goods and services; particularly
as it is seen to be reducing the cost of logistics and communications. Thus, all stakeholders across every
sector are encouraged to continue collaborating with the Vanuatu Government, TRBR and key industry
stakeholders to develop modern services like tele-presence, e-learning, tele-medicine and direct banking in
order to provide/change the business models across industries and to expand the telecom-based, and on-
line based, services.
29 | P a g eYou can also read