ESB PLATFORM INTEGRATING KNIME DATA MINING TOOL ORIENTED ON INDUSTRY 4.0 BASED - Aircc Digital Library
←
→
Page content transcription
If your browser does not render page correctly, please read the page content below
International Journal of Artificial Intelligence and Applications (IJAIA), Vol.9, No.3, May 2018

  ESB PLATFORM INTEGRATING KNIME DATA
MINING TOOL ORIENTED ON INDUSTRY 4.0 BASED
 ON ARTIFICIAL NEURAL NETWORK PREDICTIVE
               MAINTENANCE
    Alessandro Massaro, Vincenzo Maritati, Angelo Galiano, Vitangelo Birardi,
                              Leonardo Pellicani

   Dyrecta Lab, IT research Laboratory, via Vescovo Simplicio,45, 70014 Conversano
                                      (BA), Italy

ABSTRACT
In this paper are discussed some results related to an industrial project oriented on the integration of data
mining tools into Enterprise Service Bus (ESB) platform. WSO2 ESB has been implemented for data
transaction and to interface a client web service connected to a KNIME workflow behaving as a flexible
data mining engine. In order to validate the implementation two test have been performed: the first one is
related to the data management of two relational database management system (RDBMS) merged into one
database whose data have been processed by KNIME dashboard statistical tool thus proving the data
transfer of the prototype system; the second one is related to a simulation of two sensor data belonging to
two distinct production lines connected to the same ESB. Specifically in the second example has been
developed a practical case by processing by a Multilayered Perceptron (MLP) neural networks the
temperatures of two milk production lines and by providing information about predictive maintenance. The
platform prototype system is suitable for data automatism and Internet of Thing (IoT) related to Industry
4.0, and it is suitable for innovative hybrid system embedding different hardware and software technologies
integrated with ESB, data mining engine and client web-services.

KEYWORDS
ESB, Data Mining, KNIME, Industry 4.0, Predictive Maintenance, Artificial Neural Networks (ANN), MLP
neural network.

1. INTRODUCTION
Open source Enterprise Service Bus (ESB) platforms have been discussed in the scientific
research as important issues for IT architects working on Service Oriented Architecture (SOA)
and for Enterprise Application Integration (EAI) [1]-[3]. Particular attention has been focused
on the performance of WSO2 open source ESB able to manage simultaneously 50 threads [3]
and to integrate different functionalities such as enterprise integration patterns, deliverable of all
ESB features, completion of SOA, SOA governance, graphical ESB development, compostable
architecture, cloud integration platform, availability of cloud connectors and of lagacy adapters,
ultrafast performance (low computational cost), security and identify management, and open
business model [4]. Concerning Industry 4.0, information digitization, and integration of
different technologies are important elements for the development of connected and adaptive
productions [5]. In this direction ESB could support Enterprise Integration Patterns (EIPs) about
the use of enterprise application integration and message-oriented middleware in pattern
language forms [1],[6]. In this direction data mining engines could improve the best pattern as
for pattern-based manufacturing process optimization [7]. Interesting applications of data
mining and artificial intelligence (A.I.) in industrial production process are in maintenance [8],
DOI : 10.5121/ijaia.2018.9301                                                                            1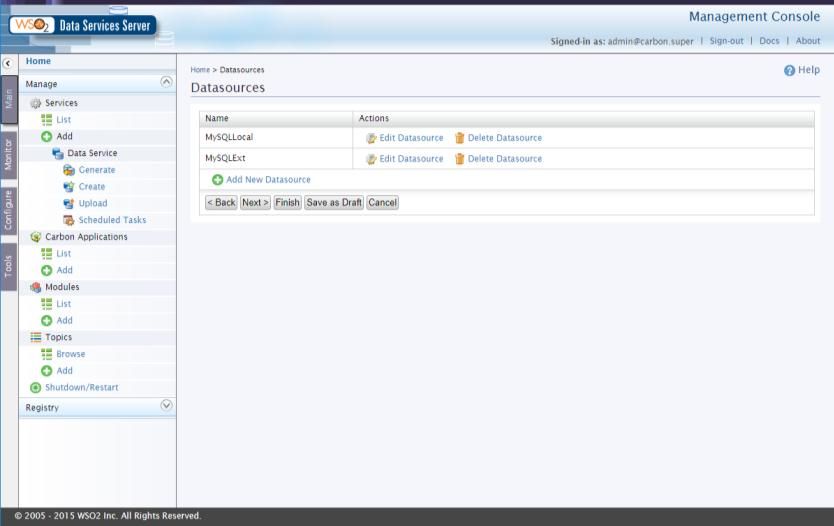
International Journal of Artificial Intelligence and Applications (IJAIA), Vol.9, No.3, May 2018
in predictive maintenance reading Internet of Thing (IoT) sensor data [9],[10],[11], and
generally in predictive analytics [12]. As open source data mining tools oriented on research we
remember R language, RapidMiner, Weka, KNIME, Orange Canvas, and Tanagra [13],[14]. In
particular KNIME is suited for web service connection [15], thus representing a good candidates
for integration in an ESB network. Also Machine to Machine (M2M) systems could be
integrated in a ESB network improving big data storage systems as Cassandra technology [16].
According with the requirements found in the state of the art, authors have developed in this
work the information system infrastructure reported in Fig. 1 (a), which is related to an
innovative integrated ESB system suitable for data transfer in Industry 4.0 processes. The layout
has been designed by Aris Express, a graphical tool useful for process simulation [17]. In the
proposed scheme are indicated the following modules:
WSO2 Complex Event Processor (CEP): this module is suitable for the efficient
management of processes and for the event scheduling; it helps to identify events and
patterns from multiple data sources, analyze their impacts, working on them in real
time;
WSO2 Analytics: this module collects events through multiple transports and messaging
formats; using streaming SQL to process streams, it detects complex events, performs
prediction using machine learning models, and generates and notifies alerts in real-time
by visualizing them with real time dashboards;
WSO2 Machine Learner: the module of Machine Learner allows to process data by data
mining algorithms using predefined parameters; for the best control of algorithms
outputs, and for the choice of different algorithms typologies is required an external data
mining tool; the algorithms that this module implements are related to numerical
prediction (linear regression, ridge regression, lasso regression, random forest
regression), binary classification (Logistic Regression SGD, Support Vector Machines –
SVM-), multiclass classification (logistic regression L-BFGS, Decision Tree, Random
Forest Classification, Naive Bayes), clustering and anomaly detection (k-Means),
anomaly detection, and deep learning (Stacked Autoencoders);
WSO2 IoT Server: this module is useful for direct communication between sensors of
different technologies and ESB network; it exposes an API to power a mobile app
allowing users to monitor and control different devices or sensors;
External data mining tool (KNIME): this external tool is able to improve advance
analytics related to predictive maintenance of the production lines; the external tool is
necessary to control data processing, to set the best parameters and to choice new
machine learning algorithms different to those implemented in WSO2 Machine Learner
modules, such as Artificial Neural Networks (ANN) [18],[19] well suitable for
predictive maintenance.
Starting from the infrastructure of Fig. 1 (a) authors focused the attention on the application of
the external data mining tool working by means of a web client service interfaced with the
prototype ESB network (see dashed part sketched in Fig. 1 (b)). In this way authors will apply
the most important functionalities of the prototype infrastructure enhancing the innovative
aspects of the research. The paper is structured as follows:
Development of the prototype of Fig. 1 (b) by performing a basic first test related to the
check of data transfer between client web service, KNIME and ESB; the outputs of this
test will prove the correct functionality of a KNIME workflow managed by ESB; this
preliminary test is fundamental in order to understand data flow process in the prototype
system;
2
International Journal of Artificial Intelligence and Applications (IJAIA), Vol.9, No.3, May 2018
Development of the prototype of Fig. 1 (b) by improving an advanced algorithm based
on ANN and simulating predictive maintenance of two production lines controlled by
temperature sensors.
(a)
Data
Client Web
Script Mining Dashboards Big Data Service
Tools
WSO2 Data Flow Process (Industry 4.0)
Event Machine
DSS Connector
Processor
Analytics IoT Learner
DS1 DS2
Database1 Database2
KNIME
(b)
Web
service
WSO2
ESB
DB 1 DB 2
Figure 1. (a) ESB prototype adopted in the industrial project. (b) Part of the developed prototype
concerning interconnection with KNIME tool.
3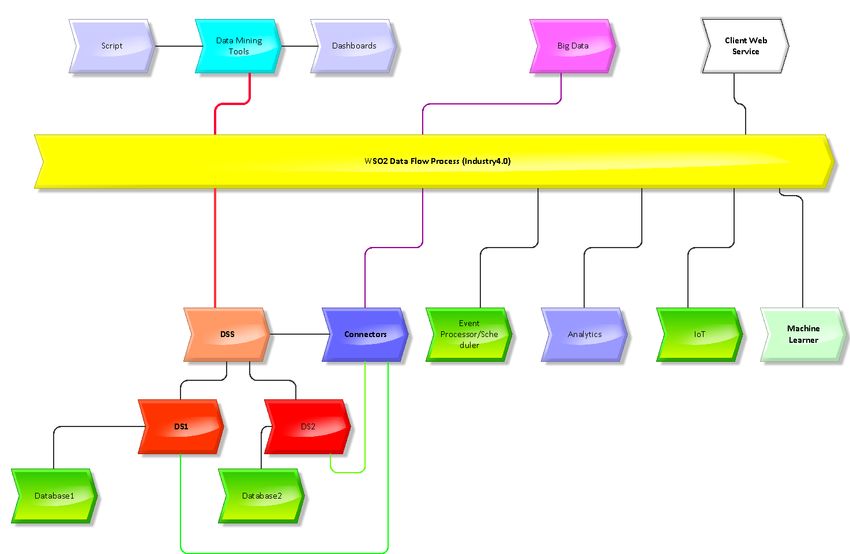
International Journal of Artificial Intelligence and Applications (IJAIA), Vol.9, No.3, May 2018
2. FIRST AND SECOND TEST OF THE PROTOTYPE PLATFORM
Figure 1 (b) illustrates the prototype part tested for checking data transfer and applied for the
implementation of artificial neural network algorithms. Specifically in Fig. 1 (b), ESB WSO2
platform manages two different relational database management system (RDBMS), named DB 1
and DB 2 which are datasources processed by a KNIME workflow, through a web-service. In the
next paragraphs will be discussed the test performed by applying the network prototype.
2.1. First test checking data flow in ESB infrastructure and main functionalities
The first implementation of the data flow of Fig. 1 (b) is related to a preliminary check useful to
verify ESB data management. Specifically two databases have been created by MySQL tool. The
first RDBMS has been structured in localhost by the following SQL script:
CREATE DATABASE PIMA;
DROP TABLE IF EXISTS `data`;
CREATE TABLE IF NOT EXISTS `data` (
`DiaID` bigint(20) NOT NULL,
`outcome` tinyint(4) NOT NULL,
PRIMARY KEY (`DiaID`)
) ENGINE=MyISAM DEFAULT CHARSET=latin1;
A second RDBMS has been created on other machine attainable by an IP address. The script
used for creation of the second RDBMS is the following one (768 patient data in medical
application):
CREATE DATABASE PIMA;
CREATE TABLE IF NOT EXISTS `data` (
`MedID` bigint(20) DEFAULT NULL,
`Pregnancies` decimal(8,2) DEFAULT NULL,
`Glucose` decimal(8,2) DEFAULT NULL,
`BloodPressure` decimal(8,2) DEFAULT NULL,
`SkinThickness` decimal(8,2) DEFAULT NULL,
`Insulin` decimal(8,2) DEFAULT NULL,
`BMI` decimal(8,2) DEFAULT NULL,
`DiabetesPedigreeFunction` decimal(8,2) DEFAULT NULL,
`Age` decimal(8,2) DEFAULT NULL,
PRIMARY KEY (`MedID`)
) ENGINE=InnoDB DEFAULT CHARSET=latin1;
For the database population has been adopted Python environment by using the open source editor
Jupyter Notebook, that is a script editor that allows to execute script parts independently from the
others and that allows also to insert documentation in the product code. Successively has been
created a data service on WSO2 DSS module able to connect to two different RDBMS, to
aggregate data (in this test is performed a merge process between personal data of the first
database with medical measured data of the second one), and to provide processed data at ESB
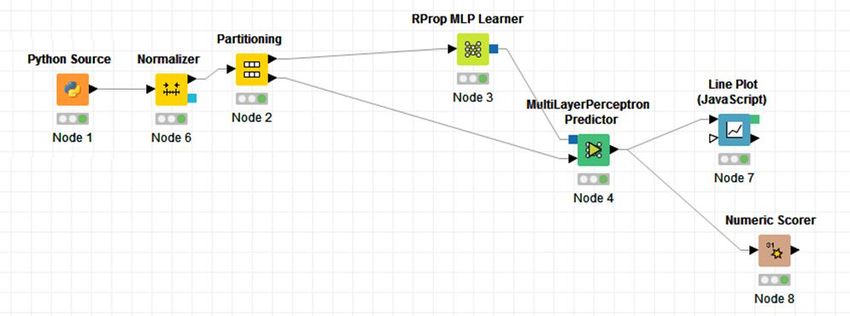
output. The WSO2 DSS platform has been installed locally, as one of the two MySQL servers. In
the WSO2 panel windows have been created the two datasources (named in Fig. 1 (a) by DS 1 and
DS 2) by means the command “Add Datasource”. In Fig. 2 is reported the screenshot related the
final creation of both datasources. In order to check the datasource management of WSO2 DSS
4International Journal of Artificial Intelligence and Applications (IJAIA), Vol.9, No.3, May 2018
ESB has been executed the following query SQL script (following the step “Next”-“Add new
query”):
Select MEDID, Pregnancies, Glucose, BloodPressure,Skinthickness, Insulin, BMI,
DiabetesPedigreeFunction, Age from data where MEDID = :DIAID
The response generation of the SQL script is illustrated in Fig. 3 thus representing the correct
datasource management of the ESB.
Figure 2. Screenshot of correct creation of the two datasources.
Figure 3. Screenshot of test.
The second datasource has been checked by the following script:
Select id as diad, outcome from data limit 5
After the check of datasource management in ESB has been tested the data service by creating a
Python script in a KNIME object. Zeep library has been adopted for the client web-service and
Pandas library has been used for KNIME interaction. The script used for the libraries call is the
following:
5International Journal of Artificial Intelligence and Applications (IJAIA), Vol.9, No.3, May 2018
from zeep import Client
from zeep.wsse.username import UsernameToken
import pandas as pd
import zeep
Below is indicated the script able to activate the client web-service (WSDL1.0 and WSDL2.0):
user = 'admin'
password = 'admin'
wsdl_url = 'http://192.168.0.102:9763/services/PimaIndians?wsdl'
client = Client(wsdl_url, wsse=UsernameToken(user, password))
After the webservice call, the data has been converted in an ordered data list and successively in
a dataframe by the following script
df = pd.DataFrame(my_data)
df.columns = [ 'id', 'outcome', 'Pregnancies', 'Glucose', 'BloodPressure', 'SkinThickness',
'Insulin', 'BMI', 'DiabetesPedigreeFunction', 'Age']
print (df)
thus providing the following output (are shown the first 5 rows )
id outcome Pregnancies Glucose BloodPressure SkinThickness Insulin
BMI \
0 0 0 1.00 85.00 66.00 29.00 0.00
26.60
1 1 1 8.00 183.00 64.00 0.00 0.00
23.30
2 2 0 1.00 89.00 66.00 23.00 94.00
28.10
3 3 1 0.00 137.00 40.00 35.00 168.00
43.10
4 4 0 5.00 116.00 74.00 0.00 0.00
25.60
5 5 1 3.00 78.00 50.00 32.00 88.00
31.00
DiabetesPedigreeFunction Age
0 0.35 31.00
1 0.67 32.00
2 0.17 21.00
3 2.29 33.00
4 0.20 30.00
5 0.25 26.00
The created dataframe will be passed to KNIME node able to process data.
In Fig. 4 is shown the KNIME workflow designed for the first test, where in the first node
named “Python Source” has been executed the following python script:
from zeep import Client
from zeep.wsse.username import UsernameToken
import pandas as pd
import zeep
6International Journal of Artificial Intelligence and Applications (IJAIA), Vol.9, No.3, May 2018
user = 'admin'
password = 'admin'
wsdl_url = 'http://192.168.0.102:9763/services/PimaIndians?wsdl'
client = Client(wsdl_url, wsse=UsernameToken(user, password))
d = client.service.GetAllDia()
my_dict = zeep.helpers.serialize_object(d)
my_data = []
for d in my_dict:
med = d['MedEntries']['MedEntry']
new_record = [ d['diaid'], d['outcome'], med[0]['Pregnancies'], med[0]['Glucose'],
med[0]['BloodPressure'], med[0]['SkinThickness'], med[0]['Insulin'], med[0]['BMI'],
med[0]['DiabetesPedigreeFunction'], med[0]['Age'] ]
my_data.append (new_record)
output_table = pd.DataFrame(my_data)
output_table.columns = [ 'id', 'outcome', 'Pregnancies', 'Glucose', 'BloodPressure',
'SkinThickness', 'Insulin', 'BMI', 'DiabetesPedigreeFunction', 'Age']
Figure 4. KNIME workflow of the first test.
The node “String to Number” will convert the string in data number to process, and the node
“Domain Calculator” will select the attributes to process (in this case all the attributes are
considered). In Fig. 5 is illustrted the output of the “Statistic” node proving the ESB-WSO2-
KNIME data tranfer and data processing.
7International Journal of Artificial Intelligence and Applications (IJAIA), Vol.9, No.3, May 2018
Row Min Std Variance
ID Column Max Mean
deviation
Outcome
Pregnancies
Glucose
Blood Pressure
Skin Thickness
Insulin
BMI
DiabetesPedigree
Age
Figure 5. KNIME: output of the “Statistic Node” (Node 6).
2.2. Second Test oriented on Industry 4.0 application: application of KNIME neural
networks for predictive maintenance of two production lines
The first example is useful to understand the basic principle of data management of the prototype
system. In this section, after an introduction of ANN, will be implemented the test of predictive
maintenance tool.
2.2.1. MLP Neural Network Theory
An MLP (or Artificial Neural Network - ANN) with a single hidden layer can be represented
graphically as in Fig. 6
Output layer
Hidden layer
Input layer
Figure 6. MLP neural network.
8International Journal of Artificial Intelligence and Applications (IJAIA), Vol.9, No.3, May 2018
An MLP consists of multiple layers of nodes in a directed graph, with each layer fully
connected to the next one. Except for the input nodes, each node is a neuron (or processing
element) with a nonlinear activation function.
Formally a one-hidden-layer MLP is a function f: RD RL being D the size of the input vector x
and L the size of the output vector f(x) defined as:
f ( x) G v (2) W (2) s v (1) W (1) x (1)
where v(1) and v(2) are the bias vectors, W(1) and W(2) the weight matrices, and G and s the
activation functions. The following vector
h( x) ( x) s v(1) W (1) x (2)
will define the hidden layer, and W(1) RDxDh is the weight matrix connecting the input vector to
the hidden layer. Wi(1) will represent the weights from the input units to the i-th hidden unit.
Typically the activation function s assumes the following forms
tanh(a) (ea e a ) /(ea e a ) (3)
sigmoid (a) 1/(1 e a ) (4)
The output vector is defined by:
o( x) G v(2) W (2) h( x) (5)
To train an MLP the model will be learned, the set of parameters to learn is
W (2) , v(2) ,W (1) , v(1) (6)
thus obtaining the gradients
l / (7)
of the back propagation algorithm adopted for the model training. Back propagation algorithm
is a supervised learning method which can be divided into two phases: propagation and weight
update. The two phases are repeated until the performance of the network is good enough. In
back propagation algorithms, the output values are compared with the correct answer to
compute the value of some predefined error-function. By various techniques, the error is then
fed back through the network. Using this information, the algorithm adjusts the weights of each
connection in order to reduce the value of the error function by some small amount. After
repeating this process for a sufficiently large number of training cycles, the network will usually
converge to some state where the error of the calculations is small. In this case, one would say
that the network has learned a certain target function.
2.2.2. Second test oriented on predictive maintenance
Temperature measurement is one of approach to control the production and some industrial
machines. For this purpose authors analyse in this section two parts of two milk production
9International Journal of Artificial Intelligence and Applications (IJAIA), Vol.9, No.3, May 2018
lines related the pasteurization process. In this process a key parameter to monitor is the
temperature: a good pasteurization process works within a range of 70 °C ÷ 75 °C, for this
reason it is important to control temperature trend during the time. In Fig. 7 (a) is illustrated the
simplified prototype infrastructure adapted to the predictive maintenance of milk pasteurization
process of two distinct production lines placed in different locations. The main function of the
ESB is the simultaneous control of pasteurization process in both different lines by predicting
possible anomalies and alerting conditions. Some researchers suggested the idea to create a
reference model based on the use of the use of Multilayered Perceptron –MLP- neural networks
and on temperature information useful to classify thermal defects in predictive maintenance
[20]. In this direction authors applied the same MLP algorithm of KNIME tool by considering
the client web-service related to the prototype of Fig. 1 (b), where the first datasource is defined
by the temperature dataset of the attribute T1 (temperature of the production line 1), and the
second datasource is defined by the temperature dataset of the attribute T2 (temperature of the
production line 2). The MLP algorithm can be viewed as a logistic regression classifier where
the input is first transformed using a learnt non-linear transformation. This transformation
projects the input data into a space where it becomes linearly separable by applying the theory
discussed in the section 2.1.1.. with a single hidden layer as intermediate layer sufficient to
make MLPs as an universal approximator.
For the training of the MLP neural network model (learner of the model) has been applied the
efficient RProp algorithm for multilayer feed-forward networks defined in [21],[22]: RProp
performs a local adaptation of the weight-updates according to the behaviour of the error
function. In this test case the neural network parameters are set as follows: the maximum
number of iteration equals to 100, the number of hidden layers is equals to 1, the number of
hidden neurons per layer is equals to 10, the class to predict is Col1 (temperatures of each
lines).
The predictive maintenance will be performed by comparing the predicted values with real
temperature trends of both datasources: in the case of a convergence will be a correct
functionalities of the line production machines, otherwise will happen potential anomalies.
10International Journal of Artificial Intelligence and Applications (IJAIA), Vol.9, No.3, May 2018
(a)
Production line 1 T1
ESB
Production line 2 T2
(b)
Figure 7. (a) Simplified model related to predictive maintenance process concerning the working
simulation of milk pasteurization machines.(b) Architecture integrating the simplified model.
In Fig. 7 (b) is illustrated the architecture integrating web-service in the prototype ESB
infrastructure interfaced with KNIME MLP neural network algorithm.
Below is the Python code used to query the web-service "GetLinesData", instanced on the
WSO2 DSS and related to the construction of a dataset based on the data retrieved from the two
MySQL databases where are stored the data collected on two different production lines:
from requests import Session
from requests.auth import HTTPBasicAuth
from zeep import Client
from zeep.transports import Transport
from zeep.wsse.username import UsernameToken
from pandas.io.json import json_normalize
import pandas as pd
import zeep
user = 'admin'
password = 'admin'
wsdl_url = 'http://192.168.0.102:9763/services/GetLinesData?wsdl'
client = Client(wsdl_url, wsse=UsernameToken(user, password))
lines_data = client.service.GetLinesData()
my_dict = zeep.helpers.serialize_object(d)
11International Journal of Artificial Intelligence and Applications (IJAIA), Vol.9, No.3, May 2018
my_data = []
for d in my_dict:
new_record = [lines_data ['id'], lines_data ['Line1'], lines_data ['Line2'], lines_data
['Timestamp'] ]
my_data.append (new_record)
output_table = pd.DataFrame(my_data)
output_table.columns = [ 'id', 'Line1', 'Line2', 'Timestamp' ]
In Fig. 8 is illustrated the KNIME workflow enabling the simultaneous pasteurization control
executing the RProp Learner and the MLP Predictor. The input datasets of the proposed model
are made by 168 values corresponding to the temperature measurements of seven days (1 value
of each hour) of both production lines. The “Normalizer” object is necessary to process data in
normalized temperature of a range between 0 and 1. The “Partitioning” block is able to split 80
data for the learner module (first partition) and 88 data for the MLP predictor (second
partition).
Figure 8. KNIME: MLP workflow model of predictive maintenance applied for each production line.
Figure 9 proves that Python code listed before has been loaded correctly in the KNIME engine.
12International Journal of Artificial Intelligence and Applications (IJAIA), Vol.9, No.3, May 2018
Figure 9. KNIME: configuration panel of the “Python Source” node 1.
As example In Fig. 10 are illustrated the first ten values of the “Partitionig” of the first
production line, where the attribute Col0 indicates the hour attribute, and Col1 the normalized
measured temperature attribute. It is important to note that both partitions are characterized by
different datasets.
Figure 10. KNIME “Partinioning” object: first and second partition of production line 1 (first 10 values).
In order to check the alarm condition has been defined a gap (see Fig. 11) of amplitude of 0.2
defined as an error bar of ± 0.1 centered to the average amplitude of the prediction line. If real
temperature values will overcome the threshold lines a potential anomaly will occur during the
pasteurization process. If real temperature trend is within the gap region the system will work
correctly as shown in the theoretical case of Fig.11.
13International Journal of Artificial Intelligence and Applications (IJAIA), Vol.9, No.3, May 2018
Normalised Temperature Threshold
Gap
Threshold
Real values Predicted values
Time
Figure 11. Theoretical good matching between predicted and real temperature values.
According with performed test on both the production lines is obtained the MLP neural network
outputs of Fig. 12 and Fig. 13, where are compared the predicted temperatures versus the real
ones. Figure 12 exhibits only one alert condition: after the first transitory related to a switching on
condition, temperature values are mainly within the gap region, by indicating that the production
line works correctly. In any case it is important to check the model in the next seven day in order
to control other alert conditions: a recurrence of alert conditions will represent a potential risk of
anomaly. In Fig. 13 is illustrated the test performed on the second production line. In this second
case more alert conditions are checked thus indicating that the line could work badly.
Alert
Figure 12. KNIME MLP model output: comparison between measured data and predicted ones of the
production line 1.
14International Journal of Artificial Intelligence and Applications (IJAIA), Vol.9, No.3, May 2018
Alert
Alert
Figure 13. KNIME MLP model output: comparison between measured data and predicted ones of the
production line 2.
According with scoring values it is possible to confirm that the applied model is reliable (a mean
absolute error equals to 0.04 is estimated). The proposed procedure can be adopted in different
applications involving healthcare [23] and for mapping industrial processes [24]. The ANN could
be implemented by means of a tailored architecture [25].
3. CONCLUSION
The goal of the proposed paper is to propose a data infrastructure model applicable in Industry 4.0
and suitable for control rooms. The performed tests prove that WSO2 ESB can be adopted to
transfer data coming from different databases and processed by the external KNIME data mining
engine through client-web services. The first example has been applied on medical data thus
confirming that the prototype model is oriented on different fields including healthcare
applications as for prevention of heart problem. Concerning industrial applications the ESB can
connect different information systems related to different production line. As proved in work,
predictive maintenance can provide important information about risks and production anomalies,
and could be applied with historical measured data in order to predict product quality by means of
provisional Xbar-charts and the R-charts, charts useful for the standard ISO 9001:2015. The
development of ANN requires a proper architecture network. In this direction ESB infrastructure
represent a good tool compatible with different operating systems and different hardware
machines thus providing in the same time web-service facilities. The shown results proved the
implementation feasibility of ANN in a ESB connected to a web-service system. The practical test
of monitoring predictive maintenance of two milk production lines by MLP ANN directs the
15International Journal of Artificial Intelligence and Applications (IJAIA), Vol.9, No.3, May 2018
research in innovative solutions for information technologies oriented on industrial applications
and industrial research.
ACKNOWLEDGEMENTS
The work has been developed in the frameworks of the Italian projects: “Sistemi software
interfacciabili e modulari orientati alla comunicazione di Industria 4.0 e all’ analisi avanzata dei
dati: -ModularIndustry4.0-. [Interfacable and modular software systems oriented on Industry 4.0
communication and on advanced data analysis: -ModularIndustry4.0-]”. The authors would like to
thank the following researchers and collaborators: D. Barbuzzi, G. Birardi, B. Boussahel, V.
Calati, D. Carella, A. Colonna, R. Cosmo, V. Custodero, L. D’Alessandro, G. Fanelli, M. Le
Grottaglie, A. Leogrande, A. Lombardi, G. Lonigro, A. Lorusso, L. Maffei, S. Maggio, N.
Malfettone, S. F. Massari, G. Meuli, R. Porfido, O. Rizzo, D. D. Romagno, N. Savino, P.
Scagliusi, S. Selicato, G. Sicolo, M. Solazzo, M. M. Sorbo, D. Suma, F. Tarulli, E. Valenzano, V.
Vitti and M. Dal Checco.
REFERENCES
[1] Hohpe, G., & Woolf, B. (2004) “Enterprise Integration Patterns Designing, Building, and Deploying
Messaging Solutions”, Addison-Wesley.
[2] Polgar, J. (2009) “Open Source ESB in Action”,IGI Publishing.
[3] Górski, T., & Pietrasik, K. (2016) “Performance analysis of Enterprise Service Buses”, Journal of
Theoretical and Applied Computer Science, Vol. 10, No. 2, pp 16-32.
[4] Yenlo (2016) “ESB Comparison How to choose a reliable and fast ESB that fits your business
needs”, white paper.
[5] Fraunhofer Institute report: INDUSTRY 4.0 – CONNECTED, ADAPTIVE PRODUCTION. white
paper available on line.
https://www.ipt.fraunhofer.de/content/dam/ipt/en/documents/broschures/Industry%2040-
Connected%20Adaptive%20Production.pdf
[6] Theorin, A., Bengtsson, K., Provost, J., Lieder, M., Johnsson, C., Lundholm, T., Lennartson, B.
(2017) “An Event-Driven Manufacturing Information System Architecture for Industry 4.0”,
International Journal of Production Research, Vol. 55, No.5, pp1297-1311.
[7] Gröger, C., Niedermann, F., Mitschang, B. (2012) “Data Mining-Driven Manufacturing Process”,
Proceedings of the World Congress on Engineering (WCE 2012), volume III, London, U.K..
[8] Bastos, P., Lopes, I., Pire, L. (2014) “Application of Data Mining in a Maintenance System for
Failure Prediction. Safety, Reliability and Risk Analysis: Beyond the Horizon”, Steenbergen et al.
(Eds), Taylor & Francis, pp933-940.
[9] Massaro, A., Galiano, A., Meuli, G., Massari, S. F. (2018) “Overview and Application of Enabling
Technologies Oriented on Energy Routing Monitoring, on Network Installation and on Predictive
Maintenance”, International Journal of Artificial Intelligence and Applications (IJAIA), Vol. 9, No.
2, pp1-20.
[10] Winters, P., Adae, I., Silipo, R. (2014) “Anomaly Detection in Predictive Maintenance Anomaly
Detection with Time Series Analysis”, KNIME white paper.
[11] Winters, P., Silipo, R. (2015) “Anomaly Detection in Predictive Maintenance Time Alignment and
Visualization”, KNIME white paper.
16International Journal of Artificial Intelligence and Applications (IJAIA), Vol.9, No.3, May 2018
[12] Kotu, V., Deshpande, B. (2015) “Predictive Analytics and Data Mining”, Elsevier book.
[13] Wimmer, H., Powell, L. M. (2015) “A Comparison of Open Source Tools for Data Science”,
Proceedings of the Conference on Information Systems Applied Research. Wilmington, North
Carolina USA.
[14] Al-Khoder, A., Harmouch, H., “Evaluating Four Of The most Popular Open Source and Free Data
Mining Tools”, International Journal of Academic Scientific Research, Vol. 3, No. 1, pp13-23.
[15] “Generic Web Service Client Node.” 2018. [Online]. Available:
https://www.knime.com/webservice-client
[16] A. Galiano, A. Massaro, D. Barbuzzi, L. Pellicani, G. Birardi, B. Boussahel, F. De Carlo, V. Calati,
G. Lofano, L. Maffei, M. Solazzo, V. Custodero, G. Frulli, E. Frulli, F. Mancini, L. D’Alessandro, F.
Crudele, (2016) “Machine to Machine (M2M) Open Data System for Business Intelligence in
Products Massive Distribution oriented on Big Data”, International Journal of Computer Science
and Information Technologies, Vol. 7, No. 3, pp. 1332-1336, 2016.
[17] Grzegorz, J., Bartosz, A., (2015) “The Use Of IT Tools For The Simulation of Economic Processes”,
Information Systems in Management, Vol. 4, No. 2, pp 87-98.
[18] Dongare A.D., Kharde, R.R., Kachare, A.D. (2012) “Introduction to Artificial Neural Network”,
International Journal of Engineering and Innovative Technology, Vol. 2, No. 1, pp189-194.
[19] El-Khamisy, N., Ahmed Shawky Morsi El-Bhrawy, M. (2016) “Artificial Neural Networks in Data
Mining”, Journal of Computer Engineering (IOSR-JCE), Vol. 18, No.6, pp. 55-59.
[20] Irfan, U., Fan, Y., Rehanullah, K., Ling, L., Haisheng, Y., Bing, G. (2017) “Predictive Maintenance
of Power Substation Equipment by Infrared Thermography Using a Machine-Learning Approach”,
Energies, Vol. 10, No. 1987, pp1-13.
[21] Braun, H. (1993) “A Direct Adaptive Method for Faster Backpropagation Learning: the RPROP
algorithm”, Proceedings of the IEEE International Conference on Neural Networks (ICNN), Vol. 16,
pp586-591.
[22] Igel, C., Toussaint, M., Weishui, W. (2005) “RProp Using the Natural Gradient. International Series
of Numerical Mathematics” Trends and Applications in Constructive Approximation. ISNM
International Series of Numerical Mathematics, Vol. 151, pp1-15.
[23] Adhikari, N. C. D. (2018) “Prevention of Heart Problem Using Artificial Intelligence”, International
Journal of Artificial Intelligence and Applications (IJAIA), Vo., 9, No. 2, pp21-35.
[24] Fouad, R. H., ukattash, A. (2010) “Statistical Process Control Tools: A Practical guide for Jordanian
Industrial Organizations”, Jordan Journal of Mechanical and Industrial Engineering, Vol. 4, No. 6,
pp693-700.
[25] Jawandhiya, P., “Hardware Design for Machine Learning”, International Journal of Artificial
Intelligence and Applications (IJAIA), Vol. 9, No. 1, pp63-84.
Corresponding Author
Alessandro Massaro: Research & Development Chief of Dyrecta Lab s.r.l.
17You can also read