Project Squirrel
  Citizen Scientist Research Guide
←
→
Page content transcription
If your browser does not render page correctly, please read the page content below
Project Squirrel Citizen Scientist Research Guide
Project Squirrel
Citizen Scientist Research Guide
Acknowledgements ........................................................................................................................................................... 3
Message to Volunteers, Instructors, and Students .................................................................................................... 4
Contact ................................................................................................................................................................................ 4
Introduction: Project Squirrel in a Nutshell ................................................................................................................ 5
Background Information................................................................................................................................................... 6
Squirrel Demographics
Squirrel Behaviors: Using Giving Up Densities (GUDs) to See the World
Through an Animal’s Eyes
Patch Use Theory
A Guide to Collecting GUDs in Your Yard ................................................................................................................ 7
Study Site
Habitat Information
Timing
Safety
Data Management
Corn GUDs*....................................................................................................................................................................... 9
Sunflower Seed GUDs.................................................................................................................................................... 11
Appendix ............................................................................................................................................................................ 13
Procedural Checklists for GUDs .................................................................................................................. 14
Habitat Information Sheet .............................................................................................................................. 15
Corn GUDs Foraging Patch Assembly Instructions ................................................................................. 17
Corn GUDs Data Collection Sheet ............................................................................................................. 19
Corn GUDs Class Data Sheet ...................................................................................................................... 21
Corn GUDs Graph Sheet ............................................................................................................................... 22
Corn GUDs Data Analysis Sheet.................................................................................................................. 23
Corn GUDs Project Squirrel Reporting Sheet .......................................................................................... 24
Sunflower Seeds GUDs Data Sheet ............................................................................................................. 26
*Classroom instructions for conducting corn GUDs available in forthcoming;
Cornell University on Behalf of Cornell Laboratory of Ornithology, ed., Birds, Butterflies, Bullfrogs, and
Beyond: Bring Biology to Life Through Citizen Science (Arlington: NSTA Press), 2013.
2
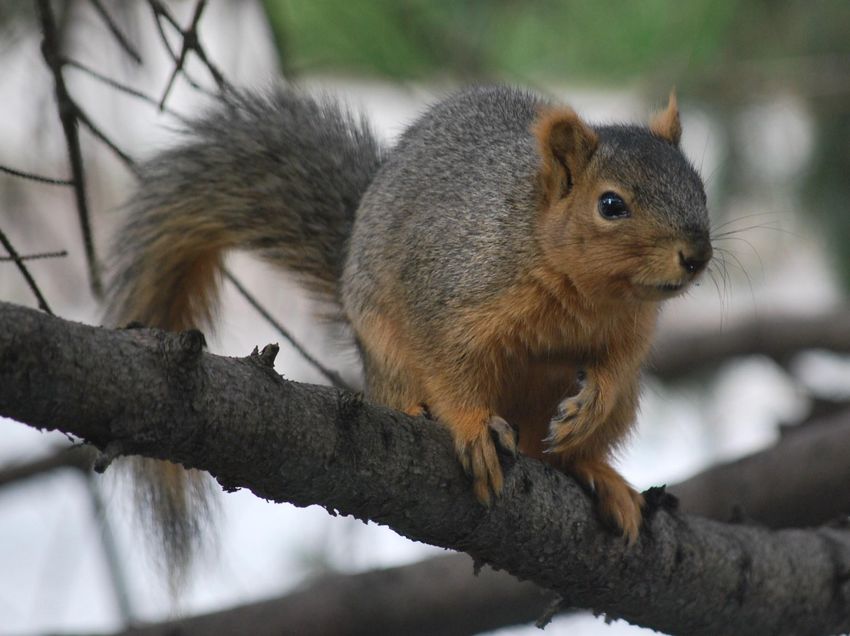
Cover photo: A Fox Squirrel, Sciurus niger, in Brookfield, Illinois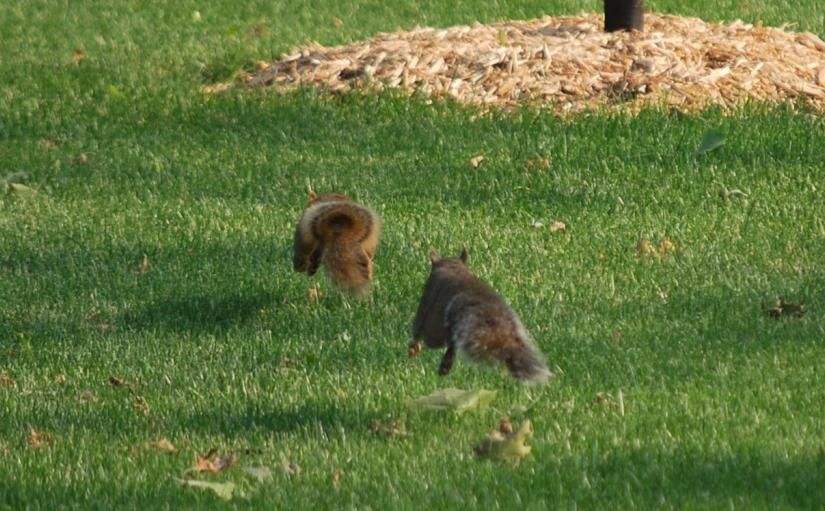
Acknowledgements
Project Squirrel was initiated by Joel Brown and Wendy Jackson in 1997, further developed by Marius
van der Merwe, and expanded by Steve Sullivan in 2009. Over this time, thousands of citizen scientists
have submitted observations and collected data that have resulted in the publication of several scientific
papers and a better understanding of squirrel ecology in North America. None of this understanding
would be possible without the regular and enthusiastic support of citizen scientists.
Project Squirrel has been supported by the University of Illinois at Chicago, the members of the Brown
Lab at UIC, the Chicago Academy of Sciences and its Peggy Notebaert Nature Museum, and all of the
citizen scientists from all ages and walks of life throughout the United States and in many other
countries who have contributed data.
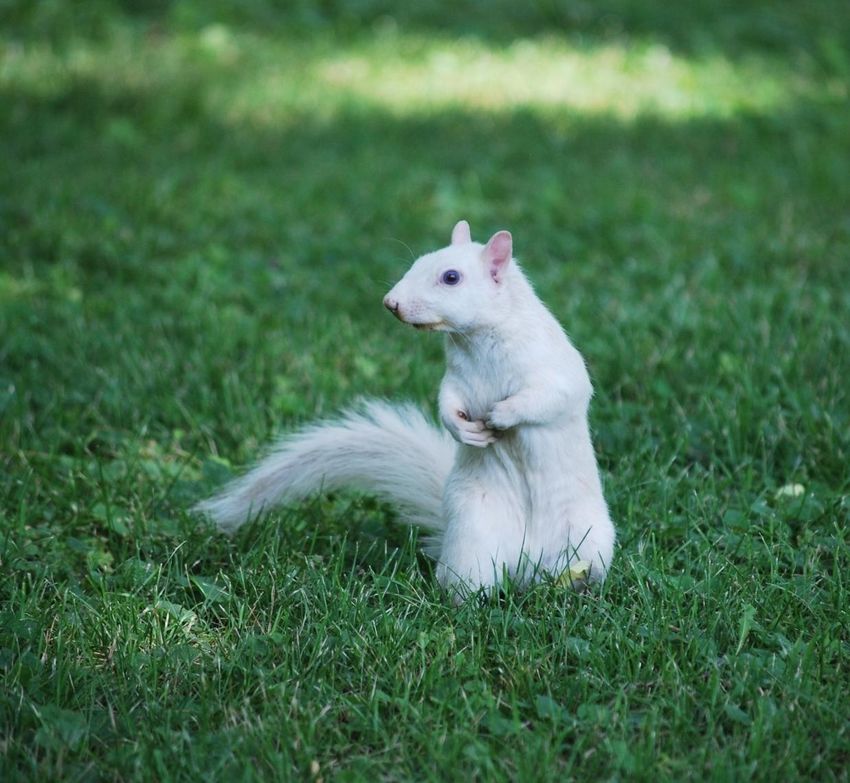
A white Grey Squirrel, Sciurus carolinensis, in Olney, Illinois
3
Message to Volunteers, Instructors, and Students
Thank you for your interest in Project Squirrel. As you read through this guide, I hope you will find that
studying squirrels presents a range of fun and educational opportunities. Project Squirrel activities can
involve people of all ages and add a scientific purpose to backyard wildlife observation. School teachers
will find that Project Squirrel can be used as a tool to teach real-life application of math and science skills
and as a foundation for a range of reading, writing, math, and geography exercises. University
instructors are invited to incorporate Project Squirrel into ecology labs and field techniques courses.
Participation in this project will help you understand your neighborhood squirrels and general ecology
more clearly, and when you contribute the data you collect, we will be able to illuminate regional
patterns of biodiversity, demographics, and ecology. If you already love squirrels, this understanding is
likely to help you enjoy squirrels even more. If you hate squirrels, this understanding should help you
mitigate the problems squirrels can cause. Love them or hate them, squirrels are excellent organisms
for documenting urban ecology, and it is my hope that this guide will encourage citizen scientists
everywhere to develop their skills in observing and enjoying the ecology of their neighborhoods while
contributing to a focused, long-term data set that is illuminating the relationships between humans and
our urban environments.
I look forward to seeing your data sets over the coming seasons. Happy Squirreling!

Yours,
Steve Sullivan
Project Squirrel, Principal Investigator

Contact
ProjectSquirrel.org has everything you need to be a scientific squirrel watcher: links to data sheets,
pictures, frequently asked questions, and more. You can efficiently report your squirrel data through
ProjectSquirrel.org, and we hope you’ll encourage your friends to go there and participate, too.
For additional questions, including support for GUD collectors, contact sciurus@uic.edu.

                                                                                                             4
Introduction: Project Squirrel in a Nutshell
Project Squirrel is a long-term study that partners with citizen scientists to collect broad-scale, fine-
resolution data about squirrel population density, diversity, and behavioral characteristics. These data
can then be interpreted by researchers (and citizen scientists) who wish to learn more about local and
regional ecology. Said another way, Project Squirrel is a way to see the world through squirrels’ eyes--
and the more people submitting data, the better our understanding.
Squirrels are ideal candidates for understanding ecology on both local and regional scales for a wide
variety of reasons. Squirrels can be found in most American cities, and the different species of squirrels
are easily identifiable. Also, squirrels are diurnal (active during the day) and active year round, making
them easy for people to observe. Squirrel survival and behavior can provide information about other
wildlife in an area as well; resources that are key to squirrel survival are also important to a wide range
of other animals, and, similarly, predators that impact squirrels often impact many other species as well.
Fundamental squirrel ecology is well understood, so it is possible to make and test hypotheses based on
a solid foundation of previous research. Finally, most people have an opinion about squirrels—love
them or hate them, people notice squirrels.
Because squirrels are easy to identify and observe, citizen scientists can contribute meaningful data to
the project without extensive training. Scientists can then use the data to make generalizable
conclusions about the local and regional ecosystems. It is hoped that citizen scientists’ participation in
the project and the conclusions drawn
from the squirrel data will encourage
better stewardship of neighborhood
natural resources for the benefit of all
biodiversity, decrease the tension between
humans and neighborhood wildlife, and
help people enjoy and appreciate the
outdoors in an increasingly urbanized
world.
A grey squirrel, Sciuris carolinensis, (note the white-
frosted tail) in pursuit of a fox squirrel, Sciuris niger,
(note the rufous coloration).
5Background Information
Squirrel Demographics
Ecology includes the relationships and interactions of the biotic (living) and abiotic (non-living) parts of
an ecosystem, and there are several kinds of data about squirrels that can contribute to a better
understanding of the ecology of an ecosystem. A citizen scientist might collect data about squirrel
demographics (e.g., the number of squirrels in a given area, the ratio of fox to grey squirrels, how the
density and diversity of squirrel species change over the seasons and years) or squirrel behaviors (e.g.,
how a squirrel feeds or avoids predators).
Collecting squirrel demographic data is simple - just note how many individuals and what species of
squirrel you see, and report your observations at ProjectSquirrel.org. Don’t see any squirrels? That’s a
data point too, because the persistent absence of squirrels can tell a lot about the ecology of a region.
You can report about squirrels as often as you like in as many places as you like. It is best that you
report about a given location at least once a season because it is likely that the squirrel populations will
change from one season to the next. Encourage your friends and neighbors to contribute data, too.
The more observations we have, the more complete our understanding will be. Reporting your
observations to ProjectSquirrel.org is simple, yet the data from your reports and those of thousands of
other people form the foundation for significant research.
Squirrel Behaviors: Using Giving Up Densities (GUDs) to See the World Through
an Animal’s Eyes
Imagine a scientist puts a bowl of your favorite candy on a table near your bedroom door. How much
might you eat? If the bowl is moved near your neighbor’s bedroom, or in the middle of the street, how
much might you eat? The amount of food left in the bowl when you are done foraging in it is called the
Giving Up Density (GUD). When the foraging patch (bowl o f candy) is near your bedroom, where you
feel comfortable, your GUD is likely to be low—there will be few pieces of candy left. However, near
your neighbor’s bedroom or in the middle of the street (where there are territorial conflicts or other
dangers), your GUD will be high—many pieces of candy will remain in the bowl.
Scientists use Giving Up Densities to learn more about how animals interact with their surroundings.
GUDs can provide clues about the costs and benefits of obtaining food from certain foraging patches,
and this information contributes to an understanding of the relationships between biotic and abiotic
parts of ecosystems.
Patch Use Theory
Patch use theory recognizes that animals live in heterogeneous environments and that resources occur
in patches. Shelter, water, and food may be located in different places. Food resources are depleted as
they are utilized, making foraging progressively less productive. Patch use theory predicts that a foraging
animal will stop using a patch when the costs of foraging are greater than the benefits. Costs may
include metabolic, predation, and missed opportunity costs (e.g., the inability to watch for predators
while handling food, the difficulty of separating food from a substrate like husks or soil). The relative
costs and benefits may change with factors like the health and reproductive status of an individual. For
example, a starving individual is likely to take more risks for food than one that has recently fed.
The benefits and costs of feeding perceived by an animal can be evaluated by measuring Giving Up
Densities in experimental foraging patches. A GUD will be lower (less food will be left behind) when an
animal thinks that foraging is more beneficial than other activities.
Scientists at Project Squirrel are using GUDs to learn about squirrel behavior and are interested in
working with citizen scientists to collect additional data. This guide includes instructions for two
possible experimental setups for collecting GUDs, corn GUDS and sunflower seed GUDs.
6A Guide to Collecting GUDs in Your Yard
Study Site
Observe the features of certain areas in the yard and determine where you think squirrels might feel
threatened. Is there an area close to traffic, pets, or other hazards? Is there a secluded area that seems
protected from such dangers? Choose two study sites, one that you characterize as a ―safe‖ site and one
that you characterize as an ―unsafe‖ site. Each site must have a tree that is at least 15 cm in diameter at
breast height (dbh). You will place two foraging patches at each site, one at the base of the tree and
one 4m from the base of the tree.
>4m
4m >4m
>4m
4m
Habitat Information
Use a Habitat Information Sheet to record site-specific and abiotic data. These data allow scientists to
make more accurate and detailed comparisons between data collection sites.
Timing
Put your foraging patches out in the morning and collect them in the evening. Because nocturnal wildlife
might also be interested in the food provided at the foraging patches, do not leave the patches out at
night. Data should be collected from the foraging patches for a minimum of four consecutive days. As
much as possible, data collection should be conducted on days with similar weather forecasts.
7Safety
Collecting GUDs is one of the safest ways to gather data on an animal because there is no need for the
observer and the animal to come into direct contact. Because of the short duration of the project,
there shouldn’t be any long-term impacts on the foraging patterns of neighborhood wildlife.
Squirrels do not carry rabies, but it is never a good idea to approach a wild animal, no matter how cute,
friendly, or needy it may seem. Whether or not they are rabid, most animals will defend themselves if
they feel threatened. Squirrels seem friendly, but they may react to a given situation differently than you
might expect. In addition to their amazingly sharp teeth and powerful jaw muscles, squirrels have razor-
sharp claws that can easily break skin. You should especially avoid animals that are behaving strangely.
Squirrels are likely to carry fleas and may carry other parasites. For the most part you can prevent
exposure to these organisms by doing what you normally do—avoid coming into contact with wild
animals and their feces.
Breathing silica sand dust or dust from dried feces can be hazardous to your health.
Wash your hands thoroughly after working with the patches.
Feel free to contact the Project Squirrel Team with questions, concerns, and observations at any time at
sciurus@uic.edu.
Data Management
Science is based on the ability to draw conclusions that allow us to make generalizable theories. All of
the activities outlined in this manual are for one end: to collect useful data. To be useful, data must be
collected systematically under the most standardized conditions possible and recorded accurately. Please be
very careful while collecting, recording, storing, and transmitting data. Double check to ensure
accuracy, especially when submitting data electronically on the Project Squirrel website.
8Corn GUDs
Four foraging patches are compared: Safe Site Near Tree, Safe Site 4m from Tree, Unsafe Site Near
Tree, and Unsafe Site 4m from Tree. Each foraging patch contains an ear of corn as a food resource on
each day of data collection. Each evening, the amount of corn left behind in each patch is measured, and
the patches are reset for another round of data collection.
The animals must spend time consuming the corn, which reduces their ability to watch for predators. If
they think the area is risky, they won’t spend as much time consuming corn, and the GUD will be high –
many kernels will be left. On the other hand, if the squirrels feel safe, they will spend more time
consuming and the GUD will be low – few kernels will be left.
Corn as a Food Source for Squirrels
A corn kernel has two main parts, the endosperm (the starchy outside) and the embryo (the oily inside).
When a corn kernel germinates in the soil, the embryo grows into a corn plant, and the endosperm
feeds the plant until it forms leaves and begins to photosynthesize.
Because the oily embryo has more nutrients, it is preferred by squirrels over the endosperm. Squirrels
often eat only the embryo from the middle of a corn kernel, leaving the endosperm behind. In this study,
when a squirrel leaves an endosperm behind, it is referred to as a kernel with an excised (removed)
embryo. Much in the same way that candy wrappers could be used to determine how much candy a
person ate, kernels with excised (removed) embryos can be used to measure how much a squirrel ate.
Sometimes, squirrels will eat very quickly and leave a pile of broken corn kernel scraps behind instead of
leaving a kernel with the embryo neatly cut out. Removing embryos is a common behavior in squirrels;
grey squirrels regularly excise embryos from white oak acorns to prevent germination.
In this study, data are collected about the amount of corn consumed by squirrels and the scraps left
behind by squirrels. If squirrels do not forage from the patches, this is also important data and should be
reported. Since all data are useful data, please report the amount eaten by squirrels, even if it is 0 grams.
Study Site
This method uses an ear of dried corn which is affixed to a feeder in a way that gives squirrels access
but minimizes feeding by other species. The feeder is placed so that the waste generated by feeding can
be easily collected.
Bait the Patches
Pre-bait the site to alert squirrels to a potentially good place to forage by simply scattering some dried
corn, sunflower seeds, or some other palatable food for three days before beginning the GUD study.
9Materials
Each study will have a set of the following:
4 cardboard or wood foraging patches (see Corn GUDs Foraging Patch Assembly Instructions)
16 ears of dried feed corn (4 per day for 4 days)
300g capacity balance
Data sheets
o 2 Habitat Information Sheets
o 16 Corn GUDs Data Collection Sheets (at least one per foraging patch location (4) per
day (4))
o (optional) Corn GUDs Data Analysis Sheet
o (optional) Corn GUDs Graph Sheet
o (optional) Corn GUDs Class Data Sheet (used to compile data from all 16 Corn Data
Collection Sheets)
o (optional) Corn GUDs Project Squirrel Reporting Sheet
Collect the GUDs
GUDs will be collected in each of the four foraging patch locations (Safe Site Near Tree; Safe Site 4m
from Tree; Unsafe Site Near Tree; Unsafe Site 4m from Tree) over four days. See ―A Guide to
Collecting GUDs in Your Yard‖ for information on selecting sites.
Put the four wood or cardboard foraging patches outside (one in each location) each day for at least six
hours. During each day, observe each foraging patch location for a few minutes, and on the Corn Data
Collection Sheet for each location, record the species and number of squirrels that were present.
Collect all of the corn from each foraging patch at the end of each day, and bring the patches inside.
Separate the corn from each patch into piles of ―whole corn left behind by squirrels,‖ ―kernels with
excised embryos,‖ and ―small pieces of kernels not on the cob.‖
Each evening at about the same time, use the data sheet to record:
Total mass of corn kernel scraps left behind on the foraging patch
Mass of kernels with excised embryos
Mass of small pieces of kernels not on the cob
Total mass of corn that was consumed by squirrels
Mass of all whole corn kernels left behind by squirrels
Total mass of the cob with all of the kernels removed
Put the foraging patches back out the next morning, and repeat the procedure for all four days of data
collection. Enter the data into the online form at ProjectSquirrel.org. If desired, use the Data Analysis
Sheet and Graph Sheet to draw conclusions about how much corn the squirrels were interested in
eating at each foraging location and the Class Data Sheet and Project Squirrel Reporting Sheet to
compile and organize data before reporting to ProjectSquirrel.org.
10Sunflower Seed GUDs
Four foraging patches are compared: Safe Site Near Tree, Safe Site 4m from Tree, Unsafe Site Near
Tree, and Unsafe Site 4m from Tree. Each foraging patch contains a substrate (sand) mixed with a
measured food resource (sunflower seeds). Each evening, the amount of food left behind in each patch is
measured, and the patches are reset for another round of data collection.
Squirrels love sunflower seeds because they are high in energy and low in toxic compounds. Because
this experiment uses seeds that are not in the shell, squirrels won’t try to cache the seeds. The animals
must spend time searching for the sunflower seeds in a bin of sand, which reduces their ability to watch
for predators. If they think the area is risky, they won’t spend as much time looking for seeds, and the
GUD will be high – many seeds will be left. On the other hand, if the squirrels feel safe, they will spend
more time looking for seeds and the GUD will be low – few seeds will be left.
Materials
Four foraging bins with lids, each large enough to hold four liters of sand
Five 4-liter bags of screened sand
Sand scoop
20 envelopes, each containing 12 grams of whole, shell-less sunflower seeds
Handful of extra sunflower seeds (for pre-baiting)
One sieve assembly (screen and base) for separating seeds from sand
Data Collection Sheet
Foraging Patch Preparation
Select four foraging patches: Safe Site Near Tree, Safe Site 4m from Tree, Unsafe Site Near Tree, and
Unsafe Site 4m from Tree. See ―A Guide to Collecting GUDs in Your Yard‖ for information on
selecting sites.
Pre-Baiting: Fill each of the four foraging bins with four liters of sand. Put a pinch of seed on top of the
sand in each bin. Do not mix the seeds into the sand. Place the foraging bins out in the four selected
locations. This will alert squirrels to a potential place to forage, which could make the squirrels more
likely to forage at the patches on data collection days.
Bait the Patches
Prepare the patches. Stir the sand and the measured sunflower seeds together (this should be
all of the seeds in the envelope). Shake the bin to smooth the surface of the sand. The seeds
should be distributed evenly in the substrate, though some may be visible on the surface.
There should not be any broken seeds in the envelope, but if there are, please remove them and
replace them with an equivalent amount of unbroken seeds from the pre-baiting seeds.
Keep the trays covered until it is time to forage.
Open the squirrel trays in the morning.
Collect the GUDs
This is where you start to see results. Did an animal find the patches? How much food did they leave
behind? Do any patterns seem to be emerging? You will see amazing results from your yard, and later,
your results will be combined with others to create a larger picture.
In the evening, close the squirrel patches.
Use the sieve assembly to screen the contents of the patch and count the remaining food.
11Record the GUD—the number of unconsumed sunflower seeds—along with any observations
you make on the data sheet. If you find seeds that are in pieces of about ½ or more, record
them as ½. Seeds that are less than about ½ should be recorded as 0.
Cover the patches to prevent raccoons, cats, or other nocturnal animals from disturbing them
and re-bait them in the morning for the next period of foraging.
Be sure to keep the sand dry.
12Citizen Scientist Research Guide
Appendix
Contents
Procedural Checklists for GUDs ................................................................................................................................. 14
Habitat Information Sheet ............................................................................................................................................. 15
Corn GUDs Foraging Patch Assembly Instructions ................................................................................................ 17
Corn GUDs Data Collection Sheet ............................................................................................................................ 19
Corn GUDs Class Data Sheet ..................................................................................................................................... 21
Corn GUDs Graph Sheet .............................................................................................................................................. 22
Corn GUDs Data Analysis Sheet................................................................................................................................. 23
Corn GUDs Project Squirrel Reporting Sheet ......................................................................................................... 24
Sunflower Seeds GUDs Data Collection Sheet........................................................................................................ 26
13Procedural Checklists for GUDs
Procedural Checklist for Corn GUD Collection
___Site Selection: Choose four foraging patch locations using ―A Guide to Collecting GUDs in Your
Yard‖ (pg. 7)
___Prepare: Build foraging patches.
___Bait: In the morning, place one ear of corn at each foraging patch.
___Allow foraging: Open the station between 6 and 9 a.m.
___Collect GUDs: Between 4 and 8 p.m., collect the remaining corn from each foraging patch.
___Record data: Record how much corn was consumed and whether the kernels are whole or have
excised embryos.
___Repeat data collection, refilling the foraging patches each day.
___Report your data using the link at ProjectSquirrel.org.
Procedural Checklist for Sunflower Seed GUD Collection
___Site Selection: Choose four foraging patch locations using ―A Guide to Collecting GUDs in Your
Yard‖ (pg. 7)
___Prepare: Fill each foraging bin with four liters of sand.
___Bait: Mix one envelope of seed (12 grams) into the sand.
___Allow foraging: Open the station between 6 and 9 a.m.
___Collect GUDs: Between 4 and 8 p.m., sieve the foraging patch and count the remaining seeds.
___Record data: Record the number of seeds, other data, and observations on your datasheet.
___Cover the foraging patch.
___Repeat data collection, refilling the foraging patches each day.
___Report your data at ProjectSquirrel.org.
14Habitat Information Sheet
Investigator Names:
Hypothesized Habitat Type (“Site”): (circle one) Safe Unsafe
Approximate diameter of tree at breast height (DBH): _________________cm DBH
To calculate the diameter at breast height:
Use a flexible measuring tape (or a piece of string that you later measure) to find the
circumference of the tree (in cm) at approximately chest height, which will vary slightly
depending on the height of the person making the measurements.
Divide the circumference by π (approximately 3.14).
Kinds of trees within 20m of site:
Nut bearing (trees like walnut, oak, or hickory)
Seed bearing (trees like maple, elm, or locust)
Fruit bearing (trees like crabapple, gingko, or hawthorn)
Cone bearing (trees like pine, fir, or spruce)
Tiny seed bearing (trees like cottonwood, willow, or ash)
Check off any of the following that are within 10m of the site:
Building
Fence
Garbage cans or recycling bins
Other trees
Bird feeders
Note: If any of the features listed above are within 4m of the site, please select a new location.
15If the following are present, indicate how busy you think they are during the day:
Not Usually Sometime Regularly Very Busy
Present Quiet s Busy Busy
Street
Alley
Sidewalk
Playground
Sports Field
Note: If any of the features listed above are within 4m of the site, please select a new location.
How many of the following do you think are within one block of the schoolyard in one day?
Cats None 1-2 3-4 5+
Dogs
Hawks
Coyotes
How often do you see squirrels obtaining food from the following sources near your
school?
Never Seldom Often Always
Bird feeders
Human Handouts
Garbage
Trees and other plants
What other animals do you see in your school yard?
16Corn GUDs Foraging Patch Assembly Instructions
Materials per patch:
-cardboard square, 60 cm x 60 cm -utility knife or box cutter
-ruler -duct tape
-pencil -10 cm wire
-1 coarse-thread screw eye, 1‖ or longer -1 coarse-thread screw eye, 6‖ or longer
1. With a pencil, mark a 3 cm x 3 cm square on each corner of the 60 cm x 60 cm piece of
cardboard.
2. Carefully use a utility knife to remove the 3 cm x 3 cm squares. This should leave a 3 cm
wide strip on each side of the large cardboard square.
3. Fold the 3 cm wide strips vertically, and secure the corners with duct tape. The assembled
foraging patch should have a 3 cm tall lip on all four sides.
4. Mark the center of the assembled foraging patch with a pencil.
17To set up the foraging patches in the schoolyard:
1. Since these patches are made out of cardboard, they will not work well on a rainy day. If it
begins to rain after you have set patches up outside, bring them in to salvage the materials,
or assemble new cardboard patches and start the setup over for a day of new data. If you
make a patch out of wood, you can use it in any weather.
2. Twist a 1‖ screw eye into the bottom of each ear of corn. (This step should be completed
after the initial mass of the corn has been recorded by students.)
3. Attach a 10cm piece of wire to the eye of the screw eye.
4. Take the assembled cardboard patch to the desired location. Twist a 6‖ screw eye through
the middle of the cardboard patch to anchor the patch to the ground.
5. Attach the loose end of the 10cm piece of wire to the eye of the 6‖ screw eye to anchor
the ear of corn to the center of the cardboard patch.
6. If desired, stake or weigh down the corners of the cardboard patch.
To collect foraging patches from the schoolyard at the end of the data collection
period (at least 6 hours after the patch is placed in the schoolyard):
1. Unscrew the 1‖ screw eye from the bottom of the corn cob. Place the cob (with any
remaining kernels) in a resealable bag labeled with the foraging patch location.
2. Unscrew the 6‖ screw eye from the ground.
3. Tilt the cardboard foraging patch slightly and pour all remaining corn fragments into the
resealable bag.
4. Bring the foraging patch inside for the night.
18Corn GUDs Data Collection Sheet
Investigator Names:
Hypothesized Habitat Type: (circle one) Safe Unsafe
Foraging Patch Location: (circle one)
Near Tree 4m from Tree
Date: ________________________________________ Day # _____ of data collection
Time patch opened: ___________ a.m./p.m. Time patch closed: ___________ a.m./p.m.
Squirrel species observed in the schoolyard today:
Grey Squirrel Sciurus carolinensis Number_________________
Fox Squirrel Sciurus niger Number_________________
Other ____________________ Number_________________
Mass of corn cob (before foraging): ____________g
Has feeding occurred today? (circle one) Yes / No
------------------------------------------------------------------------------------------------------------------------
If yes, use the corn cob and all corn kernels (whole or in pieces) collected from the cardboard foraging
patch to continue:
1. Set the corn cob to the side. Do not remove any kernels from the cob at this time.
2. Split the remaining corn into three piles:
whole kernels kernels with excised embryos small pieces of kernels
3. Kernels with excised embryos and small pieces of kernels are the scraps of kernels that were
nibbled on by squirrels. Find the masses of these two piles, and use them to calculate the total mass
of corn kernel scraps left behind on the foraging patch:
Total mass of corn
Mass of kernels with excised
kernel scraps left behind
embryos (not on the cob): Mass of small pieces of kernels on foraging patch:
(not on the cob):
g + g = g
194. The squirrels may also have left behind kernels that are still whole, either attached to the cob or
loose on the foraging patch. Remove the whole kernels from the cob and combine them with the
pile of whole kernels that were loose on the foraging patch (already set aside during step 2).
5. Find the mass of this new pile that is made up of all of the whole corn kernels left behind by
squirrels, either loose on the foraging patch or removed from the cob by you.
Total mass of all whole corn
kernels left behind by
squirrels
g
6. Find the mass of the cob (with all kernels removed): ___________g
Use the data collected to determine the mass of all corn that was consumed by squirrels:
Mass of corn consumed by squirrels: ___________g
20Corn GUDs Class Data Sheet
Location: safe; near tree Location: safe; 4 m from tree
Total corn consumed: Total corn kernel scraps: Total corn consumed: Total corn kernel scraps:
Day 1: g Day 1: g Day 1: g Day 1: g
Day 2: g Day 2: g Day 2: g Day 2: g
Day 3: g Day 3: g Day 3: g Day 3: g
Day 4: g Day 4: g Day 4: g Day 4: g
Average: g Average: g Average: g Average: g
Location: unsafe; near tree Location: unsafe; 4 m from tree
Total corn consumed: Total corn kernel scraps: Total corn consumed: Total corn kernel scraps:
Day 1: g Day 1: g Day 1: g Day 1: g
Day 2: g Day 2: g Day 2: g Day 2: g
Day 3: g Day 3: g Day 3: g Day 3: g
Day 4: g Day 4: g Day 4: g Day 4: g
Average: g Average: g Average: g Average: g
21Corn GUDs Graph Sheet
Corn Kernel Scraps Left Behind by Corn Consumed by Squirrels
Squirrels
NEAR FAR NEAR FAR NEAR FAR NEAR FAR
SAFE UNSAFE SAFE UNSAFE
Using the data from the Class Data Sheet, create a bar graph showing the average amounts of corn scraps left behind by squirrels and a bar
graph showing the average amounts of corn consumed by squirrels from each of the four foraging patches. Be sure to label the y axis for each
graph. 22Corn GUDs Data Analysis Sheet Name: _______________________
1. Use the graphs you created to compare squirrel feeding behavior in the safe
location and the unsafe location.
In which location was more corn consumed? In which location did the squirrels leave
behind more scraps? Explain.
2. Use the graphs you created to compare squirrel feeding behavior near a tree and
4m from a tree.
In each location (safe; unsafe), where was more corn consumed, near the tree or 4m
from the tree? What differences do you notice in the amount of scraps the squirrels left
behind near the tree and 4m from the tree?
3. Based on the data collected, are your hypotheses about the relative safety of each
location supported or refuted? Explain.
4. Are there any interesting data that were surprising? Explain.
How do the ―corn consumed‖ data compare to the ―corn kernel scraps‖ data? Do the graphs
look similar?
23Corn GUDs Project Squirrel Reporting Sheet
Day 1 Day 2 Day 3 Day 4
Safe Location SAFE SAFE SAFE SAFE SAFE SAFE SAFE SAFE
4m from 4m from 4m from 4m from
Near Tree Near Tree Near Tree Near Tree
Tree Tree Tree Tree
Date:
Time patch opened: a.m. a.m. a.m. a.m. a.m. a.m. a.m. a.m.
p.m. p.m. p.m. p.m. p.m. p.m. p.m. p.m.
Time patch closed: a.m. a.m. a.m. a.m. a.m. a.m. a.m. a.m.
p.m. p.m. p.m. p.m. p.m. p.m. p.m. p.m.
For the following three rows, please provide an estimate of the number of squirrels in the schoolyard each day, based on the most common number of each
species seen and recorded during students’ observations. These three rows will not appear in the Data Reporting Sheet for the unsafe location, as the
numbers you record here are an estimate of the number of squirrels seen by students from any one location in the schoolyard.
# of gray squirrels
observed:
# of fox squirrels
observed:
# of other squirrels
observed (note
species):
Did feeding occur?
Yes or No Yes or No Yes or No Yes or No Yes or No Yes or No Yes or No Yes or No
Initial mass of cob
g g g g g g g g
(before foraging):
Mass of kernels with
g g g g g g g g
excised embryos:
Mass of small pieces of
g g g g g g g g
kernels:
Total mass of whole
kernels left behind g g g g g g g g
(loose or on cob):
Use students’ completed Data Collection Sheets to compile information from each group before submitting 24
the data to Project Squirrel.Corn GUDs Project Squirrel Reporting Sheet
Day 1 Day 2 Day 3 Day 4
UNSAFE UNSAFE UNSAFE UNSAFE UNSAFE UNSAFE UNSAFE UNSAFE
4m from 4m from 4m from 4m from
Near Tree Near Tree Near Tree Near Tree
Tree Tree Tree Tree
Date:
Time patch opened: a.m. a.m. a.m. a.m. a.m. a.m. a.m. a.m.
p.m. p.m. p.m. p.m. p.m. p.m. p.m. p.m.
Time patch closed: a.m. a.m. a.m. a.m. a.m. a.m. a.m. a.m.
p.m. p.m. p.m. p.m. p.m. p.m. p.m. p.m.
Did feeding occur?
Yes or No Yes or No Yes or No Yes or No Yes or No Yes or No Yes or No Yes or No
Initial mass of cob
g g g g g g g g
(before foraging):
Mass of kernels with
g g g g g g g g
excised embryos:
Mass of small pieces of
g g g g g g g g
kernels:
Total mass of all whole
kernels left behind g g g g g g g g
(loose or on cob):
Use students’ completed Data Collection Sheets to compile information from each group before submitting the
data to Project Squirrel.
25Sunflower Seeds GUDs Data Collection Sheet
Investigator Name:
Site location name (if working multiple sites):
Hypothesized Habitat Type: (circle one) Safe Unsafe
Foraging Patch Location: (circle one)
Near Tree 4m from Tree
Date: ________________________________________ Day # _____ of data collection
Time patch opened: ___________ a.m./p.m. Time patch closed: ___________ a.m./p.m.
Squirrel species observed in the schoolyard today:
Grey Squirrel Sciurus carolinensis Number_________________
Fox Squirrel Sciurus niger Number_________________
Other ____________________ Number_________________
Mass of sunflower seeds BEFORE foraging: ____________g
Mass of sunflower seeds AFTER foraging: ____________g
Has feeding occurred today? (circle one) Yes / No
26You can also read