Determining Bullying Text Classification Using Naive Bayes Classification on Social Media
←
→
Page content transcription
If your browser does not render page correctly, please read the page content below
Jurnal Varian https://journal.universitasbumigora.ac.id/index.php/Varian e-ISSN 2581-2017 Vol.4, No.2, April 2021, Hal.133-140 Determining Bullying Text Classification Using Naive Bayes Classification on Social Media Ade Clinton Sitepu1, Wanayumini2, Zakarias Situmorang3 1Computer Science Department, Universitas Potensi Utama Medan, Indonesia, email: adeclintonsitepu@gmail.com 2 Computer Science Department, Universitas Potensi Utama Medan, Indonesia, email: wanayumini@gmail.com 3Information Technology Department, Universitas Katolik Santo Thomas Medan, Indonesia, email: zakarias65@ust.ac.id ABSTRACT Article history: Cyber-bullying includes repeated acts with the aim of scaring, angering, or embarrassing Received : 22-02-2021 those who are targeted Cyber-bullying is happening along with the rapid development of Reviced : 31-03-2021 technology and social media in society. The media and users need to filter out bully comments Accepted : 01-04-2021 because they can indirectly affect the mental psychology that reads them especially directly aimed at that person. By utilizing information mining, the system is expected to be able to Keyword: classify information circulating in the community. One of the classification techniques that Text Mining; can be applied to text-based classification is Naïve Bayes. The algorithm is good at performing Sentiment Analysis; the classification process. In this research, the precision of the algorithm's has been carried Naïve Bayes Algorithm; out on 1000 comment datasets. The data is grouped manually first into the labels "bully" and Confussion Matrix; "not bully" then the data is divided into training data and test data. To test the system's Phyton Programming ability, the classified data is analyzed using the confusion matrix method. The results showed that the Naïve Bayes Algorithm got the level of precision at 87%. and the level of area under the curve (AUC) at 88%. In terms of speed of completing the system, the Naïve Bayes Algorithm has a very good rate of speed with completion time of 0.033 seconds. This is an open access article under the CC BY-SA license. DOI: https://doi.org/10.30812/varian.v4i2.1086 ———————————————————— A. INTRODUCTION One area of information technology that has experienced rapid development in the last few decades is social media information technology. The emergence of the term millennial is a term for a generation of people who are fluent in using social media and the latest technology in their daily activities. Even in every aspect of the work carried out, it is inseparable from the use of social media and technology. However, the recent problem that has occurred is that the freedom to use social media is not matched by strict monitoring, which has led to things that have led to criminal acts on social media. One of the criminal on social media is Cyber-bullying. What is meant by Cyber-bullying is in the form of hurting or humiliating other people using social media facilities. Cyber-bullying can cause depression in people who receive this treatment, some of which have even led to a more extreme impact, namely suicide (El Asam & Samara, 2016). In a news source detiknews.com, in 2017 the government stated that 84% of adolescents aged 12 to 17 years in Indonesia were victims of acts of bullying and most cases of bullying that were found were Cyber-bullying (Laksana, 2017). Cyber-bullying is included in the act of abuse on social media which is regulated in the "Electronic Information and Transactions Law (UU ITE) which states about defamation or insult" (Sanda, 2016). To be able to classify information is bullying or not, it is not done manually like before. A faster method to use is to 133
134 |Jurnal Varian| Vol.4, No.2, April 2021, Hal.133-140

use assistive technology. To realize classification techniques using technological media, research and
manufacture of corpus in human language is needed because basically the language programmed on a
computer is very different from the language understood by the system.
 The topic in this research is how to identify texts or comments on social networks. The process of
identifying text in a database is called text mining (Sari & Stevenson, 2016). Text mining is a sub-part of a
larger and more complex data processing process, namely data mining. Text mining aims to obtain useful
information and knowledge from very large data sets. Challenges in text mining are complex and incomplete
text structures, unclear and non-standard meanings, and different languages plus inaccurate translations
(Sussolaikah & Alwi, 2016). For each data mining function, appropriate algorithms and methods are needed
for processing the input into the desired output. On this basis, there are many data mining algorithms for
each function. For example, the classification function algorithm consists of Statistical-Based Algorithms,
Distance-Based Algorithms, Decision Tree-Based Algorithms, Neural Network-Based Algorithms, and Rule-
Based Algorithms (Norwawi, 2020).
 According to Wu, et al. (2009), there are a number of data mining function algorithms that have been
selected as the Top 10 data mining algorithms (Wu & Kumar, 2009). The result, it is found that the
classification algorithm is the majority in the Top 10 algorithms . The best classification algorithms in the
Top 10 data mining algorithms are the C4.5 decision tree, k-Nearest Neighboor (k-NN), Naive Bayes, and
Classification and Regression Trees (CART) (Wu & Kumar, 2009). In previous research, a comparative
analysis of the performance of the Naive Bayes algorithm and the Decision Tree algorithm has been carried
out on numerical data classification. Performance measurement is based on the amount of data and the
number of attributes. As a result, The level of accuracy of the decision tree model is better than the Naïve
Bayes model. However, in terms of time, the naïve Bayes process is faster than the decision tree process. It
would have a significant impact if the data larger (Sitepu et al., 2020).
 Based on this background, this study tries to determine the results of text classification using the Naive
Bayes algorithm which is part of the Top 10 data mining algorithms. The dataset is a collection of data from
comments on the Twitter social network, especially during the 2019 Election, where there were many
bullying comments from haters of each candidate. Accuracy measurements produce confusion matrix for
precision, recall, and F-measure assessments. The research objective is to find the success rate of the Naive
Bayes algorithm in classifying cyber-bullying comment on social networks. The research results are
expected to be a reference for readers in understanding the Naïve Bayes algorithm and developing a system
that is able to directly identify comments.

B. LITERATURE REVIEW
1. Cyber-bullying
 Cyber-bullying is bullying using digital technology as a medium. Cyber-bullying usually occurs on social
networks, chat platforms, gaming platforms and smartphones. Cyber-bullying includes repeated acts with
the aim of scaring, angering, or embarrassing those who are targeted (Livingstone et al., 2020). In-person or
face-to-face bullying and Cyber-bullying can often occur simultaneously. However, Cyber-bullying leaves a
digital trail in the form of a record or log that can be useful and provide evidence when it helps stop this
misbehavior.
 The effects of Cyber-bullying can be long-lasting and affect a person in many ways, including (Urano et
al., 2020):
a. Mentally: feeling annoyed, embarrassed, stupid, even angry.
b. Emotionally: feelings of shame or loss of interest in things that are liked.
c. Physically: feeling tired from lack of rest or experiencing symptoms such as abdominal pain and
 headaches
Ade Clinton Sitepu, Determining Bullying Text...135

 Cyber-bullying can make someone unwilling to talk about or resolve the problem. In extreme cases,
Cyber-bullying can even lead to someone taking their own life. Cyber-bullying is included in the act of abuse
regarding social media as regulated in the "Electronic Information and Transaction Law (UU ITE).

2. Text Mining
 Data Mining is the discovery of new information by looking for certain patterns or rules from a very
large amount of data (Hendayanti et al., 2018). Text mining is the application of data mining concepts and
techniques to look for patterns in text, the process of analyzing text to find useful information for specific
purposes (Septian et al., 2017). Text mining is a technique used to deal with classification problems,
sentiment analysis, text clustering, information extraction and information retrieval (Sari & Stevenson,
2016).
 Text mining has something in common with data mining. Both have the same goal, namely to obtain
useful information and knowledge from very large data sets. This data can be in the form of a database.
However, both have different types of data. Data mining has input data from structured data while text
mining generally uses unstructured or at least semi-structured data. This causes additional challenges in text
mining, namely complex and incomplete text structures, unclear and non-standard meanings, and different
languages plus inaccurate translations (Sussolaikah & Alwi, 2016).
 Social media, which is a potential source of structured data, is considered a valuable source of market
and customer intelligence information (Gal-Tzur et al., 2014). Many companies use text mining to analyze or
predict customer needs and assess their brand perception. Text analysis can solve the issues by analyzing
large volumes of structured data, expressing opinions, emotions and sentiments and their relationship to
brands and products

3. Text Pre-processing
 Text pre-processing is the stage of the initial process of the text to prepare the text into data that will be
processed further (Haddi et al., 2013). The following is the process of explaining the stages of text pre-
processing:
a. Tokenizing. The tokenizing stage is the stage of cutting the input string based on each word that makes it
 up.
b. Case Folding. As explained above, that at the pre-processing stage several things were changed, all letters
 in the document became lowercase. Only letters "a" through "z" are accepted. Characters other than
 letters are removed and are considered delimiters.
c. Cleaning. The cleaning stage is a process of cleaning documents from several unnecessary words to
 reduce noise at the classification stage. The words or characters that will be omitted in the comment data
 are symbols, numbers, url links, hash tags (#), and mentions (@username).
d. Normalization. Normalization is a process to convert non-standard words. The process for handling
 words like this is done by involving a dictionary made up of non-standard words and their standard
 words.
e. Filtering. This filtering (stop-word removal) stage is a common word that usually appears in large
 numbers and is considered meaningless, so it is unlikely that it will affect. Some examples of words that
 are categorized into stopwords or common words that usually appear in large numbers that have no
 meaning include "with", "at", "to", "and", time indicators, and question words.

4. Naïve Bayes Algorithm
 Naïve Bayes was developed by Reverend Thomas Bayes in the 18th century. Naïve Bayes classification is
a statistical classification that can be used to predict the probability of membership of a class. Naïve Bayes
classification is based on the Bayes theorem which has similar classification capabilities to decision trees and
neural networks. Classification using the Naïve Bayes method is generally carried out using a probability or
136 |Jurnal Varian| Vol.4, No.2, April 2021, Hal.133-140

probability approach. This algorithm predicts the probability in the future based on the experiences that
already exist in the past (Sitepu et al., 2020). Jurafsky D and Martin, JH (2018) in text classification
techniques using the Naive Bayes equation by classifying the ∈ category of a ∈ document where =
 { 1 , 2 , 3 , . . . , } and = { 1 , 2 , 3 , … , }. The document is a collection of words that make up it and does
not pay attention to the order in which the words appear in the document. So that the previous equation can
be written (Jurafsky & Martin, 2018):
 + 1
 ( | ) =
 + | | (1)

 | : the number of words in document which belongs to class
 : the number of terms that appear in class
 : total term in class
 | | : total of all unique terms
 There are several advantages and disadvantages of the Naive Bayes algorithm. The advantages of Naive
Bayes are as follows: It can be used for both quantitative and qualitative data; does not require a large
amount of data; no need to do a lot of training data; if a value is missing, it can be ignored in the calculation;
the calculation is fast and efficient; easy to understand; easy to make; document classification can be
personalized, tailored to the needs of each person; when used in a programming language, the code is
simple; can be used for binary or multiclass problem classification (Widianto, 2019).

5. Confusion Matrix
 In the field of data mining, a configuration matrix is used to calculate the accuracy of a method. Basically,
the configuration matrix contains information that compares the classification results carried out by the
system with the classification results that should be (Utomo et al., 2014). This confusion matrix performs
calculations that produce 4 outputs, namely recall, precision, accuracy, and error rate. Recall is the success
rate of the system in recovering information. Precision is the level of accuracy between the information
requested by the user and the answers given by the system. Meanwhile accuracy is defined as the level of
closeness between the predicted value and the actual value. The confusion matrix formula is as follows:

 recall = × 100% (2)
 +

 precission = × 100% (3)
 +
 Reciever Operating Characteristic or ROC curve is often utilised as a visualisation plot to measure the
performance of a binary classifier. It’s not a metric of the model, per se, rather the graphical representation
of the True Positive Rate (TP) versus False Positive rate (FP) at various classification threshold from 0 to 1.

C. RESEARCH METHODS
1. Data collection and Split Data
 The data needed in this study are the name of the twitter social network account, the commentator, and
the comment text. Comments used as training data and test data were collected via Twitter data during the
2019 election. The process of collecting comment data is done manually by filtering the search for comments
on twitter according to the research object. Then the comments are compiled into a CSV file and labeled. The
ratio of the number of training data and test data is 60%:40%. More complete information:

 Table 1. Split Data Positive and Negative Statement
 Labeled Bully Labeled Not Bully Total
 Training Data 247 353 600
 Test Data 157 233 400
Ade Clinton Sitepu, Determining Bullying Text...137 Class imbalance is a common problem in machine learning classifications where there is a disproportionate ratio in each class. Applying inappropriate evaluation metrics to models that are generated using unbalanced data can be dangerous. Imagine if the training data had an accuracy rate that classified all samples very well (99.8%), but clearly, this model would not provide valuable information. In this case, other alternative evaluation metrics can be applied such as precision and AUC. 2. Pre-processing Analysis Pre-processing data is an important step in conducting classification analysis which aims "to clean data from elements that are not needed to speed up the classification process. Figure 1 is a flowchart of the pre- processing data stages used. Figure 1. Pre-processing Stages 3. Naive Bayes Classification At this stage, an analysis of the classification methods that have been obtained with training data is carried out. The steps of Naïve Bayes classification: a. Input data training b. Find each Find each class with: Pr( ) =number of class/number of testing data c. Find Pr( | ) 1 + Pr( | ) = (4) (| | + ( ) ) d. Find Pr( | ) ( | ) = ( | ) × … × ( | ) (5) e. Input data testing f. Find the result of classification ( 1| ) = ( 1) × ( | 1) (6) g. The test data has been classified Data that has passed the pre-processing process and term frequency calculation is training data that will be input to the testing process. Furthermore, the test data will go through the classification stage using the Naïve Bayes algorithm. 4. Implementation and Testing Implementation is a stage that is developed based on the results of the analysis and design that has been done previously. This stage indicates that the tools are ready to be used and used in real situations, so that it will be known whether the tools will run with the desired purpose. The implementation in this research is Google Colab tools in Python language, where the supporting tools needed include: a. Hardware (Hardware) Processor: Intel (R) Celeron (R) CPU N2840 @ 2.16GHz Memory (RAM): 2048 MB DDR Memory (HDD): 500 GB b. Operating System Software: Microsoft Windows 7 Pro 64-bit Text Editor: Notepad ++ Word processor: Microsoft Excel Web Browser: Google Chrome
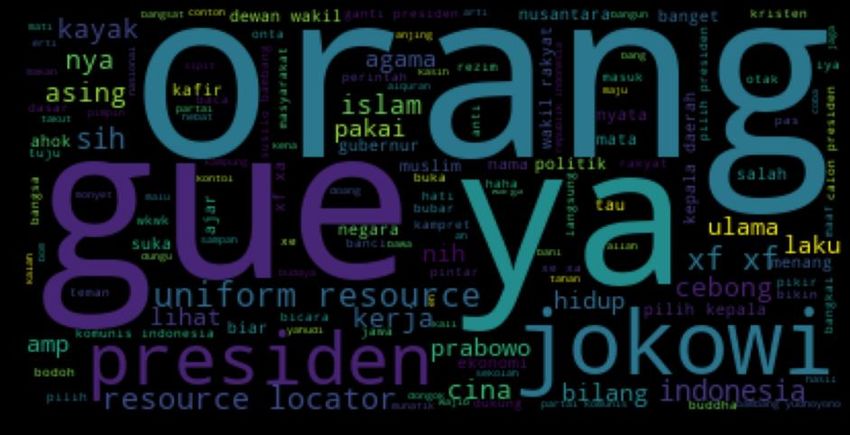
138 |Jurnal Varian| Vol.4, No.2, April 2021, Hal.133-140

 Testing Tools: Google Colab
 Program Language: Python
 Furthermore, after the implementation is carried out the testing phase of the analysis results is carried
out. The testing phase is carried out for the purpose of knowing how the method is performing. In
calculating the level of accuracy of the method, the study uses the Confusion Matrix test.

D. RESULTS AND DISCUSSION
1. Data Visualization in Cyber-bullying Classification
 Data that has passed the pre-processing stage is then described in the form of a hostogram and word
cloud. Data visualization is useful so that you know the description of the data that will be analyzed by the
system. Wordcloud is for visualizing documents in the form of text so that it gives an interesting but
informative impression. The large word size on the display is the word most frequently used in the dataset.

 Figure 2. World Cloud Visualization

2. Cyber-bullying Classification using the Naïve Bayes Algorithm
 Prediction results of the Naïve Bayes classification are generated by calculations based on the
distribution of training data and test data. The percentage level of accuracy is generated based on the value
of the comment labeling with the calculated weight of the value of each document.

 Table 2. Classification Results with Naive Bayes
 Precision Recall
 Training Data 0.97 0.97
 Test Data 0.87 0.88

 It is known that the system time to complete the program is 0.033 seconds (see attachment 1). The next
test is to calculate the level of accuracy of the Naïve Bayes algorithm on research training data. It can be seen
that the level of classification precision of the Naïve Bayes algorithm for training data is 97% (see
attachment 2).
 Next, calculate the level of accuracy of the Naïve Bayes algorithm on the research test data. It can be seen
that the level of classification accuracy of the Naïve Bayes algorithm on the test data is 92% (see attachment
3).

3. Classification Analysis with Confusion Matrix
 In order to obtain a more complete picture, it is not enough that the results are presented in terms of
accuracy. A real number of documents that have been classified as correct and classified as incorrect is
required. The real number can be determined using confution matrix analysis. It should be noted, the
confusion matrix used is for test data (not training data). The results of Naïve Bayes confusion matrix
analysis can be seen in Figure 3.
Ade Clinton Sitepu, Determining Bullying Text...139

 Figure 3. Naive Bayes algorithm confusion Matrix results

 Thus, accuracy = 0.88, precision = 0.87 and recall = 0.88 (see attachment 3). And the Reciever Operating
Characteristic (ROC) AUC score = 0.88 with the visualization of (ROC) curve:

 Figure 4. Reciever Operating Characteristic Naïve Bayes in Cyber-bullying Classification

 In Figure 4 you can see 2 curves, the first curve in blue and the second in red. Based on the figure 4, it
can be concluded that the blue curve performance is good because it is above the red line. So, the technique
in this study can be accepted and used to solve case classification in an attempt to identify cyber-bullying
comments.

E. CONCLUSSION AND SUGGESTION
 The dataset used in this research is 1000 comments from social media. The research only carries out a
classification process based on the previously inputted dataset, not to display the results of the new data
classification input. Based on the implementation and testing that has been done, the Naïve Bayes algorithm
can be applied in the classification process of comments that contain elements of bullying on social media.
Classification using the Naïve Bayes algorithm is well categorized with the precission value of the Naïve
Bayes algorithm that is 87% and ROC AUC score at 88%. In terms of the classification process time on the
system, the Naïve Bayes algorithm provides fast processing speeds with a processing time of 0.0338492393
seconds. Suggestions for development and quality on future research, increase the system's ability to
provide classification results on newly inputted data by the user. For further research, use a larger number
of datasets and make an accuracy comparison based on the ratio of training data and test data. In this study
140 |Jurnal Varian| Vol.4, No.2, April 2021, Hal.133-140

using 60%: 40%. Furthermore, we can compare the results at a ratio of 60%: 40%, 65%: 35%, 70%: 30%
and others so that it can be seen which ratio level is best for the text classification process.

ACKNOWLEDGEMENT
 Thank you to those who have helped both substantially and financially. To Universitas Potensi Utama
lecturers through the Faculty of Engineering and Computer Science who have provided theories to compile
this research and we also like to thank our friends and family who supported us and offered deep insight
into the research.

REFERENCES
El Asam, A., & Samara, M. (2016). Cyberbullying and the law: A review of psychological and legal challenges. Computers
 in Human Behavior, 65, 127–141.
Gal-Tzur, A., Grant-Muller, S. M., Kuflik, T., Minkov, E., Nocera, S., & Shoor, I. (2014). The potential of social media in
 delivering transport policy goals. Transport Policy, 32, 115–123.
Haddi, E., Liu, X., & Shi, Y. (2013). The role of text pre-processing in sentiment analysis. Procedia Computer Science, 17,
 26–32.
Hendayanti, N. P. N., Putri, G. A. M. A., & Nurhidayati, M. (2018). Ketepatan Klasifikasi Penerima Beasiswa STMIK
 STIKOM Bali dengan Hybrid Self Organizing Maps dan Algoritma K-Mean. Jurnal Varian, 2(1), 1–7.
Jurafsky, D., & Martin, J. H. (2018). Speech and language processing (draft). Chapter A: Hidden Markov Models (Draft of
 September 11, 2018). Retrieved March, 19, 2019.
Laksana, B. A. (2017). Mensos: 84% Anak Usia 12-17 Tahun Mengalami Bullying. DetikNews; Detik News.
 https://news.detik.com/berita/d-3568407/mensos-84-anak-usia-12-17-tahun-mengalami-bullying
Livingstone et al., S. (2020). Cyberbullying: Apa itu dan bagaimana menghentikannya. UNICEF Indonesia.
 https://www.unicef.org/indonesia/id/child-protection/apa-itu-cyberbullying
Norwawi, N. M. (2020). Recognition decision-making model using temporal data mining technique. Journal of
 Information and Communication Technology, 4, 37–56.
Sanda, A. (2016). Tinjauan Yuridis Terhadap Fenomena Cyber Bullying Sebagai Kejahatan Di Dunia Cyber Dikaitkan
 Dengan Putusan Mahkama Konstitusi Nomor 50/Puu-Vi/2008. Repository.
Sari, Y., & Stevenson, M. (2016). Exploring Word Embeddings and Character N-Grams for Author Clustering. CLEF
 (Working Notes), 984–991.
Septian, G., Susanto, A., & Shidik, G. F. (2017). Indonesian news classification based on NaBaNA. 2017 International
 Seminar on Application for Technology of Information and Communication (ISemantic), 175–180.
Sitepu, A. C., Wanayumini, W., & Situmorang, Z. (2020). Comparative of ID3 and Naive Bayes in Predictid Indicators of
 House Worthiness. Jurnal Ipteks Terapan, 14(3), 212–218.
Sussolaikah, K., & Alwi, A. (2016). Sentiment Analysis Terhadap Acara Televisi Mata Najwa Berdasarkan Opini
 Masyarakat Pada Microblogging Twitter (Issue November). Universitas Muhammdiyah ponorogo.
 http://eprints.umpo.ac.id/2355/
Urano, Y., Takizawa, R., Ohka, M., Yamasaki, H., & Shimoyama, H. (2020). Cyber bullying victimization and adolescent
 mental health: the differential moderating effects of intrapersonal and interpersonal emotional competence.
 Journal of Adolescence, 80, 182–191.
Utomo, C. P., Pratiwi, P. S., Kardiana, A., Budi, I., & Suhartanto, H. (2014). Best-Parameterized Sigmoid ELM for Benign
 and Malignant Breast Cancer Detection. International Conference on Artificial Intelligence and Pattern Recognition,
 AIPR 2014.
Widianto, M. H. (2019). Algoritma Naive Bayes. Binus University. https://binus.ac.id/bandung/2019/12/algoritma-
 naive-bayes/
Wu, X., & Kumar, V. (2009). The top ten algorithms in data mining. CRC press.
You can also read