Housing Finance Micro Data: A Decade of Progress for Research and Policy
←
→
Page content transcription
If your browser does not render page correctly, please read the page content below

Housing Finance Micro Data: A Decade of Progress for Research
                         and Policy

                                             Kristopher Gerardi

                                        Federal Reserve Bank of Atlanta

                             Room to Grow: Housing for a New Economy
                                                 FRB Dallas
                                              February 21, 2020

Kris Gerardi (FRB Atlanta)        Housing Finance Micro Data: A Decade of Progress for Research and Policy February 21, 2020   1 / 28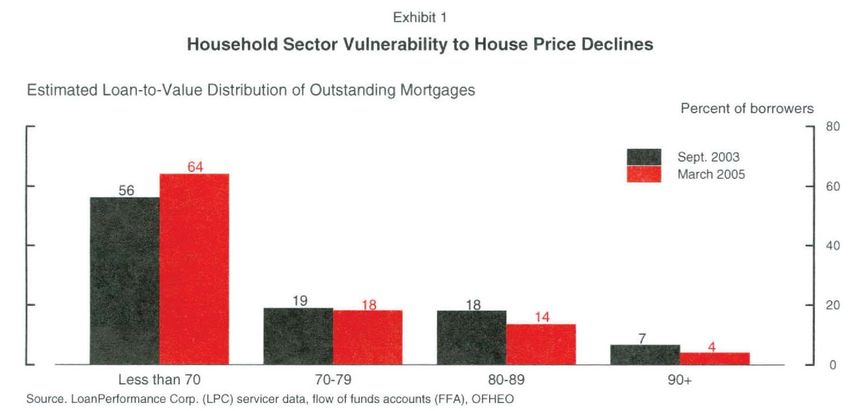
Disclaimer: I do not speak for:

              Raphael Bostic Atlanta Fed
                                                                         Jerome Powell Federal
              President
                                                                         Reserve Board Chairman

  The views expressed are my own and do not necessarily reflect those of the Federal Reserve Bank of
  Atlanta or the Federal Reserve System.
    Kris Gerardi (FRB Atlanta)   Housing Finance Micro Data: A Decade of Progress for Research and Policy February 21, 2020   2 / 28
Did a Lack of Data Handcuff Regulators/Researchers in Crisis?

       Federal Reserve Bank of Philadelphia Annual Report 2010:

       What might have happened in the recent financial crisis and recession
       if regulators and researchers had had better and timelier information
       about mortgage and credit markets? Could the data have helped
       prevent the spread of contagion from the subprime mortgage market
       to the broader economy?

   Kris Gerardi (FRB Atlanta)   Housing Finance Micro Data: A Decade of Progress for Research and Policy February 21, 2020   3 / 28
Available Housing Market Data Pre-Crisis
Mostly aggregate information and surveys ⇒ limited administrative micro data.
Flow of Funds (Federal Reserve) – aggregate statistics on $ flows to different
sectors of economy.
Periodic research-oriented surveys:
American Housing Survey (AHS) – longitudinal housing unit survey conducted
biennially.
Survey of Consumer Finances (SCF) – triennial cross-sectional survey of U.S.
families that contains some basic information on mortgage debt and home values.
Panel Study of Income Dynamics (PSID) – longitudinal, biennial survey that includes
limited information on housing and mortgages, but rich info. on demographics.
Kris Gerardi (FRB Atlanta) Housing Finance Micro Data: A Decade of Progress for Research and Policy February 21, 2020 4 / 28Available Housing Market Data Pre-Crisis
Industry surveys and publications:
Mortgage Banker’s Association (MBA) – real estate finance industry association that
surveys it’s members on loan originations, delinquencies, etc.
National Association of Realtors – surveys on home listings, sales, etc.
Inside Mortgage Finance – industry newsletters that contain basic info. on mortgage
market trends.
Limited micro data:
Home Mortgage Disclosure Act (HMDA) data – lender-reported applications and
originations with limited info on borrowers and mortgages.
Income, race, sex, loan size, geographic location.
No info. on credit scores, LTV ratios, interest rates, or loan performance.
Non-agency, privately-securitized loans (PLS) – only 9–14% of total U.S. mortgage
debt.
Detailed info. on mortgage characteristics, and monthly performance.
But not widely disseminated – Board of Governors and a few researchers.
Kris Gerardi (FRB Atlanta) Housing Finance Micro Data: A Decade of Progress for Research and Policy February 21, 2020 5 / 28FOMC Meeting 2005
Prepared remarks by a mortgage market staff expert at the Board of Governors
during the June 2005 Meeting of the Federal Open Market Committee (FOMC):
To sum up, neither borrowers nor lenders appear particularly shaky. Indeed,
the evidence points in the opposite direction: borrowers have large equity
cushions, interest-only mortgages are not an especially sinister development,
and financial institutions are quite healthy. Nonetheless, even the most
sanguine analyst quails when contemplating a historically unprecedented drop
in nationwide nominal house prices. Such a drop will obviously hurt both
borrowers and lenders and will also no doubt expose weaknesses that will only
be obvious in hindsight. Thus, perhaps it would be best simply to venture
the judgment that the national mortgage system might bend, but will likely
not break, in the face of a large drop in house prices.
Kris Gerardi (FRB Atlanta) Housing Finance Micro Data: A Decade of Progress for Research and Policy February 21, 2020 6 / 28What Happened Next? • Boom and bust i
housing at heart
• Focus on the boo
House Prices, 2003=100
150
House Prices (Case-Shiller Comp. 20)ց lending
125 House prices fell by more
100
andyears!
• two
than 30% in the connecti
% of mortgages
75
1.2
the foreclosures.
Mortgage defaults and
0.8
Foreclosure Starts (MBA)ց
0.4 foreclosures more than
6
tripled.
in %
5
տUnemployment rate
4
14 Unemployment rose above
in 1000s of points
Dow Jones Industrial Indexց
12
10%.
10 The stock market fell by
8 approximately 50%.
99 00 01 02 03 04 05 06 07 08 09
Paul
Kris Willen
Gerardi (FRB(Boston
Atlanta) Fed) Introduction
Housing Finance Micro Data: A Decade of Progress for Research and Policy February 21, 2020 7 2410,
/ 28Where Did We Drop the Ball?
Earlier in the prepared remarks:
Exhibit 1
Household Sector Vulnerability to House Price Declines
Estimated Loan-to-Value Distribution of Outstanding Mortgages
Percent of borrowers
Sept. 2003
64March 2005
56
19 1
14
7
4
Less than 70 70-79 80-89 90+
Source. LoanPerformance Corp. (LPC) servicer data, flow of funds accounts (FFA), OFHEO
Used this graph to argue that mortgage borrowers were not highly leveraged as
most had significant housing equity.
Significantly understated borrower leverage, because the data did not account for
junior liens (i.e. only incorporated LTV of first mortgage) and did not account for
massive cash-out refinancing activity!
Kris Gerardi (FRB Atlanta) Housing Finance Micro Data: A Decade of Progress for Research and Policy February 21, 2020 8 / 28Where Did We Drop the Ball?
Glaeser, Gottlieb, and Gyourko (2012):
Distribution of Loan-to-Value Ratios at Purchase
89 Metropolitan Area Sample, 1998–2008
First Mortgage Only Up to Three Mortgages
Year # Observations
50th 75th 90th Mean 50th 75th 90th Mean
2002 1,967,336 80% 95% 99% 70% 85% 96% 100% 73%
2003 2,127,516 80% 94% 99% 69% 82% 96% 100% 72%
2004 2,751,095 80% 85% 98% 65% 80% 95% 100% 69%
2005 3,039,726 80% 80% 95% 65% 86% 99% 100% 71%
2006 2,421,704 80% 80% 98% 68% 90% 100% 100% 74%
2007 1,777,035 80% 95% 100% 69% 90% 100% 100% 73%
2008 1,410,082 80% 98% 99% 65% 80% 98% 99% 67%
“Piggyback” mortgages became common in 2000s, but we didn’t have data on
them! ⇒ Underestimates of borrower leverage at origination!
Kris Gerardi (FRB Atlanta) Housing Finance Micro Data: A Decade of Progress for Research and Policy February 21, 2020 9 / 28Where Did We Drop the Ball?
Duca and Kumar (2014):
Figure 1: Cash-Out Refinancings Have Been
ELOOLRQV SHU
TXDUWHU16$ a Large Component of "Active MEW"
Cash-Out
Refinancings
Home Equity
Loans
6RXUFH
XSGDWHGGDWDEDVHGRQ*UHHQVSDQDQG .HQQHG\ )UHHFDVKH[WUDFWHGIURPWKHVHWZRFRPSRQHQWVLVURXJKO\HTXDOWR$FWLYH
0(:ZLWKVRPHPLQRUGLIIHUHQFHV
Mortgage equity withdrawal exploded during the boom period, but no good data!
⇒ Underestimates of contemporaneous borrower leverage!
Kris Gerardi (FRB Atlanta) Housing Finance Micro Data: A Decade of Progress for Research and Policy February 21, 2020 10 / 28Where Did We Drop the Ball?
Not just a leverage measurement issue.
Lack of data also led to underestimates of certain “risky” mortgage products that
facilitated speculation such as IO mortgages!
In same FOMC presentation, it was noted that interest-only loans were becoming
increasingly popular in private-label securitization deals, but that those deals were
only a tiny fraction of the overall market.
Problem was that volume of IO loans was also increasing in GSE market, which
accounted for 30-50% of originations during boom period.
But we didn’t have the data to see this increasing trend.
Kris Gerardi (FRB Atlanta) Housing Finance Micro Data: A Decade of Progress for Research and Policy February 21, 2020 11 / 28Where Did we Drop the Ball?
GSE Fraction of IO Loans
25%
Fannie Mae Freddie Mac
20%
15%
10%
5%
0%
2004 2005 2006 2007 2008
Kris Source:
Gerardi McDash
(FRB Atlanta) Housing
Analytics and author’s Finance Micro Data: A Decade of Progress for Research and Policy February 21, 2020
calculations. 12 / 28Huge Advances in Availability of Micro Data Post-Crisis
FHFA and CFPB
1 Fannie and Freddie Public Use Database:
Created by The Housing and Economic Recovery Act (HERA) of 2008.
Detailed, loan-level data on Fannie and Freddie mortgages originated between
2000–present.
Includes detailed loan characteristics and performance.
2 National Mortgage Database
5% sample of all first-lien mortgages going back to 1998.
Includes detailed info. on loan characteristics and performance.
3 Survey of Mortgage Originations
Quarterly survey about borrower’s mortgage origination experiences.
How much people shop for mortgages and how much knowledge they have about the
overall origination process.
Kris Gerardi (FRB Atlanta) Housing Finance Micro Data: A Decade of Progress for Research and Policy February 21, 2020 13 / 28Huge Advances in Availability of Micro Data Post-Crisis
RADAR – Risk Assessment Data Analysis and Research
Formed in 2008 in the Philadelphia Fed.
Goal: Provide the Federal Reserve System with better data and analysis on
consumer loans and securities for identifying emerging risks to the financial system.
Built a vast repository containing micro level datasets on property transactions,
mortgages, and other consumer credit products – 16 distinct administrative datasets
in total.
Has been very successful in facilitating:
1 Research
2 Bank Supervision and Regulation
Kris Gerardi (FRB Atlanta) Housing Finance Micro Data: A Decade of Progress for Research and Policy February 21, 2020 14 / 28RADAR: Research Applications
Will focus on 4 broad categories of data today:
1 Mortgage servicing data.
2 Property transactions data.
3 Consumer credit data.
4 Property listings data.
Kris Gerardi (FRB Atlanta) Housing Finance Micro Data: A Decade of Progress for Research and Policy February 21, 2020 15 / 28Mortgage Servicing Data (McDash Analytics)
Mortgage-level panel data from large servicers (big banks) going back to 1990s.
50–70% of market (depending on the time period).
160 million loans, 7.36 billion observations
Includes data on all market segments:
1 Portfolio loans (banks).
2 GSE/agency (Fannie Mae and Freddie Mac) loans.
3 Non-agency securitized or “private-label” loans (PLS) – “subprime” and “alt-a”
loans that triggered financial crisis.
Underwriting characteristics at origination:
Credit score, LTV ratio, documentation level, occupancy status, interest rate,
ARM/FRM, amortization schedule, etc.
Monthly loan performance.
Geographic info – state and ZIP code.
Kris Gerardi (FRB Atlanta) Housing Finance Micro Data: A Decade of Progress for Research and Policy February 21, 2020 16 / 28Mortgage Servicing Data – Influential Papers
Foote, Gerardi, and Willen (2009, NBER) – “Reducing Foreclosures: No Easy
Answers”
Elul et al. (2010, AER) – “What Triggers Mortgage Default?”
Bubb and Kaufmann (2012, JME) – “Securitization and Moral Hazard: Evidence
from a Lender Cutoff Rule”
Gerardi, Lambie-Hanson, and Willen (2013, JUE) – “Do Borrower Rights Improve
Borrower Outcomes? Evidence from the Foreclosure Process”
Adelino, Gerardi, and Willen (2013, JME) “Why Dont Lenders Renegotiate More
Home Mortgages? Redefaults, Self-Cures and Securitization”
Piskorski, Seru, and Vig (2010, JFE) – “Securitization and Distressed Loan
Renegotiation: Evidence from the Subprime Mortgage Crisis”
Fuster and Vickery (2016, RFS) – “Securitization and the Fixed-Rate Mortgage”
Kris Gerardi (FRB Atlanta) Housing Finance Micro Data: A Decade of Progress for Research and Policy February 21, 2020 17 / 28Property Transactions Data (CoreLogic, DataQuick)
Public data on residential property transactions recorded at the county-level.
Coverage for almost all of the 3000+ counties in the U.S. going back to
late-1990s/early-2000s.
Property transactions ⇒ both arms-length and nominal sales.
Exact addresses and parcel numbers that are consistent over time.
Sale prices (in most states).
Mortgage transactions.
Exact $ amounts.
All liens on property including piggybacks and home-equity loans (and lines of credit).
Lender identity.
Foreclosure documents.
Foreclosure deeds and court documents (for judicial states).
Kris Gerardi (FRB Atlanta) Housing Finance Micro Data: A Decade of Progress for Research and Policy February 21, 2020 18 / 28Property Transactions Data – Influential Papers
Gerardi, Lehnert, Sherlund, Willen (2008, BPEA) – “Making Sense of the
Subprime Crisis.”
Foote, Gerardi, And Willen (2008, JUE) – “Negative Equity: Theory and
Evidence.”
Campbell, Giglio, and Pathak (2011, AER) – “Forced Sales and House Prices.”
Glaeser, Gottlieb, and Gyourko (2012, NBER) – “Can Cheap Credit Explain the
Housing Boom?”
Muehlenbachs, Spiller, and Timmins (2015, AER) – “The Housing Market
Impacts of Shale Gas Development”
DeFusco (2017, JF) – “Homeowner Borrowing and Housing Collateral: New
Evidence from Expiring Price Controls”
Kris Gerardi (FRB Atlanta) Housing Finance Micro Data: A Decade of Progress for Research and Policy February 21, 2020 19 / 28FRB Consumer Credit Panel (Equifax)
Credit registry data.
Quarterly, longitudinal, 5% random sample of all individuals with credit history.
1999:Q1 – Present
239 million borrowers, 3.31 billion observations.
Includes credit files of other individuals living in same household ⇒ Possible to
conduct both individual-level and household-level analysis.
Data on virtually all forms of consumer debt ⇒ mortgages, credit cards, cars,
student loans, personal loans, etc.
Loan balances, payment status.
Credit scores.
Limited demographic info – age.
Fairly detailed geographic info ⇒ census block (∼ 11 million).
Kris Gerardi (FRB Atlanta) Housing Finance Micro Data: A Decade of Progress for Research and Policy February 21, 2020 20 / 28FRB Consumer Credit Panel - Other Influential Papers
Haughwout, Lee, Tracy, van der Klaauw (2011, NBER) “Real Estate Investors,
the Leverage Cycle, and the Housing Market Crisis”
Bhutta (2015, JME) – “The Ins and Outs of Mortgage Debt During the Housing
Boom and Bust”
Fulford (2015, JME) – “How Important is Variability in Consumer Credit Limits?”
Brown, Cookson, and Heimer (2015, RFS) – “Law and Finance Matter: Lessons
From Externally Imposed Courts”
Bhutta and Keys (2016, AER) – “Interest Rates and Equity Extraction During the
Housing Boom”
Albanesi, DeGiorgi, Nosal (2016, NBER) – “Credit Growth and the Financial
Crisis: A New Narrative.”
Foote, Loewenstein and Willen (2018, ReStud) “Cross-Sectional Patterns of
Mortgage Debt during the Housing Boom: Evidence and Implications Details
Kris Gerardi (FRB Atlanta) Housing Finance Micro Data: A Decade of Progress for Research and Policy February 21, 2020 21 / 28Property Listings Data (CoreLogic MLS)
Realtor data.
Covers ∼ 60% of all active U.S. property listings, and contains 10–20 years of
historical data, depending on the market.
Information taken directly from the electronic system that most realtors enter
property listing information into.
Detailed property characteristics.
Listing price(s)
Transaction price (for properties that sell).
Dates – listing date, contract date, closing date.
Identity of realtor and brokerage house.
Realtor description of property.
Realtor commissions.
Includes rental listings.
Kris Gerardi (FRB Atlanta) Housing Finance Micro Data: A Decade of Progress for Research and Policy February 21, 2020 22 / 28Property Listings Data (CoreLogic MLS)
Is being used to look at numerous policy-relevant research questions.
Example: New measure of price-to-rent ratios.
P/R is a popular statistic to assess whether house prices are “overvalued”.
Significant measurement issue with current measures ⇒ theory tells us that we need
prices and rents for same properties.
But current measures impute rents for owner-occupied houses using various,
imperfect methods.
Federal Reserve economists are developing a measure using MLS data based on
sample of properties where we see both rents and transaction prices.
Begley, Lowenstein, and Willen (2019) – “The Price-Rent Ratio During the Boom and
Bust: Measurement and Implications”
Kris Gerardi (FRB Atlanta) Housing Finance Micro Data: A Decade of Progress for Research and Policy February 21, 2020 23 / 28RADAR: Policy Applications
In addition to collecting data for research purposes, RADAR also collects data for
bank stress-tests.
Began in 2009 with the Supervisory Capital Assessment Program (SCAP).
Stress tests conducted by Federal Reserve to determine if the largest banks had
sufficient capital buffers to withstand the recession and further financial market
turmoil.
RADAR used CCP data to construct loss models.
10/19 largest U.S. commercial banks were deemed under-capitalized ⇒ infusions of
$75 billion of capital into banks.
Widely viewed as credible and as having reduced uncertainty about the financial
strength of covered institutions (see 2010 speeches by Govs. Bernanke and Tarillo).
Kris Gerardi (FRB Atlanta) Housing Finance Micro Data: A Decade of Progress for Research and Policy February 21, 2020 24 / 28RADAR: Policy Applications
SCAP success led to Congress formally sanctioning this approach into the
Dodd-Frank Act Stress Tests (DFAST).
Beginning in 2012, RADAR began collecting detailed data directly from the
largest banks for their loan portfolios of credit cards, 1st lien mortgages and home
equity loans ⇒ “Y-14M” data.
Data is used to estimate loss models, and produce bank-by-bank forecasts of future
losses under severe macroeconomic scenarios.
Bank Holding Companies Records Total Records
Y‐14M Data Schedule Submitting Jan. 2019 Data for Jan. 2018 June 2012 – Jan. 2019
First Lien Mortgage 29 21 million 2.2 billion
Home Equity 25 6 million 662 million
Address Match 29 27 million 2.8 billion
Credit Card 18 541 million 43 billion
Kris Gerardi (FRB Atlanta) Housing Finance Micro Data: A Decade of Progress for Research and Policy February 21, 2020 25 / 28RADAR: Policy Applications
Data on private market securities – Intex.
Details on security characteristics (subordination, cash flow triggers, etc.) that allow
one to value bonds under range of scenarios.
Asset Class Active Deals Paid Off Deals Total Sectors Included
Non-Agency RMBS 8,872 6,265 15,137 RMBS, Home Equity, NPL/RPL
Non-Agency CMBS 1,389 1,243 2,632 CMBS, CRE CDO
Student Loan ABS 634 299 933 Student Loans
Auto ABS 449 1,555 2,004 Auto Lease, Auto Loan
Credit Card ABS 147 1,280 1,427 Credit Card
CDO/CLO 1,853 1,739 3,592 CDO, Balance Sheet CLO, CLO
Kris Gerardi (FRB Atlanta) Housing Finance Micro Data: A Decade of Progress for Research and Policy February 21, 2020 26 / 28RADAR: Policy Applications
Cordell, Feldberg, Sass (2019) - “The Role of ABS CDOs in the Financial Crisis”
Show that it was losses on CDOs collaterized by lower-rated (BBB) subprime
mortgage securities that brought financial system to its knees in 2008.
Losses on AAA subprime securities were extremely low ⇒ < 1% of principal
outstanding (∼ $5 billion)
Losses on lower-rated securities were much larger ⇒ > 50% of principal outstanding
(∼ $100 billion)
Losses on AAA CDOs were 80% ⇒ $325 billion and concentrated on balance sheets
of largest investment + commercial banks.
With Intex data, the Fed would have been in much better position to identify
systemic risks in the private securities market.
Kris Gerardi (FRB Atlanta) Housing Finance Micro Data: A Decade of Progress for Research and Policy February 21, 2020 27 / 28Concluding Remarks
Dearth of quality micro data on U.S. housing and mortgage markets in the
pre-crisis period.
Aggregate data and limited survey information from Census and industry
publications.
Led policymakers to falsely believe that the mortgage market was more resilient to
price declines than it really was in reality.
Since the crisis, significant efforts to address the data issue by constructing
detailed micro data on mortgages and housing transactions.
Federal Reserve System has been front and center in this initiative through RADAR.
Has fueled high quality research and policy contributions.
Hopefully will help to prevent a future crisis or at least help produce a more focused
response to one that does occur!
Kris Gerardi (FRB Atlanta) Housing Finance Micro Data: A Decade of Progress for Research and Policy February 21, 2020 28 / 28You can also read