Unsupervised Method to Analyze Playing Styles of EPL Teams using Ball Possession-position Data
←
→
Page content transcription
If your browser does not render page correctly, please read the page content below
UI*OUFSOBUJPOBM$POGFSFODFPO"EWBODFE$PNQVUJOH$PNNVOJDBUJPO4ZTUFNT *$"$$4

  Unsupervised Method to Analyze Playing Styles of
   EPL Teams using Ball Possession-position Data
                   Pranav Verma                                    Bharath Sudharsan                           Bharathi Raja Chakravarthi
     National University of Ireland Galway                     Data Science Institute                            Data Science Institute
         pranavverma1295@gmail.com                      National University of Ireland Galway             National University of Ireland Galway
                                                        bharath.sudharsan@insight-centre.org                bharathi.raja@insight-centre.org

              Colm O’Riordan                                                                Seamus Hill
 National University of Ireland Galway                                         National University of Ireland Galway
      colm.oriordan@nuigalway.ie                                                     seamus.hill@nuigalway.ie

    Abstract—In the English Premier League (EPL) matches, a                      ball possession data of a match. Hence, ball possession is
 network of advanced systems gathers sports data in real-time                    one of the most important statistics to measure a team’s
 to build a possession-position dataset. In this work, data fields                performance in a game [6]. In this work, a raw possession-
 from the sophisticated raw possession-position dataset were
 extracted and processed to build a transformed version of the                   position dataset built from such advanced system is used.
 raw dataset. This transformed version contains ball possession                  Experiments are performed using a transformed version of
 data from 3 areas and 9 zones of the pitch. Two experiments                     this raw dataset to provide deeper insights on, the playing
 were run based on this transformed dataset, aiming to under-                    styles of EPL teams, grouping teams based on their playing
 stand and analyze the playing styles of EPL teams. The analysis                 style, how away matches influence playing style of a team,
 answers multiple questions such as, is the playing style of the
 top 3 teams (Manchester City, Liverpool, and Chelsea) same in                   etc.
 both home and away matches, do away match conditions affect                        Successful EPL teams utilize defenders to build-up play
 the playing style of teams, etc. Existing studies use multiple
                                                                                 and maintain possession via short passes [7], permitting
 parameters such as goal scoring patterns, player performances,
 team performance, etc. to understand and analyze the playing                    the attacking team to move the opponents around the
 style of teams. In this work, using just the ball possession-                   pitch and wait for attacking opportunities to emerge. Also,
 position data, the playing styles of teams were able to be derived.             the findings of [7] highlight, EPL teams mostly use their
 This reduces the usage of such multiple parameters to perform                   defenders for building the play which might lead to a goal.
 the same task, which is to understand and analyze the playing
                                                                                 On the other hand, the findings of [8] [9] [10] convey
 styles of teams.
    Index Terms—k-means, ball possession-position data, EPL,                     that, every EPL team has a unique playing style. These
 sports analytics, data transformation, elbow method, similar                    article contradicts the findings of [7]. Since various research
 playing style                                                                   outcomes contradict each other, there is a strong need for
                                                                                 an accurate understanding of a team’s playing style to find
                           I. I NTRODUCTION                                      out weather dominating ball possession during matches
    From then to now every football team has its distinctive                     may or may not be a feature of successful EPL teams.
 strategy which is a key for their victory. Such a unique                        Research investigations convey that the home teams tend to
 strategy is ideally preserved within the team. Today’s ad-                      perform a higher number of attacking actions [5] and have
 vanced player tracking systems [1] [2] [3] uses a network                       more ball possession than away teams [11]. When teams are
 of wireless cameras and sensing hardware to capture live                        playing away from home, positive and passionate support
 in-game data and player parameters such as speed, ac-                           from the audience triggers positive momentum and favors
 celeration, distance traveled, etc. from hundreds of data                       the home team [5]. Hence, the pitch location and crowd
 points. Such an advanced tracking system gathers sports                         influence the playing style of the team [5]. But investigations
 data in split-second intervals using which coaches obtain                       also say invariable of the pitch location, higher-ranked
 insights of other league team’s playing styles [4]. Hence, it                   teams have less variation in performance and playing style
 is not possible to preserve all aspects of a team’s strategy                    than lower-ranked teams [12]. Again, since various research
 within the team [5]. Ball pass accuracy, ball presences in                      outcomes contradict each other, more accurate analysis is
 attacking areas, additional passing alternatives, player’s pass                 required to determine whether pitch location influences the
 completion percentage, etc. can be determined from the                          playing styles of EPL teams.
                                                                                   In this work, data fields from the sophisticated raw
   The scripts written to extract data, process data and run experiments are
 provided in: https://github.com/pranavverma12/Analyze-playing-styles-of-        possession-position dataset are extracted using the tech-
 EPL-teams-applying-k-means-on-ball-possession-position-data                     nique discussed in Section. II-B, followed by data pre-

           978-1-7281-5197-7/20/$31.00 ©2020 IEEE                                                                                           58

Authorized licensed use limited to: NATIONAL UNIVERSITY OF IRELAND GALWAY. Downloaded on May 13,2020 at 17:13:08 UTC from IEEE Xplore. Restrictions apply.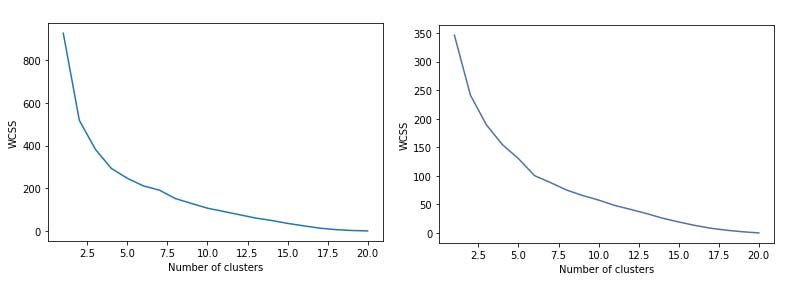
UI*OUFSOBUJPOBM$POGFSFODFPO"EWBODFE$PNQVUJOH$PNNVOJDBUJPO4ZTUFNT *$"$$4

 processing as discussed in Section. II-C to build a trans-                     B. Data extraction
 formed version of the raw dataset named ball possession-                          Initially, the ball possession co-ordinates, its correspond-
 position dataset. This transformed ball possession-position                    ing camera frame number, pitch details and playing team
 dataset is used to perform two experiments. The first                           names are extracted from the raw possession-position
 experiment from Section. IV uses data from 3 areas of                          dataset to build a transformed version of the raw dataset
 the pitch (defense, midfield, and attack) to cluster home                       named ball possession-position dataset. Since these re-
 and away teams with similar playing styles. The second                         quired data fields are inside multiple nested folders, it’s
 experiment from Section. V is conducted using the 9 zones                      required to iterate into multiple folders from the starting
 data which was derived by partitioning the data from 3 areas                   directory to fetch data. The raw dataset size is approximately
 of the pitch. This second experiment is performed using                        8 Gb and the .DAT Files of each match consist of 176,907
 the same k-means clustering technique used in experiment                       rows of data. Combining these rows with other XML and
 1. The aim of both the experiments is to understand and                        CSV’s files multiples the numbers of iterations. Extracting
 analyze the playing styles of teams. The discussions based                     data from such a wast number of rows for 210 matches is
 on analysis brings multiple valuable insights which are                        one of the challenging tasks faced in this work. The com-
 listed along with the experiments in Section IV & V.                           plex structure of the dataset demands high computation
                                                                                resources to perform the extraction in a single run. One
                              II. D ATASET                                      Round (10 matches) of data is extracted at a single time
                                                                                and stored in a separate CSV file. To extract the data of
 A. Dataset structure                                                           our interest, a python script leveraging libraries such as
                                                                                Os, Numpy, Pandas, and concepts from DOM (Document
    The raw possession-position dataset is built by capturing                   Object Model) is written. When this python script is ex-
 data using a state-of-the-art camera and sensor technology                     ecuted, it creates a new CSV file with the required ball
 from all the English Premier League (EPL) games 2017-                          possession-position data for one round of matches. To build
 2018 contains data records of 210 EPL matches played from                      the complete transformed version of the raw dataset, this
 August 2017 to January 2018. This dataset contains separate                    script has to be incrementally iterated 21 times to create
 folders for each round played, which sums up to 2x folders.                    separate CSV files for each round of matches. Each CSV file
 Inside every folder, there are 1x sub-folders with game_id as                  contains approximately 500 Mb of ball possession-position
 their folder names. Finally, inside every game folder, there                   data.
 are 3 different files as listed. The dataset and its source
                                                                                C. Data pre-processing
 cannot be exposed due to its proprietary nature.
                                                                                   The data fields for the new ball possession-position
  (a) Data file: The .DAT file contains the complete data                         dataset (transformed raw possession-position dataset) is ex-
      recorded from before the beginning of the match till                      tracted using the Python script described in Section. II-B. At
      the end. Data was captured and recorded in intervals                      this stage, the ball possession-position dataset contains raw
      of one second by 25 different cameras set up across the                   data fields. These raw data fields have to be processed to get
      stadium. Before the match begins, this camera-based                       converted into fields that can be used for the experiments.
      data collection system can track around 30 people                         A single base CSV file from 21 separate CSV files is created.
      on the pitch in real-time. Once the match starts, the                     This base file contains transformed data fields from all the
      capacity of real-time tracking will be reduced to 24                      210 matches played in 21 rounds. These transformed data
      people (22 players and 2 referees). The main fields in                     fields are, match_id, ball co-ordinates of team A, ball co-
      the .dat file are frame number of the camera, player                       ordinates of team B, names of team A (home teams), names
      details, and ball details. These fields are separated by                   of team B (away teams), zone data for team A, zone data for
      a colon (:).                                                              team B. The zone data columns are newly created. These
  (b) eXtensible Markup Language file: This XML file con-                         columns contain ball possession percentage of the playing
      tains information about the football pitch in terms of                    teams (team A & team B). To calculate the zone data for
      length of the pitch, the height of the pitch, match date,                 these new columns, initially, the pitch where the match was
      match time, game_id, starting & ending frame number                       played is plotted, followed by computing the ball possession
      for the first half, starting & ending frame number for                     count in each zone of the pitch and transforming these
      the second half and finally the tracking area covered                      counts into ball possessions percentage for each zone. At
      by the cameras.                                                           this stage, the data fields of the ball possession-position
  (c) Physical split CSV file: This file contains individual                      dataset are completely transformed and ready to be used
      details of physical activities performed by players dur-                  for experiments.
      ing the match. Total distance, standing distance, high-
      speed running distance, sprinting, jogging count, run-                                            III. M ETHODOLOGY
      ning count and name of the player’s teams are the data                       The k-means algorithm is one of the most used unsuper-
      fields.                                                                    vised learning algorithms to solve the well-known clustering

           978-1-7281-5197-7/20/$31.00 ©2020 IEEE                                                                                           59

Authorized licensed use limited to: NATIONAL UNIVERSITY OF IRELAND GALWAY. Downloaded on May 13,2020 at 17:13:08 UTC from IEEE Xplore. Restrictions apply.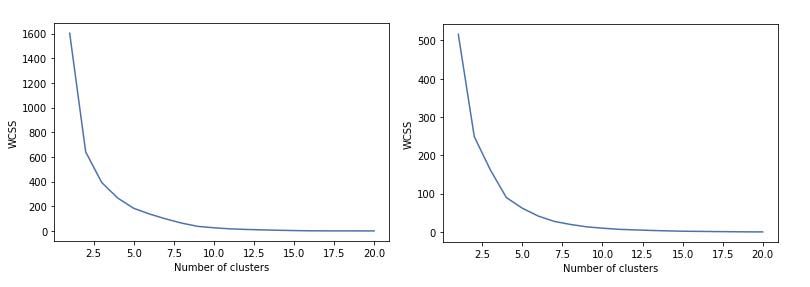
UI*OUFSOBUJPOBM$POGFSFODFPO"EWBODFE$PNQVUJOH$PNNVOJDBUJPO4ZTUFNT *$"$$4
Fig. 2. Elbow curve to find optimal number of clusters for experiment 1
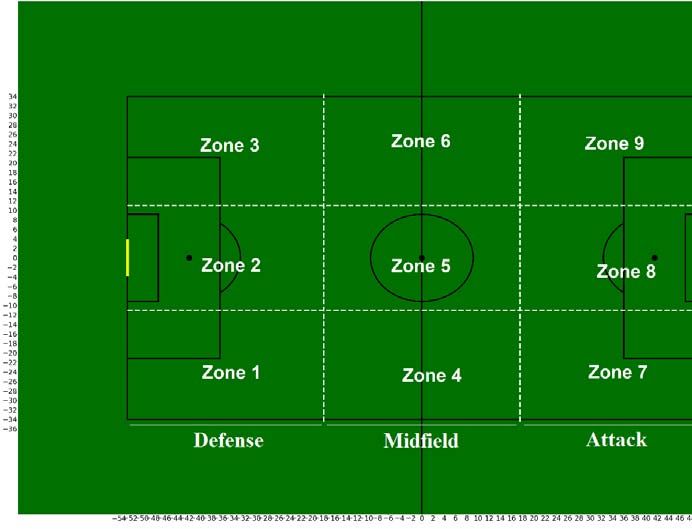
Fig. 1. 9 zones and 3 areas of a pitch
problem. A cluster is collection of data objects that are
homogeneous within one cluster and heterogeneous to
object in other cluster. If we want to group input vectors
into K clusters, K-means can output clusters of w 1 , ....w k
and their corresponding vectors μ1 ....μk such that they
locally minimize the residual sum of squares (RSS) which Fig. 3. Clustered home teams with a similar playing style using data from
3 areas of the pitch
is defined as
K
J= ||x − μk ||2 (1)
k=1 x∈w k experiments are performed based on the ball possession-
In the algorithm, μk is made into the mean of the vectors in position dataset, using k-mans algorithm. The aim of the
a cluster w k . Hence comes the name K-means. This means experiments are to understand and analyze playing styles
that the k-means algorithm tries to optimize the objective of teams. The discussions based on analysis brings multiple
function 1. As there is only a finite number of possible valuable insights which are listed in upcoming sections.
assignments for the amount of centroids and observations
IV. R ESULTS AND D ISCUSSION : E XPERIMENT 1
available and each iteration has to result in better solution,
the algorithm always ends in a local minimum [13]. As shown in Fig. 1, the pitch contains 3 areas which are
In this work, the k-means algorithm is applied to the data further divided into 9 zones. Zones 1-3 forms the defense
fields from the ball possession-position dataset to cluster area; zones 4-6 form the midfield area and zones 7-9 form
teams with a similar playing style. k-means is chosen over the attacking area. The first subpart of this experiment
other algorithms since it is simple to interpret the clustering uses data from 3 areas of the pitch (defense, midfield, and
results, fast and efficient in terms of computational cost attack) to cluster home teams with similar playing styles.
and generalizes to clusters of different shapes and sizes. The second sub-part of this experiment uses the same 3
In K-means, a cluster refers to a collection of data points area data to cluster away teams with a similar playing
aggregated together because of certain similarities [14]. In style. In Fig. 2, the x-axis ranges from 1 to 20 because
this case, a cluster contains a group of teams with a similar a minimum number of the cluster can be one and the
playing style. A centroid is an imaginary or real location maximum number of clusters can be twenty. Values of
representing a center for each of the formed clusters [14]. In Within-Cluster-Sum-of-Squares (WCSS) are on the Y-axis
this case, a centroid is a center point of a cluster containing which defines the reduction in the cost during training.
grouped teams with similar playing styles. The k-means Fig. 2 (left) shows that the curve is bending at point 4
clustering algorithm used in both the experiments identifies (elbow point) for home teams. Similarly, the elbow point is
k number of centroids, and then allocate every team to 4 from Fig. 2 (right) for away teams. These elbow points are
the nearest cluster of teams while keeping the centroids as selected since it achieves reasonable performance without
near as possible. An elbow curve method is used in both the having many or less number of clusters [16].
experiments to assist the selection of the optimal number of
A. Cluster home teams with similar playing style using data
clusters by fitting the model with a range of values for k. Fig.
from 3 areas of the pitch
2 & Fig. 6 are outputs of k-means clustering using the elbow
method. Here, from the curves, a point of inflection repre- The 4 clusters of home teams with a similar playing style
sents an “elbow" of an arm. The optimal number of clusters are shown in Fig. 3 and in Table. I. The discussion based
is the values corresponding to these elbow points [15]. This on obtained results are listed
Elbow method is implemented using WCSS since it is a (a) The top 10 league teams of the EPL season 2017-18 is
technically robust method [16]. In upcoming Sections, two provided at [17]. The team names from cluster 3 are the
978-1-7281-5197-7/20/$31.00 ©2020 IEEE 60
Authorized licensed use limited to: NATIONAL UNIVERSITY OF IRELAND GALWAY. Downloaded on May 13,2020 at 17:13:08 UTC from IEEE Xplore. Restrictions apply.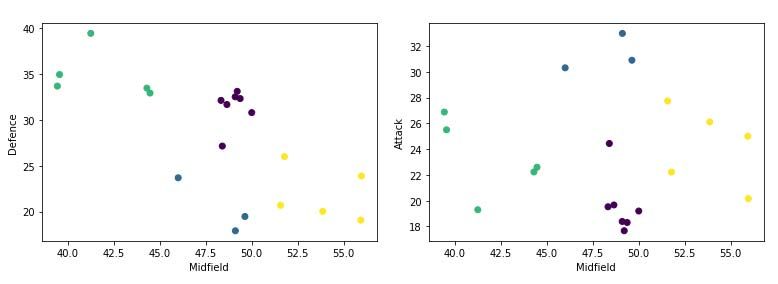
UI*OUFSOBUJPOBM$POGFSFODFPO"EWBODFE$PNQVUJOH$PNNVOJDBUJPO4ZTUFNT *$"$$4

        same as the top 7 teams mentioned in [17]. The match
        of obtained clustering results with the known fact
        strongly supports the exactness of experiment results.
  (b)   From Fig. 3, it can be observed that the teams from
        cluster 3 are more scattered and teams from this cluster
        have more ball possession percentage in the midfield
        area. Also, the teams from cluster 3 have maximum ball
        possessions percentage in the attack area.
  (c)   The teams from cluster 2 are most tightly grouped,
                                                                                Fig. 4. Clustered away teams with a similar playing style using data from
        hence teams from this cluster do not have much                          3 areas of the pitch
        variation in their playing style.
  (d)   Cluster 1 and cluster 0 contains outliers since teams
        are not closely grouped. The reason is that cluster 1                        possession in the defense area as compared to other
        contains teams that are at the 7th position (Wolver-                         cluster teams and their counter-play starts from the de-
        hampton Wanderers), 13th position (Newcastle United)                         fense area. While in home matches their counter-play
        and 16th position (Southampton). Similarly, Cluster 0                        was mostly started from midfield. Likewise, in away
        contains outliers since Tottenham Hotspur and Arsenal                        matches, Tottenham Hotspur and Southampton have
        are from the top 5 places of the ranking table, whereas                      more ball possession percentages in attacking areas.
        Burnley and Fulham are from the bottom of the rank-                          Whereas in home matches, they have more ball pos-
        ing table.                                                                   session percentages in the mid-field area. This brings to
  (e)   According to [9] Arsenal and Burnley are building their                      the conclusion that Everton, Newcastle United, Cardiff
        attacks from the defense area. According to Fig. 3, Arse-                    City, Tottenham Hotspur, and Southampton have dif-
        nal and Burnley have high ball possession percentage                         ferent playing styles in away matches when compared
        in the defense area since these teams are from cluster                       with home matches.
        0. Again, the match of obtained clustering results with                  (b) According to [17], there is not much variation in the
        the known fact strongly supports the exactness of                            game-play of the top 3 teams (Manchester City, Liver-
        experiment results.                                                          pool, and Chelsea) of EPL season 2017-2018. From Fig.
                                                                                     3 & Fig. 4 it can be observed that for the top three
                                 TABLE I                                             teams, the majority of ball possession is in attacking
 The 4 cluster’s of home teams with a similar playing style obtained using           areas of the pitch for both home and away matches.
                       data from 3 areas of the pitch                                Again, the match of obtained clustering results with
          Cluster   Colour                Team names
                                                                                     the known fact strongly supports the exactness of
                                                                                     experiment results
                                  Tottenham Hotspur, Arsenal,
            0       Green       Leicester City, West Ham United,                 (c) In Cluster 1, except for Southampton, other teams
                                    Watford, Burnley, Fulham                         are in the top 4 places of the ranking table. Whereas
                                                                                     Southampton is from the bottom of the table. This
                                  Wolverhampton Wanderers,
            1        Blue                                                            result can bring to an inference that even low ranked
                                Newcastle United, Southampton
                                                                                     teams can have playing style similar to top-ranked
                                  Crystal Palace, Bournemouth,
            2       Violet     Brighton Hove Albion, Cardiff City,
                                                                                     teams
                                       Huddersfield Town                            On the basis of discussions from Section. IV-A and Sec-
                                                                                tion. IV-B, it is concluded that
                              Manchester City, Liverpool, Chelsea,
            3       Yellow                                                       (a) The playing styles of teams (Everton, Newcastle United,
                                 Manchester United, Everton
                                                                                     Cardiff City, Tottenham Hotspur, and Southampton)
                                                                                     change in the away matches when compared with
 B. Cluster away teams with a similar playing style using                            home matches.
 data from 3 areas of the pitch                                                  (b) The playing style of top 3 teams (Manchester City,
                                                                                     Liverpool, and Chelsea) are the same in both home
    The four cluster’s of away teams with a similar playing
                                                                                     and away matches as they have high ball possession
 style are shown in Fig. 4 and Table. II. The discussion based
                                                                                     percentage in the attack area.
 on obtained results are listed
                                                                                 (c) Ball possession data from 3 areas of pitch and game
  (a) From Fig. 4, it can be observed that the teams from                            location (home or away) data is sufficient enough to
      cluster 3 are scattered. It is because this cluster has                        cluster similar teams.
      teams with mixed rankings. Everton is ranked 7th,
      Newcastle United from the middle of the ranking table                              V. R ESULTS AND D ISCUSSION : E XPERIMENT 2
      and Cardiff City at the bottom of the ranking table.                        Clustering of home and away teams using data from
      In away games, these three teams have maximum ball                        3 areas of the pitch was performed in Experiment 1 and

            978-1-7281-5197-7/20/$31.00 ©2020 IEEE                                                                                          61

Authorized licensed use limited to: NATIONAL UNIVERSITY OF IRELAND GALWAY. Downloaded on May 13,2020 at 17:13:08 UTC from IEEE Xplore. Restrictions apply.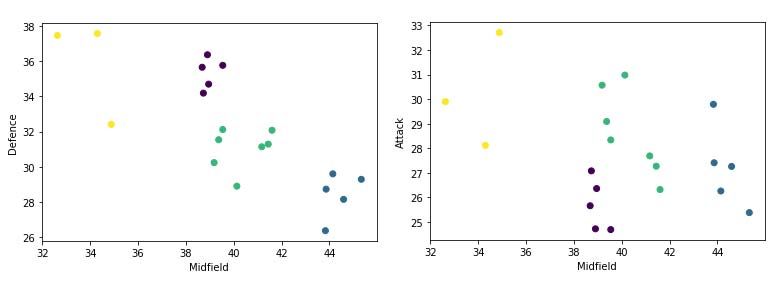
UI*OUFSOBUJPOBM$POGFSFODFPO"EWBODFE$PNQVUJOH$PNNVOJDBUJPO4ZTUFNT *$"$$4

                                 TABLE II
 The 4 cluster’s of away teams with a similar playing style obtained using
                       data from 3 areas of the pitch

          Cluster    Colour               Team names
                               Wolverhampton Wanderers, Crystal
             0       Violet        Palace, Burnley, Fulham,
                                      Huddersfield Town

                                   Manchester City, Liverpool,
             1        Blue        Chelsea, Tottenham Hotspur,
                                         Southampton
                                                                                Fig. 6. Clustered home teams with a similar playing style using data from
                                                                                9 zones of the pitch
                                  Arsenal, Manchester United,
                                      Leicester City, West
             2       Green           Ham United, Watford,
                                  Bournemouth, Brighton and                     overlapping with Tottenham Hotspur, followed by Chelsea
                                          Hove Albion
                                                                                with Westham United and Watford with Newcastle United.
                                   Everton, Newcastle United,                   Due to this overlap, the discussion cannot be made based
             3       Yellow
                                          Cardiff City                          on the scattered plot. Rather the discussion is made based
                                                                                on the Table. IV.

                                                                                                               TABLE III
                                                                                The 4 cluster’s of home teams with similar playing style obtained using 9
                                                                                                         zones data of the pitch

                                                                                        Cluster    Colour               Team names
                                                                                           0       Violet    Manchester City, Liverpool, Chelsea

                                                                                                                Tottenham Hotspur, Arsenal,
                                                                                                                Manchester United, Leicester
                                                                                           1        Blue          City, West Ham United,
                                                                                                                  Watford, Crystal Palace,
 Fig. 5. Elbow curve to find optimal number of clusters for Experiment 2                                               Burnley, Fulham

                                                                                                                 Wolverhampton Wanderers,
                                                                                           2       Green         Everton, Newcastle United,
 basic insights were obtained based on the results. Deeper                                                             Southampton
 analytics to obtain additional insights on playing styles of
 teams, weak & strong areas of the team, etc could not be                                                        Bournemouth, Brighton and
                                                                                           3       Yellow         Hove Albion, Cardiff City,
 obtained from the results of Experiment 1. Hence, there is a                                                        Huddersfield Town
 need to conduct another experiment using the 9 zones data
 which was derived by partitioning the data from 3 areas of
 the pitch. This second experiment is performed using the
 same k-means clustering technique used in experiment 1.                        B. Cluster away teams with a similar playing style using data
 The first sub-part of this experiment uses data from 9 zones                    from 9 zones of the pitch
 of the pitch to cluster home teams with a similar playing                        For the guest/away team, the pitch division starts from
 style. The second subpart performs the same clustering,                        the right bottom corner. The four clusters of away teams
 using the same 9 zone data but for away teams. The elbow                       with similar playing styles are shown in Table. V. A scatter
 curves to find the optimal number of clusters were plotted                      plot is not used due to the reason discussed in Section. V-A.
 using data from 9 zones of the pitch. From Fig. 5, the elbow                   Rather the discussion is made based on the Table. VI
 point for both the home and away team was found to be
 4.                                                                             C. Discussion
                                                                                  Based on clustering results and tabulations from Section.
 A. Cluster home teams with a similar playing style using                       V-A and Section. V-B, the listed insights are obtained
 data from 9 zones of the pitch                                                  (a) All the teams from Cluster 3 of Table. III is from the
    For the host/home team, the pitch is divided into zones                          bottom of the official ranking table [17]. Bournemouth
 starting from the left bottom corner as shown in Fig.                               (13th place), Brighton & Hove Albion (16th place),
 1. Clustering was performed and the result containing 4                             Cardiff City (17th place) and Huddersfield at the last
 clusters of home teams with similar playing style are shown                         place. From Table. IV it can be derived that these low
 in Table. III and a part of the resulting scatter plot is shown                     ranked teams have more ball possession at the central
 in Fig. 6. From this scatter plot it can be observed that only                      back (also known as a central defender or center-half)
 17 teams out of 20 teams are visible. Huddersfield Town is                           than at the full-backs (the left-back and the right-back).

           978-1-7281-5197-7/20/$31.00 ©2020 IEEE                                                                                           62

Authorized licensed use limited to: NATIONAL UNIVERSITY OF IRELAND GALWAY. Downloaded on May 13,2020 at 17:13:08 UTC from IEEE Xplore. Restrictions apply.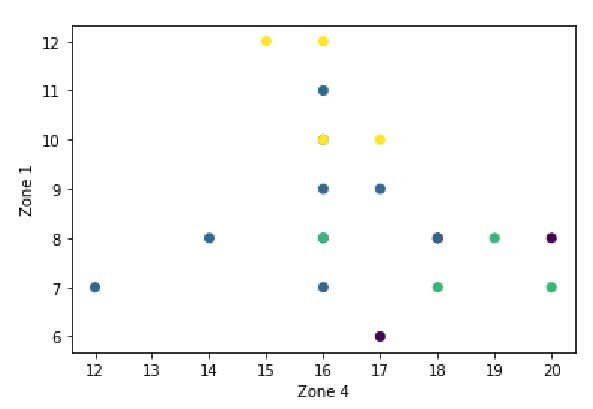
UI*OUFSOBUJPOBM$POGFSFODFPO"EWBODFE$PNQVUJOH$PNNVOJDBUJPO4ZTUFNT *$"$$4

                                TABLE IV                                                                       TABLE VI
   Home teams: Ball possession percentage in each of the 9 zones of the           Away teams: Ball possession percentage in each of the 9 zones of the
                                  pitch                                                                          pitch

        Teams            z1    z2    z3    z4    z5    z6   z7       z8   z9           Teams         z1    z2    z3    z4    z5    z6   z7    z8    z9
      Manchester                                                                    Manchester
                         6     8     5     17    19   21     8       7    10                          8    11     8    15    14    15    8    12     9
         City                                                                          City
       Liverpool         8     9     7     20    16   20     7        7   6          Liverpool        8    13     9    15    13    16    8    12     7
        Chelsae          8     5     7     18    19   18     7       10   8           Chelsea         7    12     8    14    16    14    9    12     7
      Tottenham                                                                      Tottenham
                         10    12    9     16    15   18     6       6    7                           9    12     9    15    15    15    6    11     8
       Hotspur                                                                        Hotspur
        Arsenal          11    13    9     16    14   19     6       5    7           Arsenal         9    15     8    14    14    14    7    12     7
      Manchester                                                                    Manchester
                         7     11    8     16    16   20     6       7    10                          7    15     9    13    15    14    7    12     8
       United                                                                        United

    Wolverhampton                                                                 Wolverhampton
                         7     5     6     18    14   17     8       16   8                           8    18    10    13    13    13    6    12     7
      Wanderers                                                                     Wanderers
        Everton          7      5    8     20    14   18     9       11   8           Everton         9    14     9    12    11    12    8    16     9
     Leicester City      9     13    9     16    14   18     6        7   7        Leicester City     7    13     9    13    12    15    9    14     8
      West Ham                                                                       West Ham
                         8     12    7     18    14   16     8       9    8                           7    14     9    13    12    14    6    16     8
       United                                                                         United
        Watford          8     12    12    16    15   18     6       6    6           Watford         9    15     8    14    13    13    8    13     8
     Crystal Palace      7     15    11    12    11   21     7       6    9        Crystal Palace     8    18     9    14    13    11    7    12     7
       Newcastle                                                                     Newcastle
                         8     7     8     16    14   16     8       13   9                           9    17    11    12    10    11   10    12     6
        United                                                                        United
     Bournemouth         10    13    10    17    13   15     8        8    6       Bournemouth        8    15     9    14    14    13    7    13     8
       Burnley            8    15     8    14    15   21     7        7    5         Burnley         10    16     9    13    12    14    6    14     7
     Southampton          8     6     6    19    14   17     8       12   10       Southampton        8    15     7    16    14    14    8    12     7
     Brighton and                                                                  Brighton and
                         12    17    11    15    11   15     7       6    6                           9    13     9    12    10    18    8    12     8
     Hove Albion                                                                   Hove Albion
      Cardiff City       12    15    8     16    12   11     8       9    9         Cardiff City     10    16    11    12     9    12    8    13     8
       Fulham             9    15    8     17    16   16     6       7    6          Fulham           9    19     8    12    12    15    8    12     6
     Huddersfield                                                                    Huddersfield
                         10    14    9     16    10   13    10       10   7                           8    17    10    12    13    15    6    11     8
        Town                                                                           Town

                                 TABLE V
  The 4 cluster’s of away teams with similar playing style obtained using           mid-wings (right and left wings of the mid area) is more
                       data from 9 zones of the pitch                               than that at the central midfield.
         Cluster      Colour                Team names
                                                                                    From Table. IV it is clear that Crystal Palace from
                                                                                    Cluster 1 of Table. III uses its left-midfield wing area
                                   Arsenal, Manchester United,
                                      Everton, Leicester City,                      more when compare to other midfield areas. Likewise,
            0         Violet
                                   West Ham United, Watford,                        other teams in this Cluster such as Leicester City and
                               Bournemouth, Burnley, Southampton                    Burnley also have higher ball possession in the left-
            1          Blue         Newcastle United, Cardiff City                  midfield wing area.
                                                                                (c) Cluster 0 from Table. III represents the top 3 teams of
                                     Manchester City, Liverpool,
            2         Green         Chelsea, Tottenham Hotspur,
                                                                                    the league (Manchester City, Liverpool, and Chelsea).
                                     Brighton and Hove Albion                       From Table. IV, Man City and Liverpool use the wing
                                                                                    areas of the pitch to build and strengthen their attacks.
                                     Wolverhampton Wanderers,
            3         Yellow          Crystal Palace, Fulham,                       In contrast, Chelsea uses the center of the pitch to
                                         Huddersfield Town                           build and strengthen their attacks.
                                                                                (d) From Table. VI, it can be observed that tactics of the
                                                                                    top 4 teams in Cluster 2 of Table. IV has been changed
                                                                                    in away matches. The central-attacking zone (Zone 8)
  (b) Cluster 2 from Table. III contains 2 teams from the top                       of the pitch has more ball possession in away matches.
      7 ranks (Everton & ’Wolverhampton Wanderers) and                              Whereas in home matches, the wings of the attack area
      2 teams (Newcastle United & Southampton) from the                             have more ball possession.
      middle of the official league ranking table [17]. For all                  (e) Cluster 1 from Table. IV contains 2 teams (Newcastle
      these four teams, ball possession percentage in their                         United and Cardiff City). Table. VI shows, the ball

           978-1-7281-5197-7/20/$31.00 ©2020 IEEE                                                                                            63

Authorized licensed use limited to: NATIONAL UNIVERSITY OF IRELAND GALWAY. Downloaded on May 13,2020 at 17:13:08 UTC from IEEE Xplore. Restrictions apply.
UI*OUFSOBUJPOBM$POGFSFODFPO"EWBODFE$PNQVUJOH$PNNVOJDBUJPO4ZTUFNT *$"$$4
possession of these two teams in defense zones (Zone [3] L. Tedesco, “Sports tracking – chyronhego,” 2018. [Online]. Available:
1 to Zone 3) is almost similar. https://chyronhego.com/products/sports-tracking/
[4] H. Sarmento, A. Pereira, N. Matos, J. Campaniço, T. M. Anguera, and
When comparing the discussions from Section. IV-A and J. Leitão, “English premier league, spaińs la liga and italýs seriés a
Section. IV-B of Experiment 1 with the discussion from – what’s different?” International Journal of Performance Analysis in
Sport, vol. 13, pp. 773–789, 12 2013.
Section. V-C of Experiment 2. All the points from discus- [5] A. J. Redwood-Brown, P. G. O’Donoghue, A. M. Nevill, C. Saward, and
sions based on Experiment 2 provide information conveying C. Sunderland, “Effects of playing position, pitch location, opposition
which particular zones from the three areas of the pitch are ability and team ability on the technical performance of elite soccer
players in different score line states,” PLOS ONE, vol. 14, p. e0211707,
more used by teams, rather than saying teams had more 02 2019.
ball possession in the defense area. It can be concluded that [6] “Keep the ball! the value of ball possession in soccer,”
using data from 9 zones to perform clustering provides more 2010. [Online]. Available: https://warwick.ac.uk/fac/cross_fac/iatl/
reinvention/archive/volume6issue1/parzialeandyates
insightful discussions in terms of playing styles of teams, [7] D. Adams, R. Morgans, J. Sacramento, S. Morgan, and M. D. Williams,
weak & strong areas of the team. “Successful short passing frequency of defenders differentiates be-
tween top and bottom four english premier league teams,” Interna-
VI. C ONCLUSION tional Journal of Performance Analysis in Sport, vol. 13, pp. 653–668,
12 2013.
Two experiments were run based on the transformed [8] L. Gyarmati, H. Kwak, and P. Rodriguez, “Searching for a unique style
dataset and discussions based on the experimental results in soccer,” 2014. [Online]. Available: https://arxiv.org/abs/1409.0308
provided a solid understanding of playing styles of teams. [9] “Espn,” 10 2018. [Online]. Available: https://www.espn.com/soccer/
english-premier-league/23/blog/post/3647791/premier-league-style-
The outcomes of the discussions bring multiple valuable of-play-rankings-put-manchester-united-in-the-danger-zone
insights. Firstly, the playing style of top 3 teams (Manchester [10] “r/soccer - can anyone describe each epl team’s playing style?” 2011.
City, Liverpool, and Chelsea) are the same in both home [Online]. Available: https://www.reddit.com/r/soccer/comments/
rqaul/can_anyone_describe_each_epl_teams_playing_style/
and away matches and they have high ball possession [11] C. Lago and R. Martín, “Determinants of possession of the ball in
percentage in the attack area than in other areas. Next, the soccer,” Journal of Sports Sciences, vol. 25, pp. 969–974, 07 2007.
ball possession data from 3 areas of pitch and game location [12] C. Lago-Peñas and A. Dellal, “Ball possession strategies in elite soccer
according to the evolution of the match-score: the influence of
(home or away) data is sufficient enough to cluster similar situational variables,” Journal of Human Kinetics, vol. 25, pp. 93–100,
teams. Next, when clustering is performed using data from 09 2010.
9 zones of the pitch, more insightful discussions in terms [13] J. MacQueen, “Some methods for classification and analysis of
multivariate observations,” in Proceedings of the Fifth Berkeley
of playing styles, weak & strong areas of the teams are Symposium on Mathematical Statistics and Probability, Volume 1:
obtained. Finally, the analysis favors the known fact that Statistics. Berkeley, Calif.: University of California Press, 1967, pp.
away match conditions affect the playing style of a few 281–297. [Online]. Available: https://projecteuclid.org/euclid.bsmsp/
1200512992
teams as their tactics differ from home and away matches. [14] M. J, “Understanding k-means clustering in
To conclude, using just the ball possession position data, machine learning,” 09 2018. [Online]. Avail-
the playing styles of teams were able to be derived. This able: https://towardsdatascience.com/understanding-k-means-
clustering-in-machine-learning-6a6e67336aa1
reduces the usage of multiple parameters such as goal [15] “Elbow method — yellowbrick 0.9.1 documentation,” 2016. [Online].
scoring patterns, player performances, team performance, Available: https://www.scikit-yb.org/en/latest/api/cluster/elbow.html
etc. to perform the same task, which is to understand and [16] “Edupristine,” 11 2018. [Online]. Available: https://www.edupristine.
com/blog/beyond-k-means
analyse playing styles of teams. [17] NDTVSports.com, “English premier league 2018-19 - table and
standings | ndtvsports.com,” 2018. [Online]. Available: https://sports.
VII. FUTURE DIRECTIONS ndtv.com/english-premier-league/epl-table/2018-19
Few more data fields from the raw dataset are planned
to be used. Future work concerns to use these new data
fields as input for the same k-means clustering algorithm
to plot the scatter chart from which deeper analysis could
be performed to understand how ball possession influences
the match results. In the current study, the pitch was divided
into 9 zones of equal size. In the future, the zones from left-
wing can be grouped covering 40% of the pitch. Likewise,
the zones from right-wing can be grouped covering another
40% of the pitch. The remaining 20 % from the zones in
the central part of the pitch. The same experiments could
be run based on the ball possession from the new pitch
divisions.
R EFERENCES
[1] “Optical player tracking | player tracking system | stats,” 2019.
[Online]. Available: https://www.stats.com/player-tracking/
[2] “Electronic performance tracking systems,” 2015. [Online]. Available:
https://football-technology.fifa.com/en/media-tiles/epts-1/
978-1-7281-5197-7/20/$31.00 ©2020 IEEE 64
Authorized licensed use limited to: NATIONAL UNIVERSITY OF IRELAND GALWAY. Downloaded on May 13,2020 at 17:13:08 UTC from IEEE Xplore. Restrictions apply.You can also read


