Rotorua Evidence Brief - Initial Assessment - Rotorua Lakes Council

Page created by Mary Norman
 
CONTINUE READING
Rotorua Evidence Brief - Initial Assessment - Rotorua Lakes Council
Rotorua Evidence Brief
        Initial Assessment
Rotorua Evidence Brief - Initial Assessment - Rotorua Lakes Council
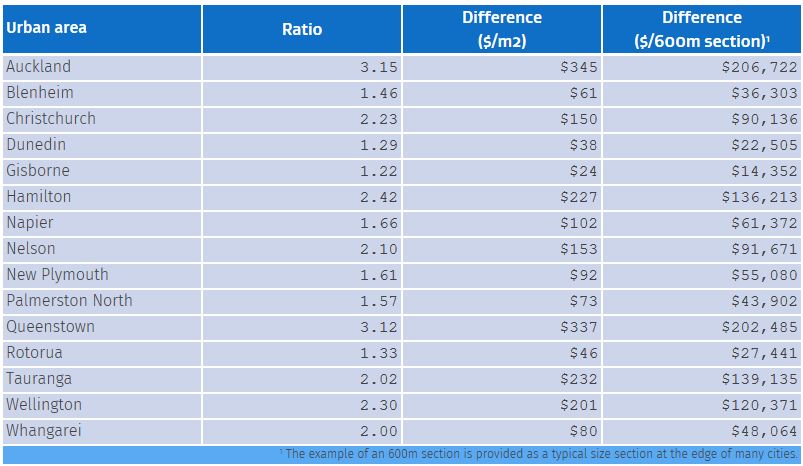
Emerging picture for Rotorua
• Demand for housing has been driven by population and income growth
• But development has been unresponsive to both population and significant increases in house prices.
• More homes were consented in the early 2000s when population was not growing (but prices were
  increasing).
• Rents have grown strongly since around 2015, coinciding with population growth and lack of
  development.
• House sale volumes increased sharply in 2016 across all buyer types, potentially reflecting relative
  affordability compared to the rest of the country. Volumes fell back to long term trend following
  increase in prices.
• Purchase affordability has worsened although higher prices have been offset by lower interest rates.
  Purchase affordability remains good compared to other parts of the country
• Rental affordability has worsened across the board, but more so for low income households. But the
  proportion of households paying rents that are “affordable” to them is unchanged.
• But rental affordability for lower income households has worsened significantly. Higher rents and a
  shortage of rentals at lower end of market appears to be a key driver of housing stress.
Population Growth and employment growth has been strong
•   Usually resident population increased by 6597, to 71,887 (Census
    2018). Census night population 75,915.
•   Treasury analysis of population data shows a range of drivers [still
    awaiting 2017].
       • Significantly fewer people are leaving Rotorua to move
           overseas
       • More New Zealanders returning from overseas are settling in
           Rotorua
       • More New Zealanders moving to Rotorua from the rest of
           New Zealand
       • Significant net outflow of Māori from Rotorua to overseas
           reversed (between 2013 and 2016 as many returned as left)
       • More international migrants settling in Rotorua. Increases
           across international students, residence visas and temporary
           workers
•   Data provided by MBIE indicates the number of people in
    employment increased by 3600 between 2013 and 2018.
       • Around 60% of the increase is made up by more Citizens
       • A further 20% of the increase reflects a higher number of
           employees holding resident visas or are recent residents, or
           on Essential Skills visas. Their income is 10-15% higher than
           NZ citizens
       • The remainder reflects an increase in students, working
           holiday and other visas holders.
Household income growth has been strong
      across the region, but varied.
Limited information is available on income at a territorial authority
level.
Also sources on individual earned income at a regional level don’t
                                                                         Actual income growth between 2014 and
tell us about household income or incomes of those not in work           2018 – in dollar and percentage terms
which are both relevant to affordability of housing costs.
The Housing Affordability Measure does provide an indication of                                       Renters            All Households
household income for Rotorua District by using unit record data of
household income and housing costs. Information on income               80th percentile      $18,225             21%   $15,968      14%
indicates:
• median incomes up 17% for all households and 26% for renters
  from 2014 to 2018                                                     60th Percentile      $14,513             25%   $11,548      16%

• income growth for lower income households was lower - 20th
  percentile income for renting households up only 18.5%                40th Percentile      $10,354             26%   $8,283       18%
• Actual changes in income vary significantly by income.
Household income can also be affected by household composition.         20th Percentile      $4,725              18%   $4,813       17%
Limited access to and affordability of housing may increase people
per household and also household income. So for some households
                                                                         Source: Housing affordability measure
increasing income may be due to crowding, reflecting worsening
rather than improving outcomes
But limited growth in the housing stock
• Census shows an increase in dwellings of 1017 between 2013 and 2018                                                  Annual Building Consents - New builds
                                                                                                    400
• To maintain occupancy rate between census would have required a further                           350
  1500-1750 homes be built across the district                                                      300

• Building Consents show a significant fall across all types of housing since the                   250
                                                                                                    200
  Global Financial Crisis – averaging 130 a year since 2008
                                                                                                    150
• For the 15 years prior to the GFC consents were higher – between 200-300 a                        100
  year - despite no population growth                                                               50
                                                                                                      0
• If consents had maintained pre-GFC levels there would be no shortfall.

                                                                                                          1991
                                                                                                          1992
                                                                                                          1993
                                                                                                          1994
                                                                                                          1995
                                                                                                          1996
                                                                                                          1997
                                                                                                          1998
                                                                                                          1999
                                                                                                          2000
                                                                                                          2001
                                                                                                          2002
                                                                                                          2003
                                                                                                          2004
                                                                                                          2005
                                                                                                          2006
                                                                                                          2007
                                                                                                          2008
                                                                                                          2009
                                                                                                          2010
                                                                                                          2011
                                                                                                          2012
                                                                                                          2013
                                                                                                          2014
                                                                                                          2015
                                                                                                          2016
                                                                                                          2017
                                                                                                          2018
                                                                                                          2019
                                                                                                                       Houses      Apartments, townhouses, units, and other dwellings
Difficulty with projecting a “shortfall” of homes                                                   Source: Stats NZ

Any measure of a shortfall should be indicative only. This depends on assumptions of what the
“steady state” occupancy rate might be and how homes are used.                                                 Annual Building Consents attached dwellings
                                                                                                    100
•    Changing demographic would suggest occupancy rates should fall.
                                                                                                     90
•    But areas with younger populations would have relatively higher occupancy rates                 80
•    Some areas like Queenstown have seen stock increase in line with population suggesting no       70
     shortfall. However some new homes are second homes and not available to locals to live in.      60
•    Increase in the cost of housing – i.e. rents may lead to larger households to share costs       50
•    District level analysis can mask differences across the population as occupancy rates for       40
     rented home are likely to have faster than owner occupiers.                                     30
                                                                                                     20
                                                                                                     10
Any measure is highly sensitive to start dates. If measured from 2006 census there would be no        0
in Rotorua shortfall as occupancy rates across the district are similar to 2018. The recent sharp

                                                                                                          1991
                                                                                                          1992
                                                                                                          1993
                                                                                                          1994
                                                                                                          1995
                                                                                                          1996
                                                                                                          1997
                                                                                                          1998
                                                                                                          1999
                                                                                                          2000
                                                                                                          2001
                                                                                                          2002
                                                                                                          2003
                                                                                                          2004
                                                                                                          2005
                                                                                                          2006
                                                                                                          2007
                                                                                                          2008
                                                                                                          2009
                                                                                                          2010
                                                                                                          2011
                                                                                                          2012
                                                                                                          2013
                                                                                                          2014
                                                                                                          2015
                                                                                                          2016
                                                                                                          2017
                                                                                                          2018
                                                                                                          2019
increase in rents would tell a different picture.
                                                                                                          Apartments      Retirement village units   Townhouses, flats, units, and other dwellings
* The number of building consents don’t seem to match the change in dwellings between census
                                                                                                    Source: Stats NZ
Value of consents and cost of construction
     have increased too                                                                            2,500
                                                                                                                    Rotorua: Cost per square metre - house

The costs of construction have increased significantly over time as has the value of consents.
                                                                                                   2,000
•   Cost per square metre for standalone homes in Rotorua has increased by 33% since 2014
    and 246% since 1991.                                                                           1,500

•   The value of consents has also moved broadly line with average house prices.                   1,000

Unclear the extent that increasing build costs reflect increasing quality demanded by buyers of
                                                                                                     500
new build homes. Homes have been getting smaller with average size of home consented
falling to 180m2 in the last two years, compared to an average of 201m2 in the decade prior.
                                                                                                       0
Again unclear whether buyers are trading off quantity of house for quality.                                 1991 1993 1995 1997 1999 2001 2003 2005 2007 2009 2011 2013 2015 2017 2019

Value of consent does not take account cost of land, development costs and other levies.           Source: Stats NZ
                                                                                                                        Rotorua: Consent value - House
What we can say is that the cost of new builds remain expensive relative to existing homes
                                                                                                  450,000
                                                                                                  400,000
Number of dwelling alternations has also grown. In the last decade the average number of
                                                                                                  350,000
alterations excluding outbuildings has been 330 compared with 140 the decade prior. This
                                                                                                  300,000
could reflect the higher cost of construction and owners choosing to renovate rather than
                                                                                                  250,000
build. It could also reflect improved quality of existing homes.
                                                                                                  200,000
                                                                                                  150,000
Work underway in next two weeks to provide data on the price of new build homes based on
code of compliance and district valuation roll data provided by RLC                               100,000
                                                                                                   50,000
                                                                                                        0
                                                                                                            1991 1993 1995 1997 1999 2001 2003 2005 2007 2009 2011 2013 2015 2017 2019
                                                                                                   Source: Stats NZ
Housing costs have increased sharply as more people
chase limited housing                                                                                                                                                                                                                                                             2000                         2014
                                                                                                                                                                                                                                                                                                                                        % change
                                                                                                                                                                                                                                                                                                                                                                           2019
                                                                                                                                                                                                                                                                                                                                                                                                % change
                                                                                                                                                                                                                                                                                                                                         00-14                                                   14-19
Both house prices and rents have increased significantly over time going through similar cycles.
However in the last 5 years:
                                                                                                                                                                                                                                             Median Rent                           156                             248                         59%                         373                         51%
•     The increase in rents has been particularly strong increasing by almost as much in the preceding
      14 years.
•     Rent growth has almost matched house price growth, whereas between 2003 and 2007 house                                                                                                                                                 Lower
      prices increased significantly faster than rents.                                                                                                                                                                                                                            129                             203                         58%                         308                         52%
                                                                                                                                                                                                                                             Quartile rent
Recent rent growth is consistent with population growth exceeding construction. This suggests the
dominant driver of house prices and rents has been an underlying shortfall in accommodation.                                                                                                                                                 Median
                                                                                                                                                                                                                                                                                138513                      263500                             90%                    428750                           63%
                                                                                                                                                                                                                                             House Price
Between 2003 and 2007 the more moderate rent growth suggests that house prices were driven
more by interest rates and access to credit affecting the value of housing as an asset and not an
underlying shortage of accommodation.
                                                                                                                                                                                                                                                       Relative growth in rents and house prices - this time it
                                                                                                                                                                                                                                                                            is different.
                           Monthly mean geometric rent                                                                  Quarterly median house price
                                                                                                                                                                                                                                                    1800
450                                                                                                            500000
400                                                                                                                                                                                                                                                 1600
                                                                                                               450000

                                                                                                                                                                                                                          Index (1 Jan 2014 1000)
350                                                                                                            400000                                                                                                                               1400
300                                                                                                            350000                                                                                                                               1200
250                                                                                                            300000
                                                                                                                                                                                                                                                    1000
200                                                                                                            250000
                                                                                                               200000                                                                                                                               800
150
                                                                                                               150000                                                                                                                               600
100
                                                                                                               100000
 50                                                                                                                                                                                                                                                 400
                                                                                                                50000
  0                                                                                                                 0                                                                                                                               200
      1993
             1994
                    1996
                           1998
                                  2000
                                         2002
                                                2004
                                                       2005
                                                              2007
                                                                     2009
                                                                            2011
                                                                                   2013
                                                                                          2015
                                                                                                 2016
                                                                                                        2018

                                                                                                                        1993
                                                                                                                               1995
                                                                                                                                      1997
                                                                                                                                             1998
                                                                                                                                                    2000
                                                                                                                                                           2002
                                                                                                                                                                  2004
                                                                                                                                                                         2006
                                                                                                                                                                                2008
                                                                                                                                                                                       2010
                                                                                                                                                                                              2012
                                                                                                                                                                                                     2014
                                                                                                                                                                                                            2016
                                                                                                                                                                                                                   2018
                                                                                                                                                                                                                                                      0

                                                                                                                                                                                                                                                           1993
                                                                                                                                                                                                                                                                  1994
                                                                                                                                                                                                                                                                         1995
                                                                                                                                                                                                                                                                                1996
                                                                                                                                                                                                                                                                                       1997
                                                                                                                                                                                                                                                                                              1999
                                                                                                                                                                                                                                                                                                     2000
                                                                                                                                                                                                                                                                                                            2001
                                                                                                                                                                                                                                                                                                                   2002
                                                                                                                                                                                                                                                                                                                          2003
                                                                                                                                                                                                                                                                                                                                 2004
                                                                                                                                                                                                                                                                                                                                        2006
                                                                                                                                                                                                                                                                                                                                               2007
                                                                                                                                                                                                                                                                                                                                                      2008
                                                                                                                                                                                                                                                                                                                                                             2009
                                                                                                                                                                                                                                                                                                                                                                    2010
                                                                                                                                                                                                                                                                                                                                                                           2011
                                                                                                                                                                                                                                                                                                                                                                                  2013
                                                                                                                                                                                                                                                                                                                                                                                         2014
                                                                                                                                                                                                                                                                                                                                                                                                2015
                                                                                                                                                                                                                                                                                                                                                                                                       2016
                                                                                                                                                                                                                                                                                                                                                                                                              2017
                                                                                                                                                                                                                                                                                                                                                                                                                     2018
Source: MBIE Bond data
                                                                                                               Source: NPS – UDC Dashboard                                                                                                                                                           Median Sales Price                               Mean Rent
But with significant variation across the city*
                                                                            Census
 The change in rents and prices has not been                                Night      People per Home     Share public   Poportion   Med Rent 5 year LQ rent 5 Year Med Price   5 year
 uniform across the city with no obvious                                    Population household Ownership Housing        Maori       2019     change 2019    change 2019        change
 pattern.
 Some key take-outs include:                             Rotorua District     75915       3.03       62%         3%          40%         375     48%    308     52%    428750      63%

 • Rent growth does not appear to be                     Fordlands             2397       3.32       42%        19%          68%         341     66%    305     80%    210250      92%
   linked to home ownership, the
   proportion of public housing or                       Lynmore               3240       2.75       81%         0%          17%         478     39%    392     39%    682625      65%
   proportion of Maori
 • Some areas do stand out like Fordlands                Owhata East           3021       2.99       72%         1%          43%         382     44%    331     59%    406215      63%
   with high occupancy rates, high rent
   growth particularly at the lower quartile,            Owhata West           3093       3.06       65%         1%          49%         384     60%    328     65%    364375      63%
   low ownership and a high proportion of                Pukehangi
   Maori                                                 North                 2664       3.25       47%        12%          60%         364     41%    342     48%    364125     111%

 • Owhata West and Pleasant Heights have                 Pukehangi
                                                         South                 2559       2.73       76%         1%          29%         380     33%    332     36%    441438      37%
   large increases in rents with low rates of
   home ownership.
                                                         Selwyn Heights        1119       3.22       53%         5%          58%         387     45%    303     25%    369333      91%
 • Western Heights has a very high rate of
   homeownership and the strongest                       Utuhina               1464       2.80       60%         1%          37%         379     42%    354     55%    433500     100%
   increase in prices.
                                                         Victoria              2421       2.71       28%         2%          27%         289     42%    252     47%    386563      87%
 These patterns will be better informed by
 local information.                                      Western
                                                         Heights               999        2.87       84%         0%          30%         371     57%    336     65%    349813     140%

                                                        Source: Stats NZ Census 2018, MBIE Bond, NPS-UDC dashboard

* The table shows summary information for different suburbs. Different boundaries across census, MBIE Bond data and house price data mean the list is not exhaustive and includes
those that are consistent across data sources.
Who is buying homes
        Sales volumes increased sharply from September 2015 to over 500 sales a quarter,
                                                                                                                                                                                  Sales volumes and rate of growth (12 mth average)
        compared to an average of 300 sales a quarter over the prior 4 years.
                                                                                                                                                            700                                                                                                                                                                                   30%
        This increase in volumes pushed prices up sharply with the volume of sales then                                                                     600                                                                                                                                                                                   25%
        falling back to around 350 a quarter.
                                                                                                                                                            500                                                                                                                                                                                   20%
        •     Suggests surge in demand affected by relative affordability of homes in Rotorua                                                               400                                                                                                                                                                                   15%
              compared to the rest of the country.                                                                                                          300                                                                                                                                                                                   10%

        •     This surge in sales is consistent with the “Auckland Ripple” effect. People selling                                                           200                                                                                                                                                                                   5%
              up in one market and then purchasing in Rotorua made a small contribution to                                                                  100                                                                                                                                                                                   0%
              the spike in sales (around 30 per quarter)                                                                                                       0                                                                                                                                                                                  -5%

                                                                                                                                                                   1994
                                                                                                                                                                          1995
                                                                                                                                                                                 1996
                                                                                                                                                                                        1997
                                                                                                                                                                                               1998
                                                                                                                                                                                                      1999
                                                                                                                                                                                                             2000
                                                                                                                                                                                                                    2001
                                                                                                                                                                                                                           2002
                                                                                                                                                                                                                                  2003
                                                                                                                                                                                                                                         2004
                                                                                                                                                                                                                                                2005
                                                                                                                                                                                                                                                       2006
                                                                                                                                                                                                                                                              2007
                                                                                                                                                                                                                                                                     2008
                                                                                                                                                                                                                                                                            2009
                                                                                                                                                                                                                                                                                   2010
                                                                                                                                                                                                                                                                                          2011
                                                                                                                                                                                                                                                                                                 2012
                                                                                                                                                                                                                                                                                                        2013
                                                                                                                                                                                                                                                                                                               2014
                                                                                                                                                                                                                                                                                                                      2015
                                                                                                                                                                                                                                                                                                                             2016
                                                                                                                                                                                                                                                                                                                                    2017
                                                                                                                                                                                                                                                                                                                                           2018
        •     Although the number of sales increased sharply the proportion of homes bought
              by different types of buyers was largely unchanged suggesting investors (multiple                                                                                                                            Sales per quarter                                Rate of growth
              property owners), first home buyers and those buying and selling within the
              market (movers) all increased purchases at the same time.
                                                                                                                                                                                                                                  Buyer Classification
        •     A summary of what makes up each buyer category is set out in the annex.                                                                       60.00%

                                                                                                                                                            50.00%
         The First Home Buyer share has been trending up despite increases in prices
                                                                                                                                                            40.00%

         First home buyers are currently buying at lower prices compared to rest of market.                                                                 30.00%

         • In 2019 the average price paid by a First home buyer was $380,000 and lower                                                                      20.00%
              quartile price was $326,000                                                                                                                   10.00%
         • Those using First Home Grant – subject to income and price limits - are buying
                                                                                                                                                              0.00%
              at average of $311,000 with an average household income of $69,000 (which is                                                                            2005 2006 2007 2008 2009 2010 2011 2012 2013 2014 2015 2016 2017 2018 2019
              110% of the median household income for renters)
         • First Home Buyers using the First Home grant make up around 60% of FHB                                                                                            First Home Buyers                                            Mover                                                         Multiple Property Owners
                                                                                                                                                                             New to Market                                                Other                                                         ReEntry
* To be eligible for the first home grant in Rotorua a buyer must have contributed to KiwiSaver for a minimum period, must be purchasing an existing home worth less than 400k (500k for new build) and have household income below 130k (85k for individual)
Use of non-owner occupied homes changing
                                                                                           Active bonds and annual turnover to active bonds
• The number of active bonds has declined slightly since 2015. At the same
                                                                             7000                                                                                             70%
  time a smaller proportion of bonds are turned over each year.
                                                                             6000                                                                                             60%
• This means at that same time that population growth has increased          5000                                                                                             50%
  demand for rental properties, fewer are available through
                                                                             4000                                                                                             40%
     • Rental homes coming off the market,
                                                                             3000                                                                                             30%
     • Renters staying in their current rental longer.                       2000                                                                                             20%

• The number of homes exiting the rental market has increased since          1000                                                                                             10%
  around 2014, with as many as 10% of rental properties not being re-           0                                                                                             0%
  tenanted each year.                                                               2010   2011   2012   2013     2014      2015      2016    2017     2018     2019   2020

• The majority of rentals that are not re-let are either:                                          Active Bonds           Annual bonds lodged to active bonds

     • purchased by non-first home buyers (investors or movers). Homes       Source: MBIE bond data

       bought by investors are likely to be rented through another                           Ex-rentals in Rotorua District - where did they go
       platform                                                               700
     • not sold and either lived in by the owner or rented through another    600
       platform                                                               500
                                                                              400
• Increasing use of short term rental accommodation (i.e. Air BNB) will be    300
  one driver of the reduction in active bonds. The exact extent remains       200
  unclear. Stats NZ is looking at getting data on short term rental           100
  accommodation usage.                                                          0
                                                                                 2001200220032004200520062007200820092010201120122013201420152016201720182019

                                                                                                   Exiting rentals sold to non-FHBs
                                                                                                   Exiting rentals sold to FHBs
                                                                                                   Exiting rental but not sold (likely owner returning or Airbnb)
                                                                             Source: HUD calculation based on MBIE Bond data and Corelogic
Housing affordability                                                                                                                                                       Renting households spending more than
                                                                                                                                                                                30% of income mortgage servicing costs if
•     Recent increases in house prices have increased the proportion of households who cannot afford to
      purchase a LQ priced home where they live. The ratio of the median house price to median renter income                                                                         purchasing lower quartile home
      has also increased.                                                                                                                                              0.8
                                                                                                                                                                       0.7
                                                                                                                                                                       0.6
•     However despite significant increases in rent, the proportion of renters spending more than 30% of                                                               0.5
      income on rent has declined in recent years. However given the significant increase in rents, and that rents                                                     0.4
                                                                                                                                                                       0.3
      have moved faster than incomes, households may be sharing accommodation or accepting lower levels of                                                             0.2

                                                                                                                                                                             2003-03
                                                                                                                                                                             2003-12
                                                                                                                                                                             2004-09
                                                                                                                                                                             2005-06
                                                                                                                                                                             2006-03
                                                                                                                                                                             2006-12
                                                                                                                                                                             2007-09
                                                                                                                                                                             2008-06
                                                                                                                                                                             2009-03
                                                                                                                                                                             2009-12
                                                                                                                                                                             2010-09
                                                                                                                                                                             2011-06
                                                                                                                                                                             2012-03
                                                                                                                                                                             2012-12
                                                                                                                                                                             2013-09
                                                                                                                                                                             2014-06
                                                                                                                                                                             2015-03
                                                                                                                                                                             2015-12
                                                                                                                                                                             2016-09
                                                                                                                                                                             2017-06
                                                                                                                                                                             2018-03
                                                                                                                                                                             2018-12
      quality than in the past.

•     More problematic is that households in Rotorua District who are spending more than 30% of income on
      rent are spending significantly more. A renting household earning the 20% percentile income and paying a
                                                                                                                                                                       Source: Housing Affordability Measure
      Lower Quartile rent spends 48% of their income on rent now compared with 35% in now.

•     A household on the median income paying mean rent would have seen rent increase from 23% to 29% of
      income
                                                                                                                                                                                     Proportion of renters spending more
                                                                                                                                                                                         than 30% of income on rent
                 Rent to income ratio for low and                                                                                Median House Price to median renter         0.37
                   median income household                                                                                                    income                         0.35
                                                                                                                                                                             0.33
    50%                                                                                                                   7
                                                                                                                          6                                                  0.31
    40%
                                                                                                                          5                                                  0.29
    30%                                                                                                                   4                                                  0.27
    20%                                                                                                                   3                                                  0.25
          2003
                 2004
                        2005
                               2006
                                      2007
                                             2008
                                                    2009
                                                           2010
                                                                  2011
                                                                         2012
                                                                                2013
                                                                                       2014
                                                                                              2015
                                                                                                     2016
                                                                                                            2017
                                                                                                                   2018

                                                                                                                          2

                                                                                                                                                                                    2003-03
                                                                                                                                                                                    2003-12
                                                                                                                                                                                    2004-09
                                                                                                                                                                                    2005-06
                                                                                                                                                                                    2006-03
                                                                                                                                                                                    2006-12
                                                                                                                                                                                    2007-09
                                                                                                                                                                                    2008-06
                                                                                                                                                                                    2009-03
                                                                                                                                                                                    2009-12
                                                                                                                                                                                    2010-09
                                                                                                                                                                                    2011-06
                                                                                                                                                                                    2012-03
                                                                                                                                                                                    2012-12
                                                                                                                                                                                    2013-09
                                                                                                                                                                                    2014-06
                                                                                                                                                                                    2015-03
                                                                                                                                                                                    2015-12
                                                                                                                                                                                    2016-09
                                                                                                                                                                                    2017-06
                                                                                                                                                                                    2018-03
                                                                                                                                                                                    2018-12
                                                                                                                          1
                        Mean rent to med income                                        20th pct to LQ                     0

                                                                                                                                                                             Source: Housing Affordability Measure
Source: HUD calculation, Housing Affordability Measure, MBIE bonds                                                        Source: HUD calculation
Housing Quality                                                           0.25
                                                                                          Mould in occupied private dwellings

                                                                           0.2
Rotorua has a higher proportion of homes that are damp or mouldy
compared to the national average. Also has higher proportion of homes     0.15
of unknown condition (16% compared to 10-11% nationally)
                                                                           0.1
Areas that have a lower proportion of homes built since 1980 tend to
have higher levels of problems with dampness and mould. Are also more     0.05

likely to be rentals.                                                       0
                                                                                              Rotorua                           New Zealand

                                                                                       Mould over A4 size always   Mould over A4 size sometimes

                                                                        Source: Census 2018

                                                                                          Dampnes in occupied private homes
                                                                           0.3

                                                                          0.25

                                                                           0.2

                                                                          0.15

                                                                           0.1

                                                                          0.05

                                                                            0
                                                                                              Rotorua                           New Zealand

                                                                                                    Always damp    Sometimes damp

                                                                        Source: Census 2018
Source: Corelogic
Acute need is continuing to increase
The Housing register continues to increase. 93% of                   Housing Register - Rotorua District                                                                            Clients per month
applicants are Priority A.                                                                                                                                 300
                                                               600

                                                                                                                               Rotorua Emergency Housing
78% of applicants require one or two bed homes where           500                                                                                         250
the majority of Public Homes are two and three beds
                                                               400                                                                                         200

223 people were in emergency housing on 31 January             300                                                                                         150
2020:
                                                               200                                                                                         100
• 188 were single individuals or sole parents
                                                               100                                                                                         50
• All but 7 received a benefit (excluding superannuation)        0                                                                                          0

                                                                                                                                                                                                                       Jul-19
                                                                                                                                                                                            Apr-19
                                                                                                                                                                                                     May-19
                                                                                                                                                                                                              Jun-19

                                                                                                                                                                                                                                                           Nov-19
                                                                                                                                                                 Jan-19
                                                                                                                                                                          Feb-19
                                                                                                                                                                                   Mar-19

                                                                                                                                                                                                                                Aug-19
                                                                                                                                                                                                                                         Sep-19

                                                                                                                                                                                                                                                                    Dec-19
                                                                                                                                                                                                                                                                             Jan-20
                                                                                                                                                                                                                                                                                      Feb-20
                                                                                                                                                                                                                                                  Oct-19
• 196 identified as Māori
• Half had been on the housing register for more than 3       Source: MSD                                                                             Source: MSD
  months.
                                                                                      Demand from register compared to existing
MSD spent $11.4m on motels in 2019. Spending more                                                      stock
than $1.4m in 2 and more than $500k in a further 4.                          350
                                                                                                           277               293
                                                                             300
Those in emergency housing do not include those in the                       250     222
night shelter.                                                               200                     154
                                                                             150
The high proportion of single adult and sole parents likely                  100
                                                                                           39
                                                                                                                        73
                                                                                                                                                                          46
reflects a severe shortage of rental homes that are                           50                                                                                 0                                   0        7
                                                                               0
available and affordable to households on a single benefit                          1 bedroom       2 bedroom       3 bedroom                                4 bedroom                      5 bedroom +
income
                                                                                           Register - Demand (Dec 19)         Tenancies - supply (sept 19)

                                                                             Source: MSD and HUD (note register demand for 4 and 5 bed homes suppressed due
                                                                             to small number
Stock of subsidised rentals is low and growth slow
For Rotorua has a significant gap between the number of public homes and
applicants on the register:

•   For Territorial authorities with more than 50 applicants on register, register as
    proportion of current public homes in Rotorua highest in country.

The Public Housing Plan sought 80 additional public homes for Rotorua by June
2022. A further 105 places are funded for Housing First.

•   Kāinga Ora has completed 4 new builds to date with a further 32-34 to be
    completed by December 2021.

Rotorua has limited Transitional Housing and of varied quality:

Range of housing providers
•   45 places from night shelter
•   Salvation Army and Link People 18 places
                                                                                        Key issues:
•   Woman's Refuge 7
                                                                                        •    Acute shortage of housing means that Kāinga Ora, CHPs and THPs cant significantly
•   Emerge contracted motels 19
                                                                                             increase supply by purchasing or leasing existing homes
                                                                                        •    New builds require capital which CHPs and THPs do not have. Up front funding for
KO purchased 11 in November and December as part of the 1000 additional
                                                                                             public housing is not available under current settings.
transitional homes funded through the homelessness action plan
                                                                                        •    New builds require lead time – this is why KO has delivered 4 new builds since July
                                                                                             2018.
Comment on Council housing
                                                                                        •    There is limited CHP/Housing provider presence with asset management experience
                                                                                             presenting challenges to investor lease approaches.
                                                                                        •    Market rents available to CHPs or THPs were set in 2016 and no longer reflect actual
                                                                                             rents in the Rotorua market.
Why the lack of urban development?
Consents fell significantly during the Global financial Crisis and remained low for some time. This pattern was reflected across the country: Prices fell due
to reduced demand and the collapse of finance companies removed a dominant form of developer finance.

But why has development been so slow to respond to recent increases in demand and prices?

One driver appear to be that the low price of existing homes reduced demand for new builds.

The low number of consents following the GFC coincides with a sustained fall in the price-cost ratio which compares the cost of constructing a new home
(excluding land and infrastructure) to the price of existing properties.

•   A price cost ratio of around one would indicate that new build homes once land and
    other development costs are included are more expensive than homes that could be
    bought on the market. This would suggest demand for new homes could be limited as
    buyers can find what a cheaper alternative on the market.

•   For comparison the price cost ratio in Auckland is 2.7 suggesting cost of construction is
    less than 40% of the cost of purchasing an existing property (the rest is land). In
    Auckland more buyers are likely to see new builds – particularly townhouses and
    apartments – as affordable alternatives to existing homes in high demand areas.

A low price cost ratio would mean that the market for new build homes would only
profitably meet a small proportion of demand. Remaining demand would need to be
accommodated within the existing housing stock – pushing up prices and rents.
                                                                                                Source: NPS UDC Dashboard
Low prices provided may have provided weak incentives to develop
Low incentive to convert land from urban to rural use
Relative to other medium and high growth areas Rotorua had a smaller difference between the
value of rural and urban zoned land based on 2014 data. [we are in the process of updating for
latest valuation – date TBC]
The modest differential may equate to $400k per h.a. which compared to land development,
infrastructure costs and other risks may not be sufficient to encourage development relative to
existing uses. Alternatively landowners may be content to wait for prices to rise (“land bank”)
The limited development intentions signalled to Council by owners of residentially zoned land would
be consistent with the weak profitability.
The next slide considers some potential constraints or costs to development.
Modest profits from intensification/subdivision may be outweighed by costs.
Council indicate approximately 8000 additional residential sites could be created through infill
development using current District Plan provisions. However:
•   The number of dwellings created through infill development or subdivision has been limited
    with 49 dwellings created in the 2017/8 financial year and 18 dwellings in the 2018/2019.
•   Anecdotally costs associated with subdivision have increased since the before the GFC meaning
    reducing profitability of infill development for current owners.
Generally land values are fairly low in the existing urban area, suggesting limited profit from infill.
As potential sites are owned by “mums and dads” higher costs and uncertainty means significant
redevelopment of existing housing is unlikely likely.                                                     Source: NPS UDC Dashboard
Land development may remain limited
Prices have risen significantly since 2014 suggesting incentives to develop are how higher.
However:
•   Constraints and concentrated landownership may limit rate of development.
•   Higher build costs may mean increased profit to landowners from higher prices is limited [see
    slide 6]
Limited land available for development
Council’s assessment as part of its Streamlined Plan Process application, recently approved by the
Minister for the Environment, indicates as little as a third of the land may be available for
development. Available land is mostly held by two landowners.                                         Source: RLC Application for Streamlined Plan Change Process for Pukehungi Heights
Potential constraints limiting actual development include: subsidence, flooding, stormwater
disposal, transport and limited landowner interest to develop.
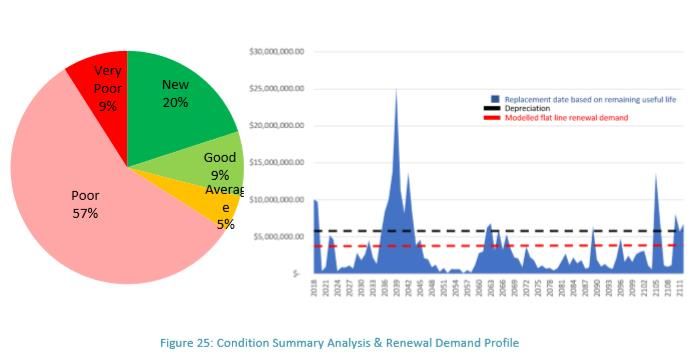
                                                                                                           Waste water asset condition and remaining life
Constraints either mean development costs are higher, at lower yields or cant be developed at all.
We have heard particular issues around the cost of meeting Regional Council stormwater and
flooding requirements. More generally:
•   there has been little investment in growth infrastructure in the 2018 Long term Plan
•   the council does not have development contributions.
•   There appears a mismatch between stormwater and wastewater asset quality and remaining
    useful life. See for wastewater in bottom right chart – 2/3 assets poor or very poor, yet
    renewal 20 years away based on projected useful life
Transport investment is also a key dependency
Uncertainty about potential infrastructure costs and how these will be met may be a factor limiting     Source: RLC 2018 Long Term Plan
new development
What all these factors mean:
Poor development economics driving a lack of urban                                 Meaning that those on lowest income have borne the
development responsiveness                                                         brunt of the shortage of accommodation
•   The cost of new build homes is high relative to the price of existing          •   Rising rents have widened the gap between actual housing costs and
    housing and incomes.                                                               what is affordable to low income households. Availability of rentals has
                                                                                       also reduced
•   This means that the market will only meet a small proportion of new
    demand.                                                                        •   This has driven the increasing number of applicants on the register, use
                                                                                       of motels and the shelter. Absence of stable housing is limiting ability to
•   Over the longer term where demand is growing prices and rents are likely           deal with chronic homelessness
    to tend towards the cost to build which can be out of step with local
    incomes.                                                                       •   But there are potentially 2500 renting households who are stressed, and
                                                                                       facing increasing housing costs (30% of all households in rentals):
•   In recent years Rotorua seems to have experienced strongly rising rents
    reflecting an underlying shortage in accommodation                                   • For 20th percentile household to have rental affordable to them, LQ rent
                                                                                           would need to fall from current level of around $300 to $184 per week.
•   However rising building costs has meant reduced ability of market to                   This reflects a gap of $116 per week, and is after accommodation
    respond to increasing demand                                                           supplement is taken into account.

                                                                                         • In 2010 this gap was $35 with LQ rent of $180 and rent affordable to
•   To meet demand for housing interventions are needed to meet gap
                                                                                           household of $145.
    between cost of new housing and what people can afford through:

      •    Reducing cost to build new homes – i.e. regulatory and building costs
                                                                                   •   This means solutions are not just about building public housing and
                                                                                       market housing, but finding a mix of interventions that increases the
      •    Finding different ways to meet the gap between cost of housing and          number of rental homes that are affordable to low income renting
           what people can afford to pay                                               households – whether existing homes or new ones.
Buyer Classification
• Movers are existing owners who have bought and sold a home either within the same housing market or moving from another.

• First home buyers are where all purchasers on the title have not owned a home previously and the home is purchased with a mortgage.

• Multiple Property Owner is where purchasers who already own a property, i.e. investors, or owner occupiers purchasing a holiday home. Cash refers to properties
  that are not purchased with a mortgage (i.e. no mortgage on the title). However cash purchasers may be funded from equity generated from a wider portfolio
  which is debt funded.

• New to Market reflects buyers who have not previously owned a home in New Zealand and are purchasing with out a mortgage. Some will be first home buyers.

• Re-entry reflects buyers who have previously owned a home but not within the last 6 months. This would cover the “second chancers” and residents who have
  lived overseas returning to New Zealand.

• Other buyers is a catch all bucket for any property purchases that do not fit into one of the above classifications. For example situations such as some but not all
  owners names changing.
You can also read