AG Mortgage Investment Trust, Inc - Q2 2019 Earnings Presentation August 6, 2019
←
→
Page content transcription
If your browser does not render page correctly, please read the page content below
AG Mortgage Investment Trust, Inc.
Q2 2019 Earnings Presentation
August 6, 2019
Forward Looking Statements and Non-GAAP Financial Information
Forward Looking Statements: This presentation includes "forward-looking statements" within the meaning of the safe harbor provisions of the United States Private Securities
Litigation Reform Act of 1995 related to dividends, book value, our investments, our investment and portfolio strategy, investment returns, return on equity, liquidity, financing, taxes,
our assets, our interest rate sensitivity, and our views on certain macroeconomic trends and conditions, among others. Forward-looking statements are based on estimates, projections,
beliefs and assumptions of management of the Company at the time of such statements and are not guarantees of future performance. Forward-looking statements involve risks and
uncertainties in predicting future results and conditions. Actual results could differ materially from those projected in these forward-looking statements due to a variety of factors,
including, without limitation, changes in interest rates, changes in the yield curve, changes in prepayment rates, changes in default rates, the availability and terms of financing,
changes in the market value of our assets, general economic conditions, conditions in the market for Agency RMBS, Non-Agency RMBS, ABS and CMBS securities, Excess MSRs
and loans, our ability to integrate single-family rental assets into our investment portfolio, our ability to predict and control costs, conditions in the real estate market, and legislative
and regulatory changes that could adversely affect the business of the Company. Additional information concerning these and other risk factors are contained in the Company's filings
with the Securities and Exchange Commission ("SEC"), including its most recent Annual Report on Form 10-K and subsequent filings. Copies are available free of charge on the
SEC's website, http://www.sec.gov/. All information in this presentation is as of August 5, 2019. The Company undertakes no duty to update any forward-looking statements to reflect
any change in its expectations or any change in events, conditions or circumstances on which any such statement is based.
Non-GAAP Financial Information: In addition to the results presented in accordance with GAAP, this presentation includes certain non-GAAP financial results and financial metrics
derived therefrom, which are calculated by including or excluding depreciation and amortization, unconsolidated investments in affiliates, TBAs, and U.S. Treasuries, or, with respect
to our equity allocation calculation, by allocating all non-investment portfolio related asset and liabilities to our portfolio categories based on the characteristics of such assets and
liabilities, as described in the footnotes. Our management team believes that this non-GAAP financial information, when considered with our GAAP financials, provides supplemental
information useful for investors as it enables them to evaluate our current core performance using the same measure that management uses to operate the business. This presentation
also contains Core Earnings, a non-GAAP financial measure. Our presentation of non-GAAP financial information may not be comparable to similarly-titled measures of other
companies, who may use different calculations. This non-GAAP financial information should not be considered a substitute for, or superior to, the financial measures calculated in
accordance with GAAP. Our GAAP financial results and the reconciliations from these results should be carefully evaluated.

                                                                                                                                                                        NYSE: MITT          2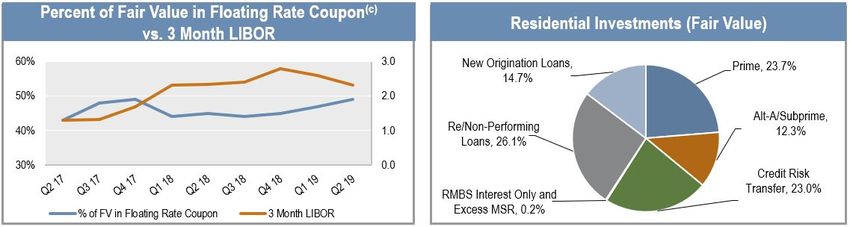
Q2 2019 MITT Earnings Call Presenters

         David Roberts                T.J. Durkin             Brian Sigman             Raul E. Moreno
        Chief Executive Officer   Chief Investment Officer   Chief Financial Officer    General Counsel

                                                                                                          NYSE: MITT   3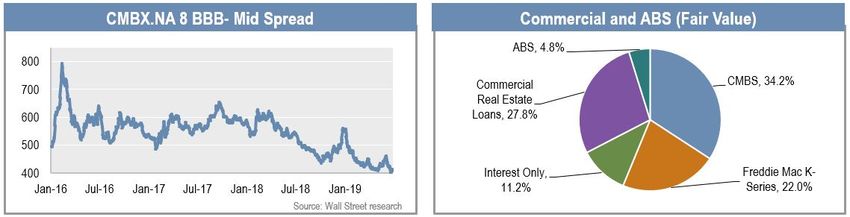
Q2 2019 Performance and Highlights
▪ Second quarter 2019:
▪ $0.47 of Net Income/(Loss) per diluted common share1
▪ $0.36 of Core Earnings per diluted common share1, 2
▪ Includes $(0.04) retrospective adjustment
▪ Decrease in Core Earnings from last quarter primarily due to the flattening of the yield curve and a change in prepayment expectations
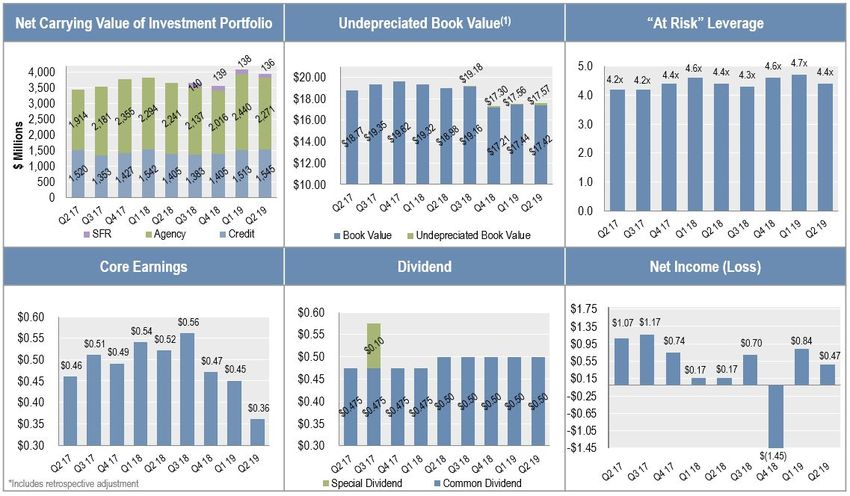
▪ 2.9% economic return on equity for the quarter, 11.6% annualized3
▪ $17.42 Book Value per share1 as of June 30, 2019
▪ $17.57 Undepreciated Book Value per share1 as of June 30, 2019 versus $17.56 as of March 31, 2019
▪ Undepreciated Book Value increased $0.01 or 0.1% from the prior quarter primarily due to:
▪ $0.01 or 0.1% due to our investments in Agency RMBS, Residential Loans(a) and associated derivatives
▪ Agency RMBS spreads widened versus benchmarks as the interest rate rally resulted in elevated gross supply, prepayment
uncertainty and increased implied volatility offset by short-duration non-performing and re-performing loan spreads tightening
during the quarter
▪ $0.13 or 0.7% due to our Credit Investments excluding Residential Loans(a)
▪ CRT and Legacy RMBS spreads tightened during the quarter, while CMBS spreads remained relatively unchanged despite
some volatility in AAA rated securities
▪ $(0.13)(b) or (0.7)% due to core earnings below the $0.50 dividend
▪ Declared quarterly common stock dividend of $0.50 per common share in the second quarter. We anticipate that our Board will adjust our
quarterly common stock dividend to $0.45 per common share for the third quarter of 2019, subject to any changes in our outlook at that time
(a) Residential Loans includes Re/Non-Performing Loans and New Origination Loans
(b) Includes $0.01 or 0.1% due to equity based compensation
NYSE: MITT 4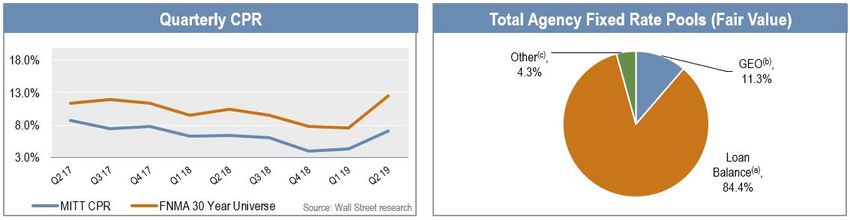
Q2 2019 Performance and Highlights (cont’d)

▪ $4.0 billion investment portfolio as of June 30, 2019 as compared to the $4.1 billion investment portfolio as of
  March 31, 20194,5
▪ 2.0% Net Interest Margin (“NIM”) as of June 30, 20196
▪ 4.4x “At Risk” Leverage as of June 30, 20197

                                                                                          6/30/2018                  9/30/2018                  12/31/2018                  3/31/2019                  6/30/2019

Yield on Investment Portfolio8                                                               5.1%                        5.2%                       5.3%                       5.2%                       5.0%

Cost of Funds9                                                                               2.4%                        2.7%                       3.0%                       3.1%                       3.0%

NIM6                                                                                         2.7%                        2.5%                       2.3%                       2.1%                       2.0%

“At Risk” Leverage7                                                                           4.4x                       4.3x                       4.6x                        4.7x                       4.4x

Note: Funding cost and NIM shown include the costs or benefits from our interest rate hedges. Funding cost and NIM excluding the cost or benefit of our interest rate hedges would be 3.2% and 1.8%, respectively.

                                                                                                                                                                                                  NYSE: MITT         5
Q2 2019 Activity
($ in millions)
Purchased Sold/Payoff Net Activity
Description
30 Year Fixed Rate $— $(123.6) $(123.6)
Inverse Interest Only — (3.2) (3.2)
Fixed Rate 30 Year TBA 746.6 (748.7) (2.1)
Total Agency RMBS 746.6 (875.5) (128.9)
Prime 1.2 (32.4) (31.2)
Alt-A/Subprime 7.3 — 7.3
Credit Risk Transfer 53.1 (0.9) 52.2
Re/Non-Performing Loans 6.3 (13.1) (6.8)
New Origination Loans 206.2 (181.9) 24.3
Total Residential Investments 274.1 (228.3) 45.8
CMBS 23.7 (21.1) 2.6
CMBS Interest Only — (1.7) (1.7)
Commercial Real Estate Loans 7.8 — 7.8
Total Commercial Investments 31.5 (22.8) 8.7
Total Q2 Activity $1,052.2 $(1,126.6) $(74.4)
Re/Non-Performing Loans Activity
▪ Participated in a term securitization alongside another Angelo Gordon fund in June which refinanced previously securitized primarily re-performing mortgage loans into a
new lower cost, fixed rate long-term financing, returning $14.0mm of equity to MITT
▪ MITT maintained exposure to the securitization through an interest in the subordinated tranches
▪ Entered into commitments to purchase two pools of Re/Non-Performing loans which are not included in the table above
New Origination Loans Activity
▪ Purchased several Non-QM pools alongside other Angelo Gordon funds
▪ Participated in Angelo Gordon's first rated Non-QM securitization alongside other Angelo Gordon funds in June, which refinanced Non-QM loans from repurchase
agreement financing into lower cost, fixed rate, non-recourse long-term financing, returning $16.7mm of equity to MITT
▪ MITT maintained exposure to the securitization through an interest in the subordinated tranches
Note: The chart above is based on trade date for securities and settle date for loans.
NYSE: MITT 6Q2 2019 Macro-Economic Conditions
▪ The Federal Reserve shifted from a neutral stance to an easing bias in response to a
slowing global economy and increased trade uncertainty that could result in a further
deterioration of business sentiment
▪ Inflation has remained persistently low, thereby allowing the Fed to cut the Fed funds rate
Macro Environment as needed
▪ Business fixed investment remains flat and net hiring has moderated in the face of
general business uncertainty
▪ The consumer continues to be supported by low unemployment and modest wage growth
▪ Home price appreciation continued during the quarter albeit at a slower pace and the
Housing housing market remains well-supported by tight inventory levels across much of the
nation
▪ Agency MBS spreads widened versus benchmark rates during the quarter as the sharp
rally in interest rates resulted in elevated gross supply, prepayment uncertainty and
Agency RMBS increased implied volatility; however the further shift in the Fed’s stance to an easing bias
helped the outlook for the sector and brought some stability to spreads into quarter-end
▪ Fundamental residential mortgage collateral performance, as measured by delinquency
Credit and default rates, remains at pre-crisis levels
NYSE: MITT 7Investment Opportunity Set
▪ Hypothetical Duration Hedged Levered ROE: 9-14%(a)(b)
Agency RMBS ▪ 30/20/15 Year Fixed Rate, Hybrid ARM, Fixed Rate CMO, Agency IO, Inverse IO,
Excess MSRs
▪ Hypothetical Levered ROE: 8-14%(b)
Residential Investments
▪ CRT, NPL, RPL, Non-QM, Legacy
▪ Hypothetical Levered ROE: 10-16%(b)
Commercial Investments
▪ Conduit, Single Asset/Single Borrower, Freddie Mac K-series, Commercial Loans
▪ Hypothetical Levered ROE: 8-14%(b)
ABS
▪ Consumer, auto backed debt, credit card, other non-residential ABS
▪ Hypothetical Levered ROE: 8-12%(b)
Single-Family Rental Properties
(a) Hypothetical levered returns on Agency RMBS are presented on a duration hedged basis, net of related costs.
(b) ROE values are presented gross of management fee and other corporate expenses.
Note: The above-listed investment opportunity set represents a subset of the types of assets that the Company can acquire. The hypothetical Levered Returns on Equity (“ROE”) depicted above are dependent on a variety of
inputs and assumptions, which are assumed to be static, and do not reflect our current portfolio or the impact of operating expenses. Actual returns could differ materially from those presented based on a number of factors,
including changes in interest rates, spreads, prepayments, asset values, funding levels, risk positions, hedging costs, expenses, occupancy, rental rates and other factors.
NYSE: MITT 8Q2 2019 Investment Portfolio Composition4,5
Amortized Cost Net Carrying Value Percent of Net Allocated Equity Percent of Leverage Ratio(a)
(mm) (mm) Carrying Value (mm)10 Equity
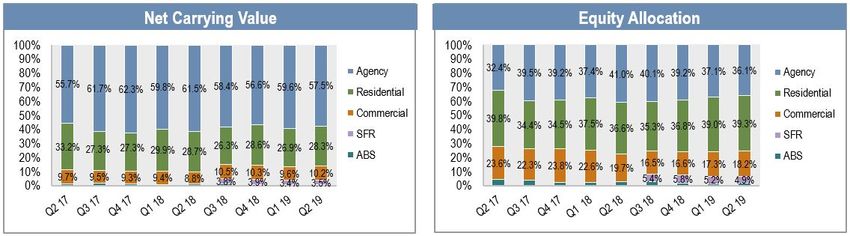
Agency RMBS(b) $2,211.6 $2,270.5 57.5% $263.8 36.1% 7.5x
Residential Investments(b) 1,047.6 1,119.7 28.3% 287.2 39.3% 3.1x
Commercial Investments(b) 379.5 404.6 10.2% 133.0 18.2% 2.1x
ABS 20.7 20.6 0.5% 11.1 1.5% 0.9x
Single-Family Rental Properties 136.4 136.4 3.5% 35.8 4.9% 2.8x
Total Investment Portfolio $3,795.8 $3,951.8 100.0% $730.9 100.0% 4.4x
(a) The leverage ratio on Agency RMBS includes any net payables or receivables on TBA. The leverage ratio by type of investment is calculated by dividing the investment type's total financing by its allocated equity.10
(b) The table above includes fair value of $0.6 million of Agency RMBS, $239.1 million of Residential Investments and $5.6 million of Commercial Investments that are included in the “Investments in debt and equity of
affiliates” line item on our consolidated balance sheet.
▪ As of Q2 2019, 57.5% Agency, 39.0% Credit, and 3.5% SFR ▪ As of Q2 2019, 36.1% Agency, 59.0% Credit and 4.9% SFR
NYSE: MITT 9Q2 2019 Agency Portfolio Details
Current Face Fair Value Percent of Fair Weighted Average Weighted Average
Description (mm) (mm) Value Coupon12 Yield8
30 Year Fixed Rate $1,880.3 $1,990.9 87.7% 4.1% 3.5%
Fixed Rate CMO 40.0 40.8 1.8% 3.0% 2.8%
Inverse Interest Only 257.7 43.5 1.9% 3.8% 6.1%
Interest Only 344.6 47.9 2.1% 3.6% 1.1%
Excess MSRs 3,485.5 21.3 0.9% N/A 7.3%
Fixed Rate 30 Year TBA 125.0 126.1 5.6% 3.0% N/A
Total Agency RMBS(a) $6,133.1 $2,270.5 100.0% 3.9% 3.5%
(a) The total funding cost and NIM for Agency RMBS is 2.7% and 0.8%, respectively.
▪ 7.1% constant prepayment rate (“CPR”)11 on the Agency RMBS investment (a) Loan Balance: Pools made up of loans with original balances less than $200,000
(b) Geography: Pools made up of loans originated in states that offer favorable prepayment profiles
portfolio for Q2 2019 (c) Other: Pools made up of newly originated loans, loans on investor properties, loans with higher LTVs or
loans taken out by borrowers with lower than average FICOs
NYSE: MITT 10Q2 2019 Residential Portfolio Details
Current Face Fair Value Percent of Fair Weighted Average Weighted Average
Description (mm) (mm) Value Coupon12 Yield8
Prime $323.7 $265.7 23.7% 4.9% 7.5%
Alt-A/Subprime 203.5 137.8 12.3% 4.8% 6.7%
Credit Risk Transfer 248.3 257.3 23.0% 5.9% 6.0%
RMBS Interest Only and Excess MSR 309.5 2.0 0.2% 0.7% 15.9%
Re/Non-Performing Loans(a) 345.6 292.3 26.1% 5.2% 8.1%
New Origination Loans 504.7 164.6 14.7% 3.0% 5.0%
Total Residential Investments(b) $1,935.3 $1,119.7 100.0% 4.3% 6.9%
(a) Consolidated whole loan positions as well as whole loans purchased from an affiliate or affiliates of our manager in securitized form.
(b) The total funding cost and NIM for Residential Investments is 3.9% and 3.0%, respectively.
▪ 52% of our Residential Investments(c) are fixed rate coupon
and 48% are floating rate coupon12
(c) Excludes Re/Non-Performing Loans
NYSE: MITT 11Q2 2019 Commercial and ABS Portfolio Details
Weighted
Current Face Fair Value Percent of Fair Weighted
Description Average
(mm) (mm) Value Average Yield8
Coupon12
CMBS $149.3 $145.4 34.2% 5.8% 6.1%
Freddie Mac K-Series 201.8 93.4 22.0% 5.9% 12.3%
Interest Only 3,493.2 47.8 11.2% 0.2% 7.0%
Commercial Real Estate Loans 118.0 118.0 27.8% 7.5% 7.9%
Total Commercial Investments(a) 3,962.3 404.6 95.2% 0.7% 8.2%
ABS(a) 20.8 20.6 4.8% 9.6% 10.2%
Total Commercial and ABS $3,983.1 $425.2 100.0% 0.7% 8.2%
(a) The total funding cost and NIM for Commercial Investments is 4.0% and 4.2%, respectively. The total funding cost and NIM for ABS is 3.7% and 6.5%, respectively.
▪ 25% of our Commercial and ABS Investments are fixed rate coupon and
75% are floating rate coupon12
NYSE: MITT 12Single-Family Rental Portfolio Update
▪ Occupancy remained stable throughout the 2nd quarter in the 92-93% range
▪ The slight occupancy dip in June is related to seasonally higher number of lease expirations and
lower renewal pull-through
▪ Decline in operating margin primarily due to the aging and subsequent write-off of certain rent
receivables
3/31/2019 6/30/2019
Gross Carrying Value(a) $ 141.7 $ 141.3
Accumulated Depreciation and Amortization(a) (3.8) (4.9)
Net Carrying Value(a) $ 137.9 $ 136.4
Occupancy(b) 93.7% 92.1%
Average Square Footage(b) 1,463 1,455
Average Monthly Rental Income per Home(b)(c) $ 1,020 $ 1,028
(d)
Operating Margin(15) 45.2% 41.5%
(a) $ in millions
(b) Based on occupied residences as of each corresponding period end
(c) Based on straight-line rent as of each corresponding period end
(d) Includes a write-off of approximately $0.1 million of rental income receivable taken in Q2 2019
13Financing
▪ Financing arrangements with 45 counterparties
▪ Currently financing investments with 33 counterparties
▪ Our weighted average days to maturity is 138 days and our weighted average original days to maturity is 236 days
▪ Financing counterparties remain stable
Financing Arrangements(a) ($ in millions)
Agency Credit SFR(b)
Maturing Within Amount Outstanding WA Funding Cost Amount Outstanding WA Funding Cost Amount Outstanding WA Funding Cost
Overnight $118.3 2.7% $— —% $— —%
30 Days or less 999.2 2.7% 571.0 3.5% — —%
31-60 Days 428.1 2.6% 134.1 3.8% — —%
61-90 Days 147.2 2.6% 74.9 3.9% — —%
91-180 days 249.0 2.6% — —% — —%
Greater than 180 Days — —% 352.7 4.5% 102.0 4.8%
Total and WA $1,941.8 2.7% $1,132.7 3.9% $102.0 4.8%
(a) Amounts do not include securitized debt of $8.6 million
(b) Includes $0.9 million of deferred financing costs
NYSE: MITT 14Duration Gap14
Duration gap was approximately 0.98 years as of June 30, 2019
Duration Years
Agency 0.77
Residential Loans(a) 0.72
Hedges (1.16)
Subtotal 0.33
Credit excluding Residential Loans(a) 0.65
Duration Gap 0.98
Duration gap was approximately 0.95 years as of March 31, 2019
Duration Years
Agency 1.80
Residential Loans(a) 0.39
Hedges (1.87)
Subtotal 0.32
Credit excluding Residential Loans(a) 0.63
Duration Gap 0.95
(a) Residential Loans includes Re/Non-Performing Loans and New Origination Loans. As of June 30, 2019, Residential Loans are presented pro-forma for the purchase of $234.2 million of Re/Non-Performing Loans that
we have committed to purchase but that have not settled as the hedges related to these purchases have already been added to the portfolio. The duration gap exclusive of these commitments would be 0.67.
NYSE: MITT 15Hedging
Hedge Portfolio Summary as of June 30, 2019 ($ in millions)
Notional Duration14
Interest Rate Swaps $(1,302.5) (1.09)
Swaptions (445.0) (0.01)
Eurodollar Futures (1,000.0) (0.06)
U.S. Treasury Futures (0.7) (0.00)
Total $(2,748.2) (1.16)
Interest Rate Swaps as of June 30, 2019 ($ in millions)
Weighted Average Pay-Fixed Weighted Average Receive- Weighted Average Years to
Maturity Notional Amount Rate Variable Rate(a) Maturity
2020 $105.0 1.5% 2.6% 0.7
2022 778.8 1.9% 2.5% 3.0
2023 5.7 3.2% 2.6% 4.4
2024 345.0 2.0% 2.1% 5.0
2026 20.0 1.9% 2.5% 7.4
2027 10.0 2.2% 2.3% 8.0
2029 38.0 1.9% 2.3% 10.0
Total/Wtd Avg $1,302.5 1.9% 2.4% 3.6
(a) 100% of our receive-variable interest rate swap notional amount resets quarterly based on three-month LIBOR
NYSE: MITT 16Q2 2019 Financial Metrics
Weighted Average for the
Key Statistics quarter-ended June 30,
June 30, 2019 2019
Investment portfolio4,5 $3,951.8 $3,910.5
Financing arrangements, net5 3,176.5 3,281.7
Total Financing7 3,232.5 3,345.0
Stockholders’ equity 730.9 730.4
GAAP Leverage 4.1x
“At Risk” Leverage7 4.4x
Yield on investment portfolio8 5.0% 4.9%
Cost of funds9 3.0% 3.1%
Net interest margin6 2.0% 1.8%
Other operating expenses (corporate)16 1.5% 1.5%
Book value, per share1 $17.42
Undepreciated Book Value, per share1 $17.57
Undistributed taxable income, per share(a) $1.28
Common Dividend, per share1 $0.50
(a) Refer to slide 23 for further detail
NYSE: MITT 17Supplemental Information & Financial Statements
NYSE: MITT 18Quarter-Over-Quarter Snapshot
NYSE: MITT 19Market Snapshot
Interest Rates 6/30/18 9/30/18 12/31/18 3/31/19 6/30/19 Agency RMBS 6/30/18 9/30/18 12/31/18 3/31/19 6/30/19
Treasuries Fannie Mae Pass-
Throughs
2-year 2.530 2.821 2.490 2.263 1.755
30 year 3.00% 96-25+ 95-20+ 97-11+ 99-18+ 100-25+
5-year 2.739 2.954 2.512 2.234 1.766
30 year 3.50% 99-14+ 98-12+ 99-26+ 101-12+ 102-06+
10-year 2.861 3.062 2.685 2.406 2.005
30 year 4.00% 101-29+ 100-30+ 101-26+ 102-27+ 103-10+
Swaps
30 year 4.50% 104-02+ 103-04+ 103-14+ 104-05+ 104-15+
3 month LIBOR 2.336 2.398 2.808 2.600 2.320
Mortgage Rates
2-year swaps 2.792 2.990 2.657 2.382 1.805
5-year swaps 2.890 3.071 2.570 2.285 1.765 15-year 4.04% 4.16% 4.01% 3.57% 3.16%
10-year swaps 2.934 3.121 2.705 2.409 1.964 30-year 4.55% 4.72% 4.55% 4.06% 3.73%
Credit Spreads 6/30/18 9/30/18 12/31/18 3/31/19 6/30/19
CDX IG 68 59 88 63 55
New Issue CAS M2 221 203 290 214 203
CMBX.NA 8 BBB- Mid Spread 542 449 550 448 411
Source: Bloomberg and Wall Street research. Data has not been independently validated.
NYSE: MITT 20Undepreciated Book Value Roll-Forward
Amount (000’s) Per Share1
3/31/19 Undepreciated Book Value $574,205 $17.56
Common dividend (16,355) (0.50)
Core earnings 11,779 0.36
Net proceeds and accretion/(dilution) from issuance of stock 272 0.00
Transaction related expenses and deal related performance fees (484) (0.01)
Equity in earnings/(loss) from affiliates and other income 812 0.02
Net realized gain/(loss) (27,579) (0.84)
Net unrealized gain/(loss) 31,963 0.98
6/30/19 Undepreciated Book Value $574,613 $17.57
Change in Undepreciated Book Value 408 0.01
Accumulated depreciation and amortization (4,963) (0.15)
6/30/19 Book Value $569,650 $17.42
NYSE: MITT 21Reconciliation of GAAP Net Income to Core Earnings2
Three Months Ended June 30, 2019 Amount (000’s) Per Diluted Common Share1
Net Income/(loss) available to common stockholders $15,311 $0.47
Add (Deduct):
Net realized (gain)/loss 27,579 0.84
Unrealized (gain)/loss on real estate securities and loans, net (43,165) (1.32)
Unrealized (gain)/loss on derivative and other instruments, net 10,839 0.33
Property depreciation and amortization 1,180 0.04
Transaction related expenses and deal related performance fees 484 0.01
Equity in (earnings)/loss from affiliates (2,050) (0.06)
Net interest income and expenses from equity method investments 1,352 0.04
Dollar roll income 363 0.01
Other income (114) (0.00)
Core Earnings (a) $11,779 $0.36
(a) The three months ended June 30, 2019 include cumulative retrospective adjustments of $(1.3) million or $(0.04) per diluted share on the premium amortization for investments accounted for under ASC 320-10.
NYSE: MITT 22Undistributed Taxable Income Roll-Forward
Amount (000’s) Per Share1
3/31/19 Undistributed Taxable Income $42,313 $1.29
Q2 Core Earnings 11,779 0.36
Q2 Recurring Core-Tax Differences 4,015 0.13
Q2 Other Core-Tax Differences 45 0.00
Q2 Ordinary Taxable Income, Net of Preferred Distribution 15,839 0.49
Q2 Common Distribution (16,355) (0.50)
6/30/19 Undistributed Taxable Income $41,797 $1.28
Note: This estimate of undistributed taxable income per share represents the total estimated undistributed taxable income as of quarter-end. Undistributed taxable income is based on current estimates and projections. The
actual amount is not finalized until we file our annual tax return, typically in October of the following year. Figures may not foot due to rounding.
NYSE: MITT 23Condensed Consolidated Balance Sheet
June 30, 2019 (Unaudited)
Amount (000’s)
Assets Liabilities
Real estate securities, at fair value $3,105,191 Financing arrangements, net $2,993,233
Residential mortgage loans, at fair value 199,970 Securitized debt, at fair value 8,630
Commercial loans, at fair value 118,005 Dividend payable 16,355
Single-family rental properties 136,374 Other liabilities 48,833
Investments in debt and equity of affiliates 99,955 Total Liabilities 3,067,051
Excess mortgage servicing rights, at fair value 20,893 Commitments and Contingencies
Cash and cash equivalents 60,097 Stockholders' Equity
Restricted cash 32,853 Preferred stock 161,214
Other assets 24,577 Common stock 327
Total Assets $3,797,915 Additional paid-in capital 661,833
Retained earnings (deficit) (92,510)
Total Stockholders’ Equity 730,864
Total Liabilities & Stockholders’ Equity $3,797,915
NYSE: MITT 24Condensed Consolidated Statement of Operations
Three Months Ended June 30, 2019 (Unaudited)
Amount (000’s)
Net Interest Income Earnings/(Loss) Per Share of Common Stock
Interest income $40,901 Basic $0.47
Interest expense 24,277 Diluted $0.47
Total Net Interest Income 16,624
Other Income/(Loss) WA Shares of Common Stock Outstanding
Rental Income 3,162 Basic 32,709
Net realized gain/(loss) (27,579) Diluted 32,737
Net interest component of interest rate swaps 1,800
Unrealized gain/(loss) on real estate securities and loans, net 43,165
Unrealized gain/(loss) on derivative and other instruments, net (10,839)
Other Income 346
Total Other Income/(Loss) 10,055
Expenses
Management fee to affiliate 2,400
Other operating expenses 3,850
Equity based compensation to affiliate 73
Excise tax 186
Servicing fees 416
Property depreciation and amortization 1,180
Property operating expenses 1,946
Total Expenses 10,051
Income/(loss) before equity in earnings/(loss) from affiliates 16,628
Equity in earnings/(loss) from affiliates 2,050
Net Income/(Loss) 18,678
Dividends on preferred stock 3,367
Net Income/(Loss) Available to Common Stockholders $15,311
NYSE: MITT 25Footnotes
1. Diluted per share figures are calculated using weighted average outstanding shares in accordance with GAAP. Per share figures are calculated using a denominator of all outstanding common shares including vested
shares granted to our Manager and our independent directors under our equity incentive plans as of quarter-end. Core earnings as presented in the undepreciated book value roll-forward slide and the undistributed taxable
income roll-forward slide is calculated using weighted average outstanding shares in accordance with GAAP. Book value uses stockholders’ equity less net proceeds of the Company’s 8.25% Series A and 8.00% Series B
Cumulative Redeemable Preferred Stock as the numerator. Undepreciated book value per share is a non-GAAP book value metric which adds accumulated depreciation and amortization back to book value to present an
adjusted book value that incorporates the Company's single-family rental property portfolio at its undepreciated basis. This metric allows management to consider the investment portfolio exclusive of non-cash adjustments
and facilitates the comparison of our financial performance to peer REITs. Book value and Undepreciated book value include the current quarter dividend.
2. Core Earnings are defined as Net Income/(loss) available to common stockholders excluding (i) unrealized gains/(losses) on real estate securities, loans, derivatives and other instruments and realized gains/(losses) on
the sale or termination of such investments, (ii) beginning with Q2 2018, as a policy change, any transaction related expenses incurred in connection with the acquisition or disposition of investments, (iii) beginning with Q3
2018, concurrent with a change in the Company's business, any depreciation or amortization expense related to the Company's SFR portfolio, (iv) beginning with Q3 2018, as a policy change, accrued deal related performance
fees payable to Arc Home and third party operators to the extent the primary component of the accrual relates to items that are excluded from core earnings, such as unrealized and realized gains/(losses), and (v) beginning
with Q4 2018 and applied retrospectively, as a policy change, realized and unrealized changes in the fair value of Arc Home's net mortgage servicing rights as well as realized and unrealized changes in the fair value of
derivatives that are intended to offset changes in the fair value of those net mortgage servicing rights. Items (i) through (v) above include any amounts related to those items held in affiliated entities. This metric, in conjunction
with related GAAP measures provides greater transparency into the information used by our management team in its financial and operation decision-making. Management considers the transaction related expenses
referenced in (ii) above to be similar to realized losses incurred at acquisition or disposition and does not view them as being part of its core operations. Management views the exclusion described in (v) above to be
consistent with how it calculates Core Earnings on the remainder of its portfolio. As defined, Core Earnings include the net interest income and other income earned on the Company's investments on a yield adjusted basis,
including TBA dollar roll income or any other investment activity that may earn or pay net interest or its economic equivalent. Core Earnings includes earnings from AG Arc LLC. See page 22 for a reconciliation of GAAP
net income to Core Earnings. See footnote 13 for further details on AG Arc LLC.
3. The economic return on equity for the quarter represents the change in undepreciated book value per share from March 31, 2019 to June 30, 2019, plus the common dividends declared over that period, divided by
undepreciated book value per share as of March 31, 2019. The annualized economic return on equity is the quarterly return on equity multiplied by four.
4. The investment portfolio at period end is calculated by summing the net carrying value of our Agency RMBS, any long positions in TBAs, Residential Investments, Commercial Investments, ABS Investments, and our SFR
portfolio, including securities and mortgage loans owned through investments in affiliates, exclusive of AG Arc LLC. Our Agency RMBS, Residential Investments, Commercial Investments, and ABS Investments are held
at fair market value and our SFR portfolio is held at purchase price plus capitalized expenses less accumulated depreciation and amortization and any adjustments related to impairment. Our Credit Investments refer to
our Residential Investments, Commercial Investments and ABS Investments. Refer to footnote 5 for more information on the GAAP accounting for certain items included in our investment portfolio. The percentage of net
carrying value includes any net TBA positions and securities and mortgage loans owned through investments in affiliates and is exclusive of AG Arc LLC. Agency RMBS include fair value of $0.6 million of investment in
debt and equity of affiliates related to Excess MSRs. Credit Investments include fair value of $244.7 million of investment in debt and equity of affiliates comprised of $74.5 million of Re/Non-Performing Loans, $164.6 million
of New Origination Loans, $1.0 million of Interest Only and $4.6 million of Freddie Mac K-Series. These items, inclusive of our investment in AG Arc LLC and other items, net to $100.0 million which is included in the
“Investments in debt and equity of affiliates” line item on our GAAP Balance Sheet. See footnote 13 for further details on AG Arc LLC.
5. Generally, when we purchase an investment and finance it, the investment is included in our assets and the financing is reflected in our liabilities on our consolidated balance sheet as either “Financing arrangements, net”
or “Securitized debt, at fair value.” Throughout this presentation where we disclose our investment portfolio and the related financing, we have presented this information inclusive of (i) securities and mortgage loans owned
through investments in affiliates that are accounted for under GAAP using the equity method and (ii) long positions in TBAs, which are accounted for as derivatives under GAAP. This presentation excludes investments
through AG Arc LLC unless otherwise noted. This presentation of our investment portfolio is consistent with how our management evaluates the business, and we believe this presentation, when considered with the GAAP
presentation, provides supplemental information useful for investors in evaluating our investment portfolio and financial condition. See footnote 13 for further details on AG Arc LLC.
6. Net interest margin is calculated by subtracting the weighted average cost of funds from the weighted average yield for the Company’s investment portfolio, which excludes cash held by the Company. Net interest margin
also excludes any net TBA position. See footnotes 8 and 9 for further detail.
7. “At Risk” Leverage is calculated by dividing total financing, including any net TBA position, by our GAAP stockholders’ equity at quarter-end. Our net TBA position (at cost) was $23.4 million, $125.8 million, $0.0 million,
$75.2 million and $166.2 million for the periods ending June 30, 2019, March 31, 2019, December 31, 2018, September 30, 2018 and June 30, 2018, respectively. Total financing at quarter-end, and when shown, daily
weighted average total financing, includes financing arrangements inclusive of financing arrangements through affiliated entities, exclusive of any financing utilized through AG Arc LLC, plus the payable on all unsettled
buys less the financing on all unsettled sells, securitized debt, and any net TBA position (at cost). Total financing excludes any financing arrangements and unsettled trades on U.S. Treasuries.
NYSE: MITT 26Footnotes (cont’d)
8. The yield on our debt investments represents an effective interest rate, which utilizes all estimates of future cash flows and adjusts for actual prepayment and cash flow activity as of quarter-end. The yield on our SFR
portfolio represents annualized net operating income for the quarter divided by its carrying value, gross of accumulated depreciation and amortization. Net operating income on our SFR portfolio is comprised of rental income
and other SFR related income less property operating expenses. Our calculation excludes cash held by the Company and excludes any net TBA position. The calculation of weighted average yield is weighted based on
net carrying value.
9. The cost of funds during the quarter is calculated by annualizing the sum of our interest expense and net interest component on all derivative instruments and dividing that sum by our daily weighted average total financing
for the period. Interest earning/paying derivative instruments may include interest rate swaps and U.S. Treasuries. The cost of funds at quarter-end is calculated as the sum of (i) the weighted average funding costs on
total financing outstanding at quarter-end and (ii) the weighted average of the net pay rate on our interest rate swaps, the net receive rate on our Treasury long positions, the net pay rate on our Treasury short positions
and the net receivable rate on our IO index derivatives, if any. Both elements of the cost of funds at quarter-end are weighted by the outstanding financing arrangements and securitized debt outstanding at quarter-end,
excluding financing arrangements associated with U.S. Treasury positions. The cost of funds excludes any net TBA position.
10. The Company allocates its equity by investment using the fair market value of our investment portfolio, less any associated leverage, inclusive of any long TBA position (at cost). The Company allocates all non-investment
portfolio related items based on their respective characteristics, beginning by allocating those items within the Securities and Loans Segment and Single-Family Rental Properties Segment and then allocating Corporate
between the Securities and Loans Segment and Single-Family Rental Properties Segment in order to sum to stockholders’ equity per the consolidated balance sheets. The Company's equity allocation method is a non-
GAAP methodology and may not be comparable to the similarly titled measure or concepts of other companies, who may use different calculations and allocation methodologies.
11. This represents the weighted average monthly CPRs published during the quarter for our in-place portfolio during the same period. Any net TBA position is excluded from the CPR calculation.
12. Equity residuals, excess MSRs and principal only securities with a zero coupon rate are excluded from this calculation. The calculation of weighted average coupon is weighted based on face value.
13. The Company invests in Arc Home LLC through AG Arc LLC, one of its indirect subsidiaries.
14. The Company estimates duration based on third-party models. Different models and methodologies can produce different effective duration estimates for the same securities. We allocate the net duration by asset type
based on the interest rate sensitivity. Duration includes any net TBA position. Duration does not include our equity interest in AG Arc LLC or our investment in SFR. Duration related to financing agreements is netted within
its respective agency and credit line items.
15. Operating margin on our SFR portfolio is calculated as net operating income divided by revenues from our SFR portfolio adjusted for rent write-offs taken in the relevant quarter. Net operating income on our SFR portfolio
is comprised of rental income and other SFR related income less property operating expenses.
16. The other operating expenses (corporate) percentage during the quarter is calculated by annualizing the other operating expenses (corporate) recorded during the quarter and dividing by our weighted average stockholders’
equity for the quarter. The other operating expenses (corporate) percentage at quarter-end is calculated by annualizing other operating expenses (corporate) recorded during the quarter and dividing by quarter-end
stockholders’ equity.
NYSE: MITT 27www.agmit.com
You can also read