Housing Development Finance Corporation Limited - HDFC Ltd
←
→
Page content transcription
If your browser does not render page correctly, please read the page content below
Housing Development Finance
Corporation Limited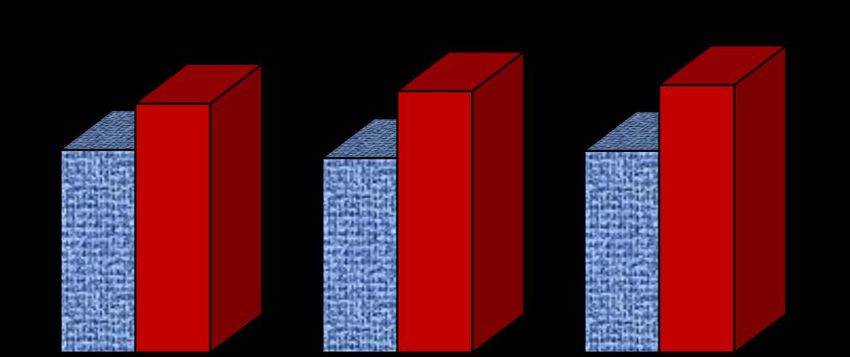
CONTENTS
• HDFC Snapshot

• Mortgage Market in India

• Operational and Financial Highlights: Mortgages

• Shareholding

• Financials: Standalone

• Key Subsidiaries and Associates

• Financials: Consolidated

• Environmental, Social & Governance                2
HDFC SNAPSHOT

HDFC Snapshot

•    Incorporated in 1977 as the first
                                               WHO WE ARE…
     specialised mortgage company in India                                        Market capitalisation*:
•    Now a Financial Conglomerate with                                                     US$ 61 bn

     interests beyond mortgages
•    73% shares held by Foreign Investors

                         21.12%                             49.96%                                            52.68%                               49.86%

                       Market capitalisation*:                   Market capitalisation*:
                            US$ 112 bn                                US$ 19 bn                           Market capitalisation*:
                                                                                                                US$ 8 bn
                                                              Ranks 2nd in individual
                         ADRs listed on NYSE                                                                                               Ranks amongst the top 3 private
                                                            weighted received premium                  Amongst the largest AMCs with         players in general insurance
                                                             amongst private players                     total AUM of US$ 56 bn

                                      100%                                        100%                                   100%

                                                                                                                                    HDFC Capital
                                                                                                                                      Advisors
                               Financial services distribution                                                     Property funds with AUM of
                                          company                                                                  ~US$ 2.2 bn; of which US$
                                 Sources more than half of                India's first dedicated education
                                                                                                                     1.1 bn is committed for
                                    HDFC’s home loans                      loan company with outstanding
                                                                                                                   development of affordable
                                                                              loan book of US$ 851 mn
                                                                                                                             housing

    *As at March 31, 2021
    US$ amounts converted based on exchange rate of US$ 1 = Rs. 73.60                                                                                                        4
HDFC Snapshot
BUSINESS SUMMARY
March 2021
• Loans Outstanding (Gross loans) : Rs. 5,698.94 bn
: US$ 77.43 bn
• Individual Loans Originated CAGR (5 years) : 16%
• Cumulative Housing Units Financed : 8.4 million
• Cost to Income Ratio : 7.7%
(excluding notional cost of Employee Stock Option Scheme
& Corporate Social Responsibility Expenses)
• Unaccounted gains on listed investments : Rs. 2,615.90 bn
in subsidiary and associate companies : US$ 35.54 bn
• Consolidated Profit After Tax CAGR (5 years) : 21% 5HDFC Snapshot
IMPACT OF COVID-19
• Individual loan disbursements in FY21
Current Year/Previous Year Q1 FY21 Q2 FY21 Q3 FY21 Q4 FY21
Disbursements 37% 95% 126% 160%
• In H1 FY21, owing to the strict national lockdown, individual disbursements were 35% lower
compared to the corresponding period in the previous year. In H2 FY21, individual disbursements
were 42% higher than the corresponding period in the previous year. Thus, for FY21, individual
disbursements grew by 3%.
• Owing to the uncertain environment, the Corporation maintained higher levels of liquidity which had
the impact of negative carry.
• Total provisions carried as at March 31, 2021 stood at Rs 130.25 billion compared to the regulatory
requirement of Rs 54.91 billion (based on period of default and standard assets)
• COVID-19 provision as at March 31, 2021 stood at Rs 8.44 billion.
• Scale up on all digitalisation platforms for borrowers, depositors, channel partners and deposit
agents, amongst others.
• Since April 2021, India has been witnessing an eruption of a second wave of infections.
• There continues to be a great deal of uncertainty on the duration and intensity of the second
wave. 6MORTGAGE MARKET IN INDIA
Mortgage Market in India

   DRIVERS OF MORTGAGE GROWTH
    • Improved Affordability

    • Low Penetration

    • Government Incentives
      • Enhanced Fiscal Benefits
      • Credit Linked Subsidy Scheme

    • Other Demand Drivers
                                       8
Mortgage Market in India
IMPROVED AFFORDABILITY
60
Best affordability in 2.5 decades. 18.00
Government support towards housing has helped improve affordability.
16.00
50
Property Value (Rs. 100,000) &
14.00
Annual Income (Rs. 100,000)
40 12.00
Affordability
10.00
30
8.00
22.0
20 15.6 6.00
11.1
8.3 6.6
4.00
10 5.9 5.3 5.1 4.7 4.3 4.7 5.0 5.1 5.1 4.7 4.8 4.6 4.7 4.6 4.4 4.1
4.5
3.8 3.7 3.5
3.3 3.2 2.00
0 0.00
Property Cost Affordability Annual Income
Representation of property price estimates Affordability equals property prices by annual income
Based on customer data 9Mortgage Market in India
LOW PENETRATION IMPLIES ROOM FOR GROWTH
MORTGAGES AS A PERCENT OF NOMINAL GDP
100%
89%
83%
80%
68%
60% 52% 56%
45%
44%
39%
40% 34%
18% 20%
20%
11%
0%
Source: European Mortgage Federation, Hofinet & HDFC estimates for India.
Note: India’s lower GDP resulted in an increase in the mortgage to GDP ratio.
10Mortgage Market in India
GOVERNMENT/REGULATORY INITIATIVES
Government Liquidity Supply Side
Incentives Measures Incentives
Incentives to
Tax incentives on developers to build
interest and principal affordable housing
amount for home Liquidity schemes
loan borrowers and special refinance
‘Infrastructure’ status
facilities for Non-
accorded to affordable
Banking Financial
Interest rate subsidy housing
Companies - Housing
under the Credit Finance Companies External Commercial
Linked Subsidy
Borrowings/Rupee
Scheme for EWS/LIG*
Denominated Bonds
Issued Overseas
Economically Weaker Section (EWS): Income up to Rs 0.3 mn p.a ; Low Income Group (LIG): Income above Rs 0.3 mn to Rs 0.6 mn p.a.
11Mortgage Market in India
TAX INCENTIVES HAVE LOWERED THE EFFECTIVE
RATES ON MORTGAGES
FY 2021 FY 2002 FY 2000
Loan amount 29,50,000 29,50,000 29,50,000
Nominal Interest Rate(%) 6.75% 10.75% 13.25%
Max deduction for interest allowed 2,00,000 1,50,000 75,000
Deduction on principal 1,50,000 20,000 20,000
Tax rate 30.90% 31.50% 34.50%
Tenor (years) 20 20 20
Total amount paid per year 3,49,125 3,59,400 4,21,068
Interest component 1,99,125 3,17,125 3,90,875
Principal repaid 1,50,000 42,275 30,193
Tax amount saved 1,08,150 53,550 32,775
Effective interest paid on home loan 90,975 2,63,575 3,58,100
Effective interest on home loan 3.1% 8.9% 12.1%
Note: Union Budget 2021-22: Additional interest deduction of Rs.1.5 lac for loans sanctioned from April 1, 2021
to March 31, 2022. This is for first-time home-buyers; house cost: up to Rs 450,000. 12Mortgage Market in India
OTHER DEMAND DRIVERS
• Favourable Demographics: 66% of India’s population is
below 35 years of age, hence large potential for home loans
• Nuclear Households: Rise in the number of households with
a shift towards nuclear families
• Urbanisation: Currently 32% of the Indian population reside
in cities; estimated to be 50% by 2030
• Interest Rates: Improved affordability through rising
disposable incomes and lowest ever interest rates on home
loans
13OPERATIONAL & FINANCIAL HIGHLIGHTS: MORTGAGES
Operational & Financial Highlights: Mortgages
CORE BUSINESS – LENDING
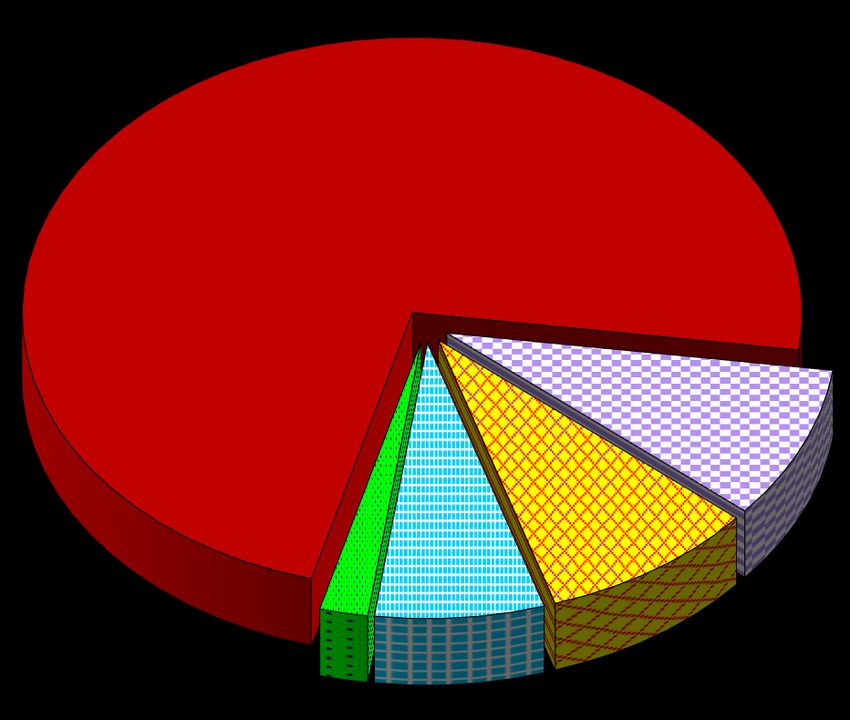
(As at March 31, 2021: Gross Loans - US$ 77.43 bn)
INDIVIDUAL LOANS Individuals 77%
– Home Loans
• Fixed rate loans Corporate 6%
• Floating rate loans
– Home Improvement Construction
Loans Finance 10%
– Home Extension Loans
– Home Equity Loans
Lease Rental
– Rural Home Loans
– Loans to NRIs
Discounting 7%
As at March 31, 2021 Loan Book Outstanding Loan Book o/s Before Sell Down Assets Under Management
(After Sell Down) in last 12 months
Rs. bn US$ bn % Growth Rs. bn US$ bn % Growth Rs. bn US$ bn % Growth
Individuals 3,688 50 13% 3,878 53 19% 4,402 60 12%
Non-Individuals 1,295 18 4% 1,295 18 4% 1,297 17 4%
Total 4,983 68 11% 5,173 71 15% 5,699 77 10%
Individual loans sold (outstanding): Rs. 714.21 bn (US$ 9.70 bn) 15Operational & Financial Highlights: Mortgages
AFFORDABLE HOUSING
Housing Loan Approvals Based on Income Slabs FY21
In Value terms In Number terms
HIG 40% HIG 19%
MIG 48%
EWS 2%
EWS 6%
LIG 14%
MIG 44% LIG 27%
Economically Weaker Section: Up to Rs 0.3 mn p.a Low Income Group: Above Rs 0.3 mn to Rs 0.6 mn p.a.
Middle Income Group: Above Rs 0.6 mn to Rs 1.8 mn p.a. High Income Group: Above Rs 1.8 mn p.a.
Housing Loans to EWS & LIG Segments
• 33% of home loan approvals in volume terms has been to the EWS & LIG segments and
16% in value terms
• Average home loan – EWS: Rs 1.08 mn, LIG: Rs 1.86 mn
Credit Linked Subsidy Scheme (CLSS): HDFC has the highest number of beneficiaries at
233,000, with cumulative disbursements of Rs 393 bn and a subsidy amount of Rs 52 bn. 16Operational & Financial Highlights: Mortgages
83% OF OUR MORTGAGES ARE SOURCED BY
OURSELVES OR THROUGH OUR AFFILIATES
March 31, 2021
Other Direct
Selling Agents
17%
HDFC Bank 27%
Direct Walk-ins
2%
HDFC Sales
Private Limited
54%
Deposit & loan products offered at several locations through outreach programmes.
Total number of offices: 593 which is inclusive of 203 outlets of HDFC’s wholly owned distribution company. 17Operational & Financial Highlights: Mortgages
INDIVIDUAL LOANS FY21 *
Employment Acquisition Mode Geographic Spread
Self –Employed
(incl: professionals) Re-sale
East South
37%
22% 32%
4%
8%Self-
27%
Construction
78%
55% 37%
North
West
Employed
First Purchase
* Based on value of approvals 18Operational & Financial Highlights: Mortgages
OUR CONSERVATIVE LOAN PROFILE
UNDERLIES OUR HIGH CREDIT QUALITY
• Average Loan Size : Rs. 2.95 mn (~US$ 40,000)
• Average Loan to Value : 69% (at origination)
• Average Loan Term : 11 years
• Average Age : 38 years
• Primary Security : Mortgage of property financed
• Repayment Type : Amortising
19Operational & Financial Highlights: Mortgages
NON-PERFORMING LOANS (NPLs) &
PROVISIONS CARRIED
2.44% 2.56% 2.62%
3.00% As at March 31, 2021
1.99% 1.91% 1.98%
2.50% (Rs. in bn)
2.00%
Percentage
1.50% NPLs (3 months): 97.59
1.00%
0.50% Provisions Carried: 130.25
0.00%
Mar-20 Dec-20 Mar-21 Regulatory provision as per
period of default & standard
GROSS NPLs PROVISIONS CARRIED AS % OF EAD* assets: 54.91
NPLs March 31, 2021 March 31, 2020
Individual Loans 0.99% 0.95%
Non-Individual Loans 4.77% 4.71%
Overall NPLs 1.98% 1.99%
*EAD: Exposure at Default
20Operational & Financial Highlights: Mortgages
EXPECTED CREDIT LOSS (ECL) BASED ON EXPOSURE
AT DEFAULT (EAD) Rs bn
As per IND AS Mar-21 Dec-20 Mar-20
Gros s Stage 1 4,540.29 4,375.07 4,158.64
ECL Provi s i on Stage 1 10.87 8.92 3.46
Net Stage 1 4,529.42 4,366.15 4,155.18
Coverage Rati o % Stage 1 0.24% 0.20% 0.08%
Gros s Stage 2 315.47 342.08 247.94
ECL Provi s i on Stage 2 58.81 60.08 57.50
Net Stage 2 256.66 282.00 190.44
Coverage Rati o % Stage 2 19% 18% 23%
Gros s Stage 3 116.32 110.02 102.73
ECL Provi s i on Stage 3 60.57 54.42 48.92
Net Stage 3 55.75 55.60 53.81
Coverage Rati o % Stage 3 52% 49% 48%
EAD 4,972.08 4,827.17 4,509.31
ECL Provi s i on 130.25 123.42 109.88
Net 4,841.83 4,703.75 4,399.43
ECL/EAD 2.62% 2.56% 2.44%
Note: Loans under the one-time restructuring framework due to COVID-19 stress and Emergency Credit
Line Guarantee Scheme are classified under Stage 2. 21Operational & Financial Highlights: Mortgages
MULTIPLE SOURCES OF BORROWINGS
(As at March 31, 2021: Total Borrowings - US$ 59.97 bn)
4% 4% 3%
100%
80% External Commercial Borrowings
43% 42%
50%
Percentage
Debentures & Securities
60%
Term Loans
21% 21%
40% 17% Deposits
20% 34%
29% 32%
0%
Mar-19 Mar-20 Mar-21
Total Borrowings: Rs 4,413.65 bn (US$ 59.97 bn)
22Operational & Financial Highlights: Mortgages
LOAN SPREADS
12.00% 2.40%
10.29% 10.18%
9.76%
10.00% 8.99% 2.35%
2.30%
2.29%
8.00% 2.27% 2.30%
2.29%
6.00% 2.25%
4.00% 7.99% 7.91% 2.20%
7.47% 6.70%
2.00% 2.15%
0.00% 2.10%
FY18 FY19 FY20 FY21
Return on Loans Cost of Borrowings Spread
FY21
Spread earned on:
Individual Loans 1.93%
Non-individual Loans 3.22%
Loan Book 2.29%
23Operational & Financial Highlights: Mortgages
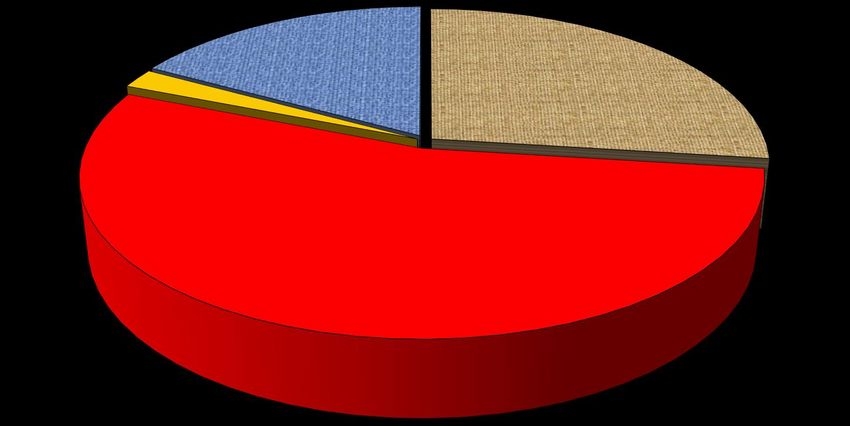
MATURITY PROFILE
(As at March 31, 2021)
3,000 2,705
2,443
2,500 2,230
Rs. in billion
2,000 1,837
1,500 1,264
1,133
1,000
500
0
Up to 1 yr >1-5 yrs Over 5 yrs
Assets Liabilities
The above graph reflects adjustments for prepayments and renewals in accordance with the
guidelines issued by National Housing Bank.
24Operational & Financial Highlights: Mortgages
PRODUCTIVITY RATIOS
FY21 FY20
Number of employees 3,226 3,095
Number of outlets 390 379
Profit per employee (US$* '000)* 468 407
Assets per employee (US$ mn) 23.2 22.1
^
Admin costs/assets (%)^ 0.21 0.24
Cost income ratio (%)^ 7.7 9.0
*To make ratios comparable, profit on sale of strategic investments have not been considered.
^Excluding notional cost of ESOS and CSR expenses
25Operational & Financial Highlights: Mortgages
KEY FINANCIAL METRICS
FY21 FY20
Net Interest Margin(%) 3.5 3.4
Pre Tax RoAA (%)^ 2.6 2.5
Post Tax RoAA (%)^ 2.1 2.0
Return on Equity (%)* 12.3 21.7
Return on Tier 1 Capital (%) 14.8 14.8
Capital Adequacy (%) 22.2 17.6
Of which Tier I (%) 21.5 16.5
Tier II (%) 0.7 1.1
^Adjusted for profit on sale of investments of strategic investments
* In FY20, GRUH Finance merged with Bandhan Bank. As per IndAS, the Corporation had on derecognition
of the investment in GRUH, recorded a fair value gain of Rs 90.20 billion through the Statement of Profit
and Loss of FY20. 26VALUATION & SHAREHOLDING
Valuation and Shareholding

                VALUATION – METHOD 1
    • Number of shares outstanding: 1.80 billion
    • Share Price (CMP as at March 31, 2021): Rs. 2,499
    • Market Capitalisation: Rs. 4,508.1 billion (~US$ 61 bn)

                                                 Rs bn          US$ bn
     Net Worth                                      1,088          14.8
     Add: Unaccounted gains on                      2,616          35.5
     strategic listed investments
     Add: Unaccounted gains on                         205          2.8
     unlisted investments
     Adjusted Networth                               3,909         53.1

     Market Capitalisation                           4,508         61.3

     Adjusted Price to Book Ratio                      1.2          1.2
Valuation and Shareholding
VALUATION – METHOD 2
• Number of shares outstanding: 1.80 billion
• Share Price (CMP as at March 31, 2021): Rs. 2,499
• Market Capitalisation: Rs. 4,508.1 billion (~US$ 61 bn)
Valuation Rs bn US$ bn
Market Capitalisation 4,508 61.3
Less: Unaccounted gains on strategic 2,616 35.5
listed investments
Less: Unaccounted gains on unlisted 205 2.8
investments
Adjusted Market Capitalisation 1,687 22.9
Net Worth 1,088 14.8
Adjusted Price to Book Ratio 1.6 1.6Valuation and Shareholding
SHAREHOLDING PATTERN
As at March 31, 2021
73% Foreign Shareholders - 73%
Individuals - 9%
Mutual Funds - 9%
Financial Institutions, Banks &
9% Insurance Companies - 7%
9% Companies - 2%
2% 7%
30FINANCIALS
Standalone
(Based on Indian Accounting Standards)Financials: Standalone
BALANCE SHEET
Mar-21 Mar-20 Growth
(Rs in billion) (Rs in billion) (%)
Sources of Funds
Shareholders' Funds 1,087.83 861.58
Borrowings 4,413.65 4,191.02 5%
Current Liabilities & Provisions 174.51 188.34
5,675.99 5,240.94 8%
Application of Funds
Loans^ 4,982.98 4,509.03 11%
Investments 686.37 649.44
Current/ Fixed Assets 6.64 82.47
5,675.99 5,240.94 8%
^Net of loans sold during the preceding 12 months amounting to Rs 189.80 billion of individual loans. If these
loans were included, the growth in loans would have been 15%.
32Financials: Standalone
STATEMENT OF PROFIT AND LOSS – Q4FY21
Jan-Mar-21 Jan-Mar-20 Growth
(Rs i n bi l l i on) (Rs i n bi l l i on) (%)
Interest Income 106.31 112.26
Interest Expenses 65.66 76.62 -14%
Net Interest Income 40.65 35.64 14%
Add: Net gain on derecognition of assigned loans 4.38 2.38
Add: Fees Net of Commission (EIR) (0.38) (0.21)
Add: Other Operating Income 0.90 1.01
Net Operating Income 45.55 38.82 17%
Less: Non Interest Expenses 3.07 3.00
Less: Amortisation of ESOS and CSR Expenses 1.92 0.53
Add: Other Income 0.10 0.06
Profit Before Sale of Investments, Dividend, Fair Value
40.66 35.35 15%
Changes and ECL
Add: Net gain/(loss) on Fair Value Changes 4.66 4.28
Add: Dividend 1.11 0.02
Add: Profit on Sale of Investments - 0.02
Less: Expected Credit Loss (ECL) 7.19 12.74
Profit Before Tax 39.24 26.93 46%
Provision for Tax 7.44 4.60
Profit After Tax Before Other Comprehensive Income 31.80 22.33 42%
Other Comprehensive income (12.05) (60.12)
Total Comprehensive Income 19.75 (37.79)
Effective tax rate (%) 19.0% 17.1%Financials: Standalone
ANALYSIS OF PROFITS – Q4 FY21
Q4 FY21 Q4 FY20 Growth
Rs in billion Rs in billion
Reported Profit Before Tax 39.24 26.93 46%
Less
Dividend 1.11 0.02
Profit on Sale of Investments - 0.02
Net gain on Fair Value Changes 4.66 4.28
Net gains on loans assigned 4.37 2.38
Add
Employee Stock Options 1.44 0.02
Expected Credit Loss 7.19 12.74
Adjusted Profit Before Tax 37.73 32.99 14%
34Financials: Standalone
STATEMENT OF PROFIT AND LOSS – FY21
FY21 FY20 Growth
(Rs in billion) (Rs in billion) (%)
Interest Income 437.87 439.05
Interest Expenses 286.15 310.01 -8%
Net Interest Income 151.72 129.04 18%
Add: Net gain on derecognition of assigned loans 11.90 9.68
Add: Fees net of Commission (EIR) (2.02) (1.56)
Add: Other Operating Income 2.87 2.98
Net Operating Income 164.47 140.14 17%
Less: Non Interest Expenses 12.70 12.73
Less: Amortisation of ESOS and CSR Expenses 5.28 2.25
Add: Other Income 0.26 0.24
Profit Before Sale of Investments, Dividend, Fair Value 146.75 125.40 17%
Changes and ECL
Add: Net gain/(loss) on Fair Value Changes 9.56 0.99
Add: Gain on Scheme of Amalgamation - 90.20
Add: Dividend 7.34 10.81
Add: Profit on Sale of Investments 13.98 35.24
Less: Expected Credit Loss (ECL) 29.48 59.13
Profit Before Tax 148.15 203.51
Provision for Tax 27.88 25.81
Profit After Tax Before Other Comprehensive Income 120.27 177.70
Other Comprehensive income 17.35 (66.53)
Total Comprehensive Income 137.62 111.17
Effective tax rate (%) 18.8% 12.7%
Note: Profit numbers are not comparable with that of the previous year. The merger of GRUH Finance with Bandhan Bank was
effective October 17, 2019. As per IndAS, the Corporation had on derecognition of the investment in GRUH, recorded a fair
value gain of Rs 90.20 billion through the Statement of Profit and Loss of FY20. 35Financials: Standalone
ANALYSIS OF PROFITS – FY21
FY21 FY20 Growth
Rs in billion Rs in billion
Reported Profit Before Tax 148.15 203.51 -27%
Less
Dividend 7.34 10.81
Profit on Sale of Investments 13.98 35.24
Net gain on Fair Value Changes 9.56 0.99
Gain on Scheme of Amalgamation - 90.20
Net gains on loans assigned 11.90 9.68
Add
Employee Stock Options 3.38 0.14
Expected Credit Loss 29.48 59.13
Adjusted Profit Before Tax 138.23 115.86 19%
36KEY ASSOCIATES AND SUBSIDIARIES
Associates and Subsidiaries

  •   21.1% owned by HDFC
                                     HDFC BANK
  •   ADRs listed on NYSE
  •   5,608 banking outlets, 16,087 ATMs
  •   Key business areas
       – Wholesale banking            Retail banking         Treasury operations
  •   Financials (as per Indian GAAP) for the year ended March 31, 2021
       – Advances as at March 31, 2021, stood at Rs. 11,328 bn – an increase of 14% over the
           previous year
       – Total deposits stood at Rs. 13,351 bn – an increase of 16% over the previous year
       – PAT (Indian GAAP): Rs. 311.17 bn – an increase of 19% over the previous year
  •   Arrangement between HDFC & HDFC Bank
       –   HDFC Bank sources home loans for a fee

       –   Loans originated in the books of HDFC

       –   HDFC offers a part of the disbursed loans for assignment to HDFC Bank (up to 70% of loans
           sourced by HDFC Bank)

       –   HDFC retains a spread on the loans that have been assigned

  •   Market Capitalisation (March 31, 2021): ~US$ 112 bn                                              38
Associates and Subsidiaries
HDFC LIFE INSURANCE COMPANY LIMITED
(HDFC LIFE)
• 49.96% owned by HDFC and Standard Life (Mauritius Holdings) 2006 Limited holds 8.9% of the equity
of HDFC Life.
• Total premium income for the year ended March 31, 2021 stood at Rs. 386 bn – growth of 18% over
the previous year
• HDFC Life ranked 2nd in terms of Individual WRP with private market share of 16%. The private
market share within the group and overall new business segment stood at 28% and 22%
respectively.
– New Business Margin for the year ended March 31, 2021 (post overrun): 26.1% (PY: 25.9%)
– Indian Embedded Value stood at Rs. 266.2 bn as at March 31, 2021 (PY: Rs. 206.5 bn)
– Operating Return on Embedded Value for the year ended March 31, 2021 stood at 18.5% (PY:
18.1%)
– Assets Under Management as at March 31, 2021 stood at Rs. 1,738 bn (PY: Rs. 1,272 bn)
– PAT for the year ended March 31, 2021 (Indian GAAP): Rs. 13.60 bn (PY: Rs. 12.95 bn)
• Product mix - Unit Linked: 24%, Non-Par Savings: 31%, Par Protection: 34%, Term & Health: 7%,
Annuity: 4%
• Market capitalisation (March 31, 2021): ~US$ 19 bn 39Associates and Subsidiaries
HDFC ASSET MANAGEMENT
• 52.7% owned by HDFC and Standard Life Investments holds 21.2% of the equity of
HDFC Asset Management.
• Quarterly Average Assets under Management (QAAUM) as at March 31, 2021, stood at
Rs. 4.16 trillion (US$ 56 bn) with an overall market share of 12.9%
• India’s largest actively managed equity mutual fund with a market share of 13.3% as
on March 31, 2021
• Equity-oriented assets of HDFC MF as a proportion of total AUM was 43%
• Individual accounts of HDFC MF as at March 31, 2021
• 9 million live accounts
• 58% of total monthly average AUM is contributed by individuals
• Market share of 13.7% of individual monthly average AUM
• PAT for the year ended March 31, 2021 (as per Ind AS): Rs. 13.3 bn
• Market capitalisation (March 31, 2021): ~US$ 8 bn
40Associates and Subsidiaries
HDFC ERGO GENERAL INSURANCE COMPANY LTD.
• HDFC holds 49.86% and ERGO holds 41.80% and Munich Health Holding AG holds 7.20%
of the equity of HDFC ERGO General Insurance Company Limited (HDFC ERGO)
• During the year ended March 31, 2021, following the receipt of requisite approvals, HDFC
ERGO Health Insurance Limited (formerly Apollo Munich Health Insurance Company
Limited) merged with HDFC ERGO General Insurance Company Limited (HDFC ERGO).
The appointed date of the Scheme of Amalgamation for the merger is March 1, 2020.
• Gross direct premium for the year ended March 31, 2021 stood at Rs. 123 bn
• Products: Motor, health, travel, home and personal accident in the retail segment;
property, marine, aviation and liability insurance in the corporate segment and crop
insurance in the rural segment
‒ Retail accounts for 62% of the total business
• Market share of 10.8% (private sector) and 6.2% (overall) in terms of gross direct premium
for the year ended March 31, 2021 (Source: GI Council)
• As at March 31, 2021: Combined Ratio – 103.2%, Solvency Ratio – 190% (as against
regulatory requirement of 150%)
• Profit After Tax for the year ended March 31, 2021 (Indian GAAP): Rs. 5.92 bn
41Associates and Subsidiaries
PROPERTY FUNDS
HDFC PROPERTY VENTURES HDFC CAPITAL ADVISORS
• HDFC India Real Estate Fund International LLC • HDFC Capital Affordable Real Estate Fund (HCARE)
comprises two funds: – Set up as a SEBI registered AIF in 2016
• HIREF International LLC – HCARE 1 & 2 together create a US$ 1.1 bn platform
– Launched in 2007 targeting affordable & mid-income residential
– Fund corpus : US$ 800 million projects
– Fund has made 14 investments – The objective is to provide long-term equity and
– 9 exits have been made and the Fund is in the mezzanine capital to developers building affordable
process of exiting from the balance and middle- income housing across India’s leading
investments; 20 cities
– Primary investors in HCARE 1 & 2 is a wholly owned
• HIREF International LLC II Pte Ltd.
– Fund corpus: US$ 321 million subsidiary of Abu Dhabi Investment Authority (ADIA)
– Final close in April 2015 along with the National Investment and Infrastructure
– International investors, 8 year close-ended fund Fund (NIIF) in HCARE-2
– Fund has made 10 investments of which 3 – HDFC Capital Advisors is the investment manager
investments have been profitably exited for the funds and is one of the largest real estate
fund managers in the country
– Also an investment advisor to a special situations
fund focused on high yield opportunities in the
Indian residential real estate sector.
42Associates and Subsidiaries
HDFC CREDILA
• HDFC holds 100% in HDFC Credila
• HDFC Credila is a non-banking finance company and was the first Indian lender to
exclusively focus on education loans
• The company lends to under-graduate and post-graduate students studying in India or
abroad
• As at March 31, 2021
– Profit After Tax (as per Ind AS): Rs. 1.55 bn – 26% growth
– Cumulative loans disbursed: Rs 121 bn
– Loan book outstanding as at March 31, 2021: Rs. 63 bn
• 42% of the loan book is collateralised
– Average loan: Rs. 2.7 mn
– Gross non-performing assets: 0.26%
43FINANCIALS
Consolidated
(Based on Indian Accounting Standards)Financials: Consolidated
BALANCE SHEET (Consolidated)
FY21 FY20 Growth
(Rs in billion) (Rs in billion) (%)
Sources of Funds
Shareholders' Funds 1,656.17 1,338.36 24%
Liabilities Pertaining to Insurance Business 1,952.42 1,484.30 32%
Loan Funds 4,470.13 4,253.68 5%
Current Liabilities & Provisions 214.83 221.81
8,293.55 7,298.15 14%
Application of Funds
Loans 4,909.48 4,454.69 10%
Assets pertaining to Insurance Business 2,071.39 1,571.95 32%
Investments 1,107.94 999.11 11%
Current Assets, Advances & Fixed Assets 188.73 256.39
Goodwill on Consolidation 16.01 16.01
8,293.55 7,298.15 14%
45Financials: Consolidated
STATEMENT OF PROFIT AND LOSS – FY21
Rs. billion
Mar-21 Mar-20 Growth
Interest & Other Operating Income 473.36 486.47
Income from Insurance Business 886.25 424.56
Profit on Sale of Investment Properties (0.02) 0.35
Profit on Loss of Control of a subsidiary - 97.99
Net gain on fair value change 19.72 (1.80)
Net gain on derecognition of assigned loans 11.03 9.68
Other Income 0.37 0.70
Total Income 1,390.71 1,017.95 37%
Finance costs 290.81 321.09
Expenses from Insurance Business 865.84 405.52
Non-Interest Expenses 30.59 27.36
Impairment on financial instruments 30.31 59.51
Total Expenses 1,217.55 813.48 50%
Share of profit of associates (equity method) 69.21 57.46
Profit before tax 242.37 261.93
Total tax expense 37.49 33.67
Net Profit After Tax 204.88 228.26
Other Comprehensive Income 15.82 (62.13)
Total Comprehensive Income 220.70 166.13
Profit Attributable to the Corporation 187.40 214.35
Note: During FY20, GRUH was amalgamated with Bandhan Bank which resulted in a gain of Rs 98 billion in the P&L A/c.
46CONSOLIDATED PROFIT AFTER TAX – Q4 FY21
(As per Ind-AS)
FY21 FY20 Growth
(Rs in billion) (Rs in billion)
HDFC Profit After Tax 31.80 22.33 42%
HDFC Life 1.35 0.81
HDFC Ergo 0.47 1.20
HDFC Bank 17.99 15.42
HDFC AMC 1.66 1.31
HDFC Credila 0.44 0.24
GRUH Finance - 0.30
Property Funds (incl GRIHA) 0.73 0.17
HDFC Invt & HDFC Holdings 0.06 0.10
HDFC Edu, Sales, Property Cos, Others 0.34 (0.10)
Adjustments:
Adjustment on account of dilution of stake in 1.19 0.77
associates
Elimination of Profit from Sale of Investments - -
Dividend & Other Adjustments (2.53) (1.39)
Net Profit Attributable to the Corporation 53.50 41.16 30%Financials: Consolidated
CONSOLIDATED PROFIT AFTER TAX – FY21
(As per Ind-AS)
FY21 FY20
(Rs in billion) (Rs in billion)
HDFC Profit After Tax 120.27 177.70
HDFC Life 8.45 5.88
HDFC Ergo 3.36 2.74
HDFC Bank 66.51 54.39
HDFC AMC 6.98 6.38
HDFC Credila 1.55 1.15
GRUH Finance - 1.10
Property Funds (incl GRIHA) (0.31) 0.19
HDFC Invt & HDFC Holdings 0.24 3.17
HDFC Edu, Sales, Property Cos, Others 0.08 (0.16)
Adjustments: - -
Adjustment on account of dilution of stake in 2.81 2.97
associates
Elimination of Profit from Sale of Investments (13.76) (27.42)
Dividend & Other Adjustments (8.78) (13.74)
Net Profit Attributable to the Corporation 187.40 214.35
48Financials: Consolidated
CONSOLIDATED EARNINGS
As per Ind-AS
(As at March 31, 2021)
HDFC Consolidated
Return on Equity 12.3% 13.7%
Return on Average Assets 2.3% 2.6%
Earnings per share (Rs) 68 107
Profit After Tax (Rs in bn) 120.27 204.88
Total Assets (Rs in bn) 5,675.99 8,293.55
49ESG & OTHER INITIATIVES
ESG & Other Initiatives

THE ESG WAY: ENCOMPASSING ALL STAKEHOLDERS
            ENVIRONMENTAL                                      SOCIAL                                  GOVERNANCE
 •   MSCI ESG Ratings – HDFC’s                •   Shelter Assistance Reserve created in    •   Founding principles of kindness,
     environmental impact: minimal                1987: Set aside a portion of profits         fairness, efficiency & effectiveness
                                                  each year to support socially high
 •   Long-term commitment to finance              impact projects                          • Recent Awards for Governance -
     affordable & green housing                                                                  Golden Peacock Award for
                                              •   Cumulatively financed 8.4 million              Excellence in Corporate
 •   Focus on responsible lending                 housing units                                  Governance 2020

 •   2/3rd of lease rental discounting        •   Focus on inclusion & diversity;                Governance QualityScore of 1 by
     portfolio certified as green buildings       employee engagement / training;                ISS: highest quality of
     by the Indian Green Building                                                                governance practices
     Council or the Leadership in Energy      •   First institution to have over 0.23 mn         Best Audit Committee – 2019 by
     and Environmental Design                     beneficiaries under the government’s           the Asian Centre for Corporate
                                                  Credit Linked Subsidy Scheme                   Governance & Sustainability
 •   Supporting programmes for
                                                                                                 Felicitated under the ‘Leadership’
     environmental sustainability,            •   HDFC primarily implements its CSR
                                                                                                 in the Corporate Governance
     recycling, conservation, animal &            initiatives through the H T Parekh
                                                                                                 Score Card, 2020 under a joint
     wildlife protection and the ecology          Foundation, a charitable institution
                                                                                                 initiative by IFC-IiAS-BSE
                                                  set up by HDFC
 •   Employee sensitisation on
     environmental impact; initiatives to     •   CSR focus areas: COVID-19 relief,        •   No promoter holding
     facilitate carbon offsets                    healthcare, education, skilling &
                                                                                           •   Well reputed, independent directors
                                                  livelihoods
                                                                                               since inception; core competencies
 •   Recycling efforts at HDFC – paper,
                                                                                               directly linked to the strategy of
     plastic, wet waste, e-waste
                                                                                               HDFC

                                                                                           •   Undertaken board refreshment

                                                                                                                                      51
ESG & Other Initiatives
ESG REPORTS
• Integrated Report
• Report of Directors on Corporate Governance
• Annual Report on Corporate Social Responsibility (CSR) Activities
• Business Responsibility Report
• HDFC COVID-19 Relief Response: Impact Assessment Report
• Social Initiatives Report
• Independent Review of HDFC’s Sustainability Initiatives
Reports are available on the website:
https://www.hdfc.com/investor-relations#environmental-social-and-governance
52ESG & Other Initiatives
IT & DIGITALISATION INITIATIVES
• Board level Information Technology Committee – comprising two independent directors, a whole-time
director and members of senior management.
• Information Security and Steering Committee monitors the progress of information security and cyber
security.
• Emphasis on regulation and compliance with respect to consent management, data protection &
privacy.
• Online portals for home loan customers, depositors, channel partners and deposit agents - growing
trend of digital on-boarding of customers.
• HDFC’s website in six vernacular languages to serve the needs of customers inTier II and Tier-III cities
and rural areas.
• Advanced conversational chatbot with Natural Language Processing (NLP) and Machine Learning (ML)
technology.
• Using digital and social media marketing strategies and tools to reach out customers.
• Lifecycle management programme for upselling and cross-selling products to HDFC's existing
customers using advanced predictive analytical tools.
53Thank You
May 15, 2021
54You can also read