Investor Presentation - FY2021 First Quarter 1 - Steelcase
←
→
Page content transcription
If your browser does not render page correctly, please read the page content below

Investor
Presentation
FY2021 First Quarter

                       1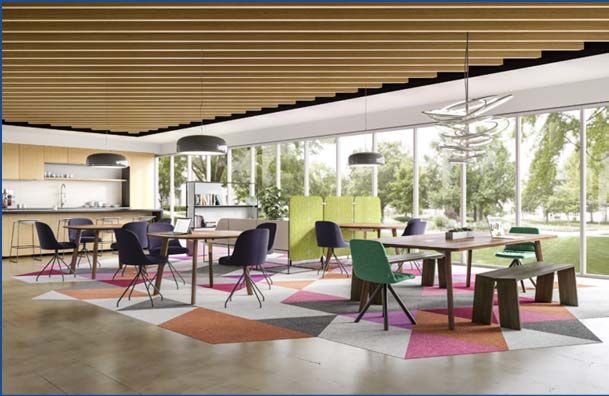
Steelcase Q1, 2021
Investment thesis
Proven track record
We believe the office will continue to be
very relevant
Liquidity position is very strong
Industry leader in a changing workplace
environment
Experienced management team led
company through previous cycles
2
Steelcase Q1, 2021

We are a respected leader

— Greatest global market share
— $3.7 billion revenue in FY2020
— $358 million adjusted EBITDA in FY2020
— 1.4x adjusted total debt/EBITDA (FY2020 year-end)
— ~12,700 employees
— ~800 Steelcase dealer locations
— Recognized for innovative design, sustainability leadership and civic engagement
     — Named one of the World’s Most Admired Companies by Fortune for fourteen years
     — Multinational Finalist in the Circulars Awards – presented by World Economic Forum for circular economy leadership
     — UN Global Compact participant since 2009, member of the CE 100
     — SILQ™ received multiple design and innovation awards, including a Product Design Award in the prestigious Red Dot Awards
     — 100% Corporate Equality Index by the Human Rights Campaign Foundation
     — 2019 Breakfast of Corporate Champions Honored Company by the Women’s Forum on New York
                                                                                                                                  3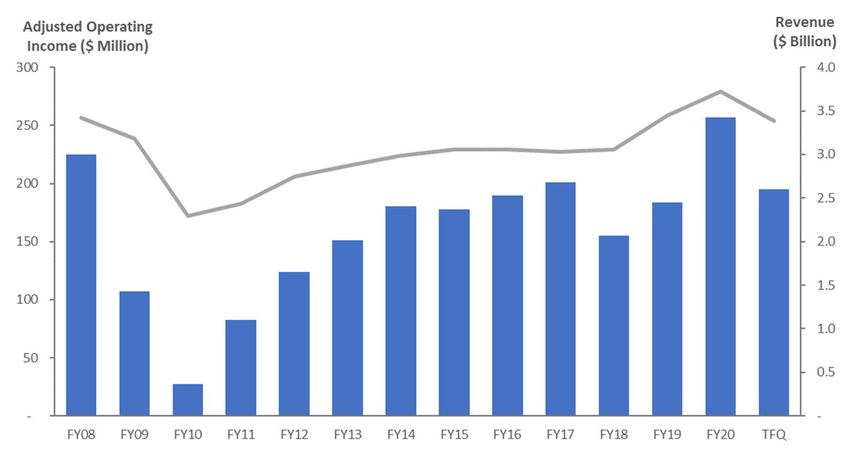
Steelcase Q1, 2021

We have a proven track record of managing through a cycle

                                                              $3.7B
                 $3.4B

                                                      $3.0B

                         $2.3B

                                                                      4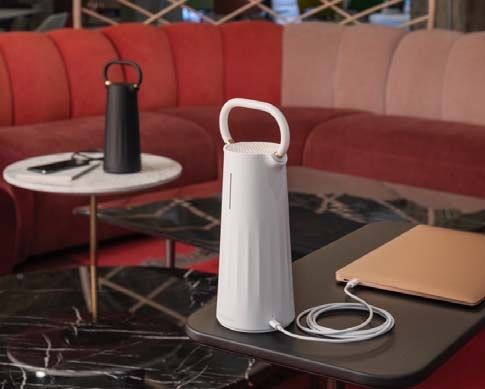
Steelcase Q1, 2021

Our global capability makes us a preferred partner for leading organizations

~800 Steelcase dealer
locations

45 Primary locations
in 17 countries

15 Manufacturing
locations, including
9 outside North America

                                                                               5
Steelcase Q1, 2021

Our global scale makes us a preferred partner for leading organizations

      STEELCASE REVENUE MIX BY SEGMENT                            GLOBAL OFFICE FURNITURE MARKET REVENUE* ($ IN BILLIONS)
                (FY20 Revenue)

                                           $4.0
                                                                                                                          Outside Home Country
                                           $3.5                                                                           Home Country
               Other
              Category
                10%                        $3.0

       EMEA                                $2.5
        18%
                                           $2.0

                                           $1.5
                         Americas
                           72%
                                           $1.0

                                           $0.5

                                           $0.0
                                                      Steelcase        Herman Miller          Haworth     HNI**   Knoll         Kokuyo**    Okamura**

                                         *Most recently published annual data and/or internal estimates
                                         **Only office furniture segments included

                                                                                                                                                 6
Steelcase Q1, 2021

We employ user-based research to drive innovation

                                                           Develop insights on work,          Provide products, strategies
       Create a robust research network
                                                           workers and the workplace            and customer solutions

        Select Research Partners
       — Georgia Tech Manufacturing Institute
       — IDEO
       — Institute for the Future
       — MaRS
       — Michigan State University
       — Microsoft (Research + Global Real Estate                 Six-step research
         & Security + Envisioning Group)                         and design process
       — MIT (Media Lab + Self-Assembly Lab)
       — Ohio State University
       — Seamless
       — Tableau
       — University Florida Health
       — University of Illinois at Chicago- Institute
         for Healthcare Delivery Design
       — University of Melbourne
                                                        Steelcase solutions are based on a
       — University of Michigan
                                                        human-centered design approach that
       — University of Nuremberg-Erlangen
                                                        includes extensive observation and
         MaDLab
                                                        consultation with people who use
       — Virginia Tech
                                                        spaces every day.

                                                                                                                             7
Steelcase Q1, 2021

We serve leading organizations to create places that amplify
the performance of people, teams and enterprise

CORPORATE                                       EDUCATION                              HEALTHCARE

Office construction spending                    Education construction spending        Healthcare construction spending

                                74       79                       97     98       98
              68       69                                  92                                                             44
     56                                                                                                  43     43
                                                    85                                     40     41

   2015     2016     2017     2018     2019        2015 2016 2017 2018 2019               2015   2016   2017 2018     2019

                                                                                                                               8
Source: U.S. Census Bureau (in US $,billions)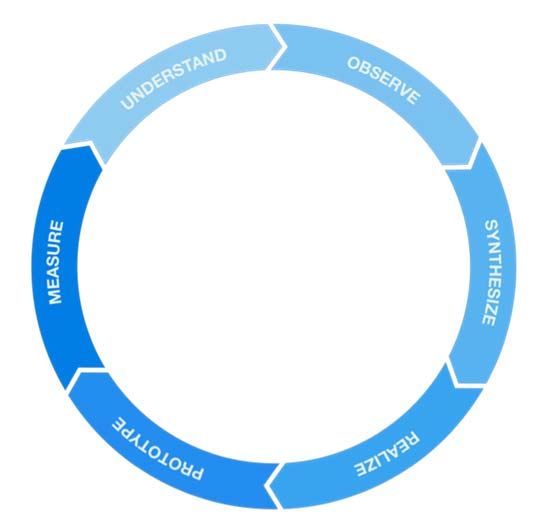
Steelcase Q1, 2021

Sustainability is a lens for innovation and growth contributing
to the financial wellbeing of our company
We deliver meaningful economic, environmental and social impact.

                                                                                               Our Corporate Values
                                                                                               We believe every team
                             32%                          84%                                  member, in every location,
                                                          Decrease in our use of               lives our shared Steelcase
                             Reduction in energy and
                                                          Volatile Organic Compounds           values.
                             greenhouse gas
                             emissions since 2010         (VOCs) since 2010                    Act with integrity
                                                                                               Tell the truth
                                                                                               Keep commitments
                              $6.8 Million                100,000+                             Excel
                              Donated by Steelcase Inc.   Employee volunteer hours             Treat people with dignity
                              and the Steelcase           donated to charitable                and respect
                              Foundation in 2018          organizations and non-
                                                                                               Promote positive
                                                          profits since 2015.
                                                                                               relationships
                                                                                               Protect the environment

                                                                                       Source: 2019 Steelcase Impact Report
                                                                                                                              9
Steelcase Q1, 2021

Our diverse, experienced Board of Directors serve to promote our growth and success

                  Lawrence J. Blanford                     Timothy C.E. Brown                      Connie K. Duckworth                     James P. Keane                       Todd P. Kelsey
                  Retired; formerly                        Executive Chair, IDEO                   Retired; formerly Partner               President and Chief                  President and Chief Executive
                  President and Chief                                                              and Managing Director,                  Executive                            Officer, Plexus Corp.
                  Executive Officer, Green                                                         Goldman, Sachs & Co.                    Officer, Steelcase Inc.
                  Mountain Coffee
                  Roasters, Inc.

        Jennifer C. Niemann                  Robert C. Pew III                     Cathy D. Ross                        Catherine C.B. Schmelter               Peter M. Wege II                   Kate Pew Wolters
        President and Chief                  Chair of the Board of                 Retired; formerly Executive          SVP, Chief Transformation              Chairman of the Board of           Philanthropist; President, Kate
        Executive Officer,                   Directors, Steelcase Inc.;            Vice President and Chief             Officer, TreeHouse Foods, Inc.         Directors, Contract                and Richard Wolters
        Forward Space, LLC                   Private Investor                      Financial Officer, Federal                                                  Pharmaceuticals Limited            Foundation; Chair, Steelcase
                                                                                   Express Corporation                                                                                            Foundation

                                                                                                                                                                                                                                    10
Steelcase Q1, 2021
U.S. industry macro-factors had been supportive of growth before
the COVID-19 pandemic
CORPORATE PROFITS AFTER-TAX (U.S.) UNEMPLOYMENT (U.S.) THE CONFERENCE BOARD
With IVA and CCA adjustments Unemployment Rate (%) MEASURE OF CEO CONFIDENCE (U.S.)
(Year-over-Year % change)
14% 80
15%
12%
10% 10% 60
5% 8%
40
0% 6%
4%
-5% 20
2%
-10%
0% 0
-15%
Q1 2015 Q1 2020 Q1 2015 May 2020
Jan 2015 Apr 2020
NON-RESIDENTIAL FIXED INVESTMENT (U.S.) ARCHITECTURAL BILLING INDEX (U.S.)
Equipment (In US$, billions) (Billings $ billions)
1,300
1,250 55
1,200
1,150 45
1,100
1,050 35
1,000
25
Q1 2015 Q1 2020 Jan 2015 May 2020
11
Sources: BEA, BLS, CEO Conference Board, and AIASteelcase Q1, 2021
EMEA industry macro-factors had been supportive of growth before the
COVID-19 pandemic
GERMANY TOTAL REAL GDP GROWTH FRANCE TOTAL REAL GDP GROWTH UK TOTAL REAL GDP GROWTH SPAIN TOTAL REAL GDP GROWTH
4% 4% 3% 2.4%
2.8% 2.4% 6%
3% 2.1% 1.8% 1.5% 1.9% 1.9% 3.8%
2% 1.0% 1.0% 2% 1.3% 1.4% 4% 3.0% 2.9%
2% 1.5% 1.5% 2.4% 2.0%
0.6% 0% 1% 2%
1%
0% 0%
0% -2%
-2%
-1% -1%
-4% -4%
-2%
-6% -2% -1.6% -6% -4.1%
-3% -2.3% -5.0%
2015 2016 2017 2018 2019 Q1 2015 2016 2017 2018 2019 Q1 2015 2016 2017 2018 2019 Q1
2015 2016 2017 2018 2019 Q1 2020
2020 2020
2020
HARMONIZED UNEMPLOYMENT RATE OIL PRICE PER BARREL (BRENT INDEX)
(% Monthly, seasonally adjusted)
30
$140
25
$120
20 $100
$80
15 Spain
$60
Italy
10 France $40
Eurozone
5 $20
Germany
$-
0
Jan 2015 June 2020
12
Sources: Eurostat, Energy Information AdministrationSteelcase Q1, 2021
Companies leveraged their workspaces in order to compete
more aggressively for scarce talent
What strategies are you using to
C-suite engagement places higher emphasis on performance
attract + retain talent?
Modernizing working environment
44% 42% 6% 86% Performance
(could now Favors
Decision criteria
Learning & development programs SCS value
include safety)
proposition
42% 43% 85%
Improving compensation packages
26% 53% 79%
Implementing flexible ways of working More
35% 42% 75% Aesthetic/price/ historical
functionality
Changing employee dress code
19% 33% 52%
Facilities & C-Suite
To a large extent To some extent Procurement
Decision Maker
PwC 21st CEO Survey, Talent 2018
13Steelcase Q1, 2021
The future of the office – Our current perspective
Now Near Far
Retrofitting Reconfiguring Reinvention
Key principles for these first two stages will be to focus on: Work environments of the
• Density of the workplace and its population future will be based on
• Geometry of the furniture arrangements science-based evidence and
• Division using screens, panels or other barriers emerging technologies.
More owned workstations Flexibility
More frequent cleaning New Materials
Supporting work from home 14
Distributed collaborationSteelcase Q1, 2021
Our investment in new and enhanced products accelerated in the last three years,
and we launched new product offerings that expanded our addressable market
Simpler Broader price Ancillary / Innovative
workstations points informal areas offerings
15Steelcase Q1, 2021
We established partnerships with other companies to increase
the breadth of our product offering
16Steelcase Q1, 2021
We invested over $300 million to enhance our offering through acquisitions
Broaden Strong,
Growth Channel
Addressable Stable
Model Leverage
Market Management
Revenue: ~£69 million* ~$82 million* ~$37 million*
Acquisition Date: August 2018 May 2018 November 2017
17
*Trailing twelve months revenue prior to acquisitionSteelcase Q1, 2021
We have generated strong cash flows to fund growth investments and
shareholder return
CASH FLOW FROM OPERATIONS AND ADJUSTED EBITDA CAPITAL EXPENDITURES VS. DEPRECIATION AND AMORTIZATION
MARGINS ($ MILLIONS)
($ MILLIONS)
Cash Flow From Operations
Capital Expenditures
$400 Adjusted EBITDA Margin 10%
$100 D&A
8%
$300
6%
$200
4%
$100
2%
$0
*
$0 0% FY16 FY17 FY18 FY19 FY20 TFQ
FY16 FY17 FY18 FY19 FY20 TFQ
QUARTERLY DIVIDENDS PAID PER SHARE DIVIDENDS AND SHARE REPURCHASES
($ MILLIONS)
$0.16 Dividends
Repurchases
$0.12
$100
$0.08
$0.04
$0.00
Q1 Q1 $0
FY21*** FY16 FY17 FY18 FY19 FY20 TFQ**
FY16
* Includes $26 for Replacement Corporate Aircraft
** The company repurchased 3 million shares during the first few weeks of March 2020 through a Rule 10b5-1 plan established in December 2019 18
*** Q1 FY21 dividends paid represented a 52% reduction compared to Q4 FY20Steelcase Q1, 2021
Our investments in the business generated strong return on invested capital before
impact of pandemic in most recent quarter
ADJUSTED RETURN ON INVESTED CAPITAL (ROIC) & ADJUSTED EBITDA ($M)
(% Adjusted Net Income of Average Capital)
Adj ROIC Adj EBITDA
16.0% $400
14.3%
13.8%
14.0% 13.3% $350
12.0%
12.0% $300
10.9%
10.5%
10.0% $250
8.0% $200
6.0% $150
4.0% $100
2.0% $50
0.0% $0
FY16 FY17 FY18 FY19 FY20 TFQ
19Steelcase Q1, 2021
Our balance sheet remained strong in Q1 and provides stability through business cycles
Q1 FY21, $ MILLION Q1 FY21 LIQUIDITY CHANGES
245
60 799
$1,500
701 COLI
160
Debt 39 8 161
COLI
160
$1,000
Cash
Cash
COLI 541 638
Equity
$500
Cash
$0 February 28, Net Borrowings Variable Share Dividends** Other May 29, 2020
Liquidity Profile Capital Base 2020 Under Credit Compensation Repurchases* Liquidity
Liquidity Facility and Benefit Plan
Contributions
and Payments
* The company repurchased 3 million shares during the first few weeks of March 2020 through a Rule 10b5-1 plan established in December 2019 20
** Q1 FY21 dividends paid represented a 52% reduction compared to Q4 FY20Steelcase Q1, 2021
Breakeven adjusted operating income estimate
As of July 1, 2020, with the level of temporary salary reductions and other cost
containment efforts we had in place, we estimated approximately $600 million
of quarterly revenue would result in breakeven adjusted operating income.
21Appendix
Learn more
22Appendix
Forward-looking statements
From time to time, in written and oral statements, we Forward-looking statements involve a number of risks and
discuss our expectations regarding future events and uncertainties that could cause actual results to vary from
our plans and objectives for future operations. our expectations because of factors such as, but not limited
to, competitive and general economic conditions
These forward-looking statements discuss goals, intentions domestically and internationally; acts of terrorism, war,
and expectations as to future trends, plans, events, results governmental action, natural disasters, pandemics, and
of operations or financial condition, or state other other Force Majeure events; the COVID-19 pandemic and
information relating to us, based on current beliefs of the actions taken by various governments and third parties
management as well as assumptions made by, and to combat the pandemic; changes in the legal and
information currently available to, us. Forward-looking regulatory environment; changes in raw material,
statements generally are accompanied by words such as commodity and other input costs; currency fluctuations;
“anticipate,” “believe,” “could,” “estimate,” “expect,” changes in customer demand; and the other risks and
“forecast,” “intend,” “may,” “possible,” “potential,” “predict,” contingencies detailed in our most recent Annual Report on
“project,” “target” or other similar words, phrases or Form 10-K and our other filings with the Securities and
expressions. Although we believe these forward-looking Exchange Commission. We undertake no obligation to
statements are reasonable, they are based upon a number update, amend or clarify forward-looking statements,
of assumptions concerning future conditions, any or all of whether as a result of new information, future events or
which may ultimately prove to be inaccurate. otherwise.
23Appendix
Segment revenue and earnings
AMERICAS – REVENUE EMEA – REVENUE OTHER CATEGORY – REVENUE
(US$ millions) (US$ millions) (US$ millions)
$2,673
$2,470 $2,431
$2,256 $2,232 $2,194 $670
$617 $608
$521 $524 $356 $381
$504 $338 $344
$283 $297
FY16 FY17 FY18 FY19 FY20 TFQ FY16 FY17 FY18 FY19 FY20 TFQ FY16 FY17 FY18 FY19 FY20 TFQ
AMERICAS – ADJUSTED OPERATING INCOME EMEA – ADJUSTED OPERATING INCOME (LOSS) OTHER CATEGORY –OPERATING INCOME MARGIN
MARGIN * MARGIN * (Percent of Revenue)
(Percent of Revenue) (Percent of Revenue)
11.4% 10.8% 1.5%
0.3% 10.3%
8.2% 8.5% 9.0% 8.8%
7.6%
6.3%
4.0% 4.7% 4.0%
-1.1%
-3.7% -2.7%
-8.5%
FY16 FY17 FY18 FY19 FY20 TFQ FY16 FY17 FY18 FY19 FY20 TFQ FY16 FY17 FY18 FY19 FY20** TFQ **
* Operating income restated due to implementation of ASU No. 2017-07, Compensation - Retirement Benefits (Topic 715). Please see Q1 FY19 10-Q for more information.
** Q4 FY20 included a $20.4M net gain on the sale of PolyVision in the Other Category 24Appendix
Select segment statistics (as of February 28, 2020)
END OF FISCAL YEAR 2020 AMERICAS EMEA OTHER CATEGORY
Number of Steelcase dealer locations ~ 400 ~ 350 ~ 50
Employees – non-manufacturing ~2,900 ~ 1,400 ~ 800
Employees – manufacturing ~ 5,500 ~ 1,300 ~ 800
Number of primary manufacturing locations Michigan – 2 France – 1 China – 1
Alabama – 1 Germany – 1 Malaysia – 1
Mexico – 2 Spain – 1 India – 1
Texas – 1 Czech Republic – 1
U.K. – 2
FY20 VERTICALS IN THE AMERICAS SEGMENT
15%
FY20 PRODUCT MIX FY20 LONG-TERM EMPLOYEE BENEFIT
10% OBLIGATIONS FUNDING STATUS
($ millions)
5%
Total Obligation $152
25% Other
0%
DTA
Education
Manufacturing
Government
Other
Insurance Services
Professional
State/Prov/Local
Financial Services
Healthcare
Information
Energy
Technology
Technical /
30% Seating
Federal
Gov
$160
$111
45% Systems/ After-tax
Storage Obligation
Product Mix Assets (COLI) Liabilities
25Appendix
Historic shares outstanding
SHARES (IN MILLIONS)
180
160 Class A Shares Class B Shares
140
120
100
26.9
80
87.9
60
40
14.1 139.2
20
0
FY98 FY99 FY00 FY01 FY02 FY03 FY04 FY05 FY06 FY07 FY08 FY09 FY10 FY11 FY12 FY13 FY14 FY15 FY16 FY17 FY18 FY19 FY20 Q1
FY21
26Appendix
Historical market data
ESTIMATED U.S. OFFICE FURNITURE SHIPMENTS
(USD billions)
$20
$15
$10
$5
$-
1997 1998 1999 2000 2001 2002 2003 2004 2005 2006 2007 2008 2009 2010 2011 2012 2013 2014 2015 2016 2017 2018 2019
EUROPEAN OFFICE FURNITURE CONSUMPTION
(EUR billions)
€ 14
€ 12
€ 10
€8
€6
€4
€2
€0
1997 1998 1999 2000 2001 2002 2003 2004 2005 2006 2007 2008 2009 2010 2011 2012 2013 2014 2015 2016 2017 2018
27
Sources: 1997-2015: internal Steelcase estimates, 2015-2019: BIFMA, CSILAppendix
Non-GAAP financial measures
This presentation contains certain non-GAAP financial measures. A “non- (3) adjusted Earnings Before Interest Taxes and Depreciation and Amortization
GAAP financial measure” is defined as a numerical measure of a company’s (EBITDA), which represents EBITDA, excluding restructuring and goodwill and
financial performance that excludes or includes amounts so as to be different intangible asset impairment charges, (4) adjusted Earnings Before Interest Taxes
than the most directly comparable measure calculated and presented in
and Depreciation and Amortization (EBITDA) margin, which represents EBITDA
accordance with GAAP in the statement of income, balance sheet or
statement of cash flows of the company. Pursuant to the requirements of margin, excluding restructuring and goodwill and intangible asset impairment
Regulation G, the company has provided a reconciliation of non-GAAP charges, and (5) adjusted return on invested capital (ROIC), which represents
financial measures to the most directly comparable GAAP financial measure. income before income tax expense, excluding interest expense, restructuring costs
The non-GAAP financial measures used within this presentation are: (1) and goodwill and intangible asset impairment charges, less income tax expense at
adjusted operating income (loss), which represents operating income (loss), an assumed long-term effective tax rate, divided by average capital (defined as the
excluding restructuring costs and goodwill and intangible asset impairment average of total debt and shareholders’ equity at the beginning and end of the
charges, (2) adjusted operating income (loss) margin, which represents applicable period). These measures are presented because management uses this
operating income (loss) margin, excluding restructuring costs and goodwill information to monitor and evaluate financial results and trends. Therefore,
and intangible asset impairment charges,
management believes this information is also useful for investors.
ADJUSTED OPERATING INCOME
$ Million FY08 FY09 FY10 FY11 FY12 FY13 FY14 FY15 FY16 FY17 FY18 FY19 FY20 TFQ
Operating Income/(Loss)
$203 $1 ($12) $52 $97 $59 $166 $137 $170 $196 $155 $184 $257 $177
as Restated*
Restructuring Costs - $38 $35 $31 $31 $35 $7 $41 $20 $5 - - - -
Goodwill and intangible asset
$21 $65 - - - $60 $13 - - - - - - $18
impairment charges
Adjusted Operating Income $225 $107 $27 $83 $124 $151 $180 $178 $190 $201 $155 $184 $257 $195
* Operating income restated due to implementation of ASU No. 2017-07, Compensation - Retirement Benefits
(Topic 715). Please see Q1 FY19 10-Q for more information.
28Appendix
Non-GAAP financial measures
AMERICAS ADJUSTED OPERATING INCOME MARGIN *
(Percent of Revenue)
FY16 FY17 FY18 FY19 FY20 TFQ
Operating Income
11.4% 10.7% 8.2% 8.5% 9.0% 7.6%
Margin as Restated *
Restructuring Costs
- 0.1% - - - -
(Benefits)
Adjusted Operating Income
11.4% 10.8% 8.2% 8.5% 9.0% 7.6%
Margin
* Operating income restated due to implementation of ASU No. 2017-07, Compensation - Retirement Benefits
(Topic 715). Please see Q1 FY19 10-Q for more information.
29Appendix
Non-GAAP financial measures
EMEA ADJUSTED OPERATING INCOME (LOSS) MARGIN *
(Percent of Revenue)
FY16 FY17 FY18 FY19 FY20 TFQ
Operating Income (Loss)
(12.4%) (4.1%) (2.7%) (1.1%) 1.5% (2.6%)
Margin as Restated *
Goodwill and intangible asset
- - - - - 2.9%
impairment charges
Restructuring Costs 3.9% 0.4% - - - -
Adjusted Operating Income
(8.5%) (3.7%) (2.7%) (1.1%) 1.5% 0.3%
(Loss) Margin
* Operating income restated due to implementation of ASU No. 2017-07, Compensation - Retirement
Benefits (Topic 715). Please see Q1 FY19 10-Q for more information.
30Appendix
Non-GAAP financial measures
ADJUSTED EBITDA MARGIN
$ Million FY16 FY17 FY18 FY19 FY20 TFQ
Revenue $3,060 $3,032 $3,055 $3,443 $3,724 $3,382
Income before income
$175 $196 $162 $164 $245 $166
tax expense
Interest Expense $18 $17 $18 $38 $27 $28
Depreciation and amortization $66 $60 $66 $82 $86 $88
Restructuring costs $20 $5 - - - -
Goodwill and intangible asset impairment charges - - - - - $18
Adjusted EBITDA $278 $279 $245 $283 $358 $300
Adjusted EBITDA Margin 9.1% 9.2% 8.0% 8.2% 9.6% 8.9%
(% of Revenue)
31Appendix
Non-GAAP financial measures
ADJUSTED RETURN ON INVESTED CAPITAL (ROIC)
$ Million FY16 FY17 FY18 FY19 FY20 TFQ
Income before income tax expense $175 $196 $162 $164 $245 $166
Interest Expense $18 $17 $18 $38 $27 $28
Restructuring costs $20 $5 - - - -
Goodwill and intangible asset impairment charges - - - - - $18
Adjusted Income before income tax expense $213 $218 $180 $201 $273 $212
Assumed Long-Term Effective Income Tax Rate % 36.0% 36.0% 34.5% 27.0%(1) 27.0% 27.0%
Adjusted Net Income $136 $140 $118 $147 $199 $155
Total Debt $299 $297 $295 $487 $484 $729
Total shareholders’ equity $737 $767 $813 $850 $970 $881
Total Capital $1,036 $1,064 $1,108 $1,337 $1,455 $1,610
Prior Year Total Capital $946 $1,036 $1,064 $1,108 $1,337 $1,339
Average Capital $991 $1,050 $1,086 $1,223 $1,396 $1,475
Adjusted Return on Invested Capital (ROIC)
13.8% 13.3% 10.9% 12.0% 14.3% 10.5%
(Adjusted Net Income as a % of Average Capital)
(1) Assumes 10 months at 36% and 2 months at 27% as after U.S. Tax Reform
32© 2020 Steelcase Inc. Trademarks used herein are the property of Steelcase Inc. or of their respective owners. 33
You can also read